Zip Codes with the Highest Percentage of Population Employed in Installation, Maintenance & Repair in Louisville, KY
RELATED REPORTS & OPTIONS
Installation, Maintenance & Repair
Louisville
Compare Zip Codes
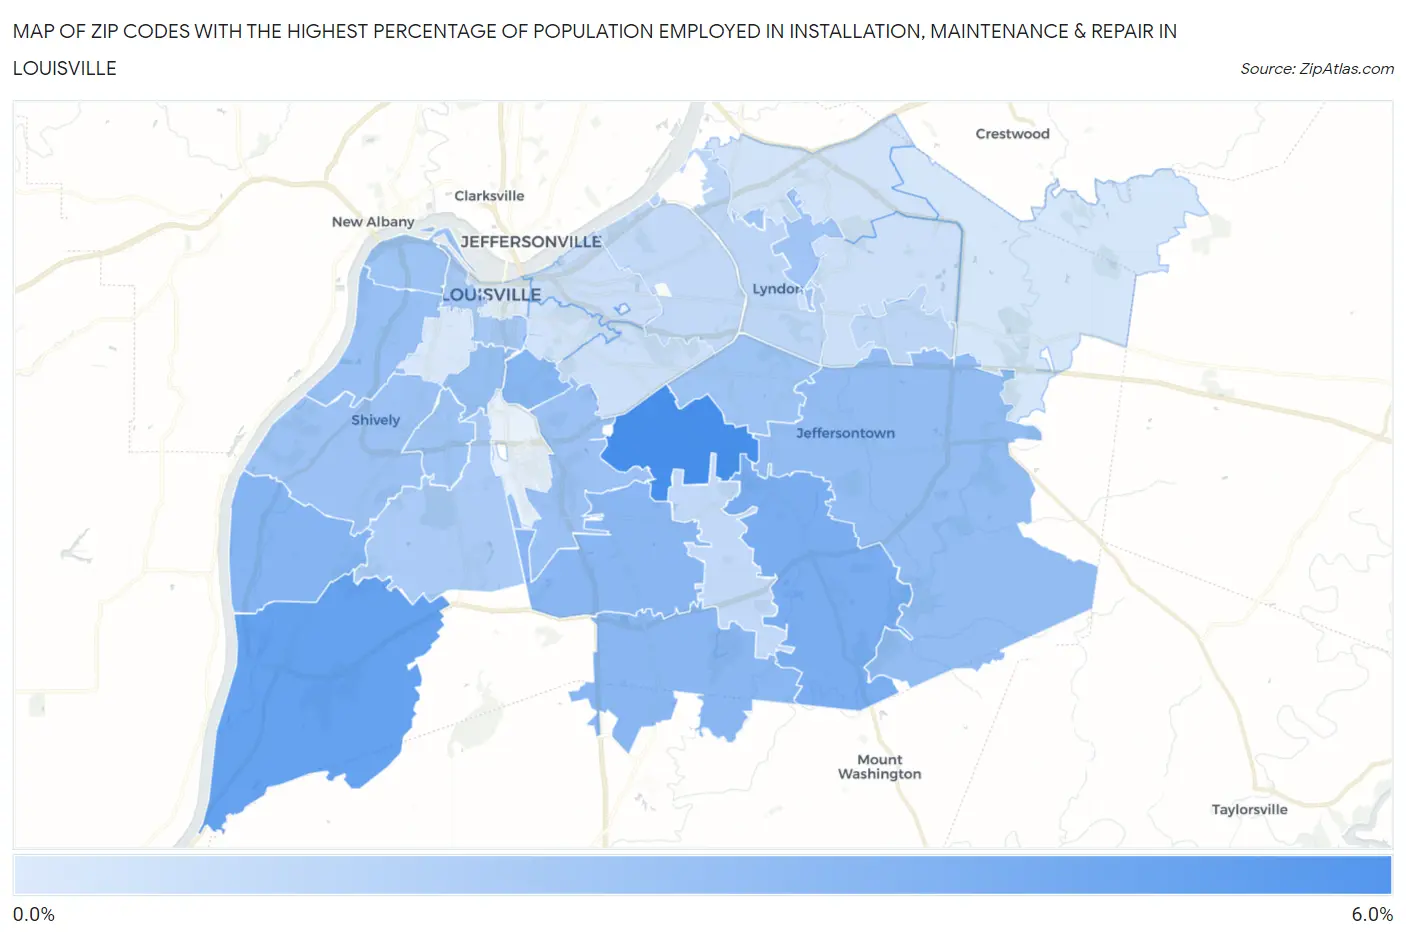
Map of Zip Codes with the Highest Percentage of Population Employed in Installation, Maintenance & Repair in Louisville
0.66%
5.6%
Zip Codes with the Highest Percentage of Population Employed in Installation, Maintenance & Repair in Louisville, KY
| Zip Code | % Employed | vs State | vs National | |
| 1. | 40218 | 5.6% | 3.5%(+2.02)#208 | 3.1%(+2.48)#7,143 |
| 2. | 40272 | 4.6% | 3.5%(+1.04)#265 | 3.1%(+1.50)#10,177 |
| 3. | 40291 | 3.8% | 3.5%(+0.309)#323 | 3.1%(+0.768)#13,085 |
| 4. | 40258 | 3.5% | 3.5%(-0.015)#342 | 3.1%(+0.445)#14,568 |
| 5. | 40217 | 3.4% | 3.5%(-0.103)#355 | 3.1%(+0.356)#14,979 |
| 6. | 40219 | 3.3% | 3.5%(-0.189)#361 | 3.1%(+0.271)#15,368 |
| 7. | 40229 | 3.3% | 3.5%(-0.223)#365 | 3.1%(+0.236)#15,535 |
| 8. | 40299 | 3.1% | 3.5%(-0.452)#381 | 3.1%(+0.007)#16,644 |
| 9. | 40208 | 3.0% | 3.5%(-0.549)#388 | 3.1%(-0.089)#17,092 |
| 10. | 40211 | 2.9% | 3.5%(-0.630)#393 | 3.1%(-0.171)#17,510 |
| 11. | 40213 | 2.8% | 3.5%(-0.721)#402 | 3.1%(-0.262)#17,974 |
| 12. | 40216 | 2.8% | 3.5%(-0.756)#404 | 3.1%(-0.297)#18,158 |
| 13. | 40215 | 2.7% | 3.5%(-0.827)#411 | 3.1%(-0.367)#18,547 |
| 14. | 40220 | 2.6% | 3.5%(-0.881)#414 | 3.1%(-0.421)#18,831 |
| 15. | 40212 | 2.6% | 3.5%(-0.884)#415 | 3.1%(-0.424)#18,850 |
| 16. | 40242 | 2.6% | 3.5%(-0.911)#418 | 3.1%(-0.451)#18,996 |
| 17. | 40203 | 2.4% | 3.5%(-1.11)#438 | 3.1%(-0.652)#19,988 |
| 18. | 40214 | 2.3% | 3.5%(-1.26)#450 | 3.1%(-0.802)#20,757 |
| 19. | 40243 | 1.7% | 3.5%(-1.81)#492 | 3.1%(-1.35)#23,282 |
| 20. | 40222 | 1.7% | 3.5%(-1.86)#495 | 3.1%(-1.40)#23,473 |
| 21. | 40207 | 1.6% | 3.5%(-1.98)#506 | 3.1%(-1.52)#23,960 |
| 22. | 40228 | 1.6% | 3.5%(-1.98)#507 | 3.1%(-1.52)#23,962 |
| 23. | 40206 | 1.3% | 3.5%(-2.26)#525 | 3.1%(-1.80)#25,004 |
| 24. | 40223 | 1.2% | 3.5%(-2.32)#530 | 3.1%(-1.86)#25,255 |
| 25. | 40205 | 1.2% | 3.5%(-2.34)#533 | 3.1%(-1.88)#25,295 |
| 26. | 40241 | 1.0% | 3.5%(-2.49)#540 | 3.1%(-2.03)#25,825 |
| 27. | 40204 | 1.0% | 3.5%(-2.50)#541 | 3.1%(-2.05)#25,867 |
| 28. | 40245 | 0.87% | 3.5%(-2.65)#544 | 3.1%(-2.19)#26,272 |
| 29. | 40210 | 0.83% | 3.5%(-2.70)#548 | 3.1%(-2.24)#26,394 |
| 30. | 40202 | 0.66% | 3.5%(-2.87)#555 | 3.1%(-2.41)#26,883 |
1
Common Questions
What are the Top 10 Zip Codes with the Highest Percentage of Population Employed in Installation, Maintenance & Repair in Louisville, KY?
Top 10 Zip Codes with the Highest Percentage of Population Employed in Installation, Maintenance & Repair in Louisville, KY are:
What zip code has the Highest Percentage of Population Employed in Installation, Maintenance & Repair in Louisville, KY?
40218 has the Highest Percentage of Population Employed in Installation, Maintenance & Repair in Louisville, KY with 5.6%.
What is the Percentage of Population Employed in Installation, Maintenance & Repair in Louisville, KY?
Percentage of Population Employed in Installation, Maintenance & Repair in Louisville is 2.6%.
What is the Percentage of Population Employed in Installation, Maintenance & Repair in Kentucky?
Percentage of Population Employed in Installation, Maintenance & Repair in Kentucky is 3.5%.
What is the Percentage of Population Employed in Installation, Maintenance & Repair in the United States?
Percentage of Population Employed in Installation, Maintenance & Repair in the United States is 3.1%.