Zip Codes with the Highest Percentage of Population Employed in Cleaning & Maintenance in Louisville, KY
RELATED REPORTS & OPTIONS
Cleaning & Maintenance
Louisville
Compare Zip Codes
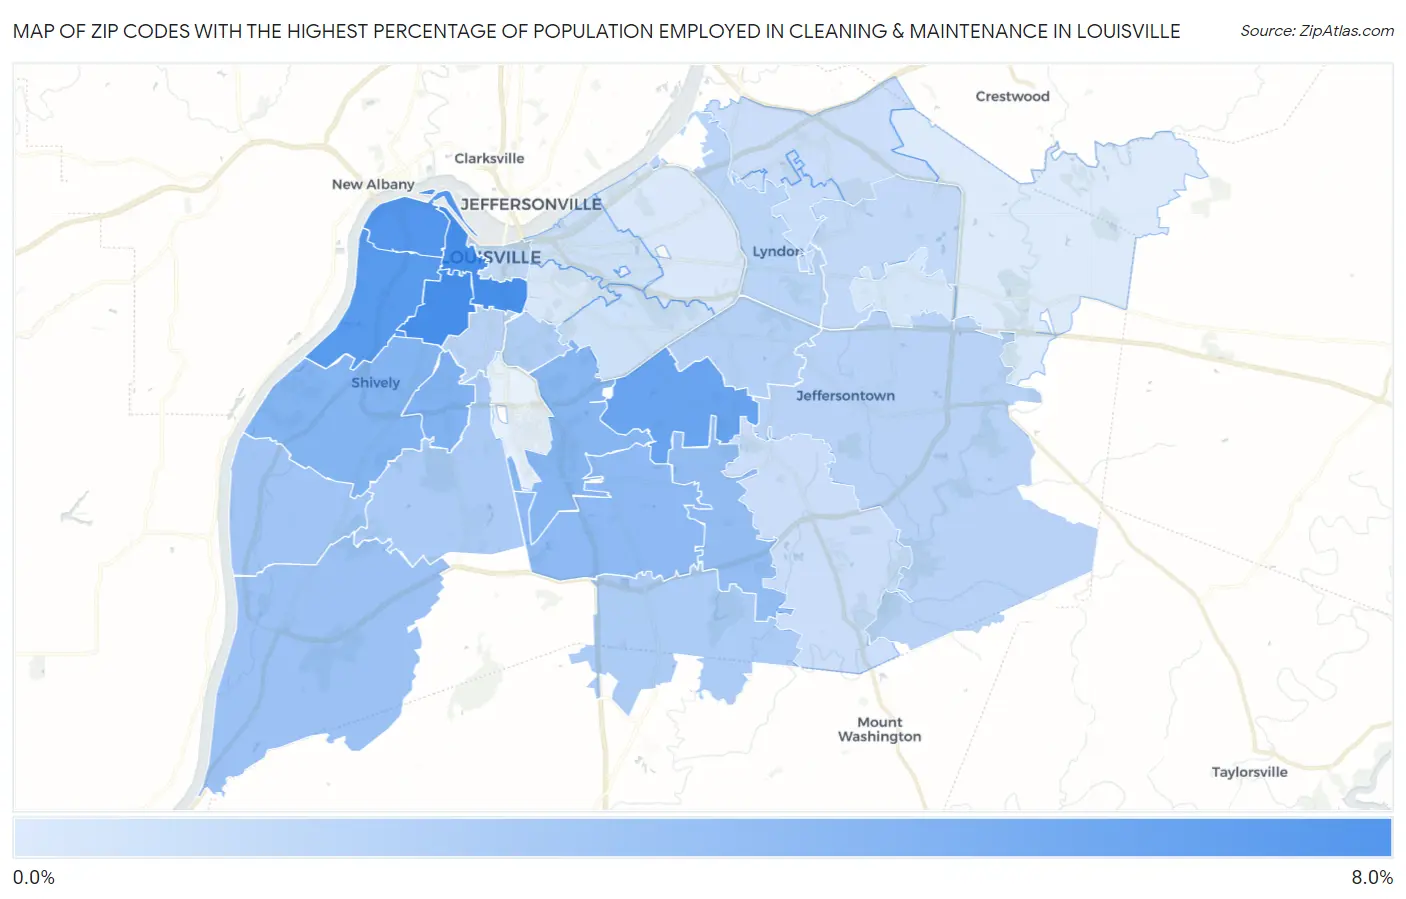
Map of Zip Codes with the Highest Percentage of Population Employed in Cleaning & Maintenance in Louisville
0.83%
6.4%
Zip Codes with the Highest Percentage of Population Employed in Cleaning & Maintenance in Louisville, KY
| Zip Code | % Employed | vs State | vs National | |
| 1. | 40203 | 6.4% | 3.3%(+3.13)#115 | 3.5%(+2.96)#4,867 |
| 2. | 40210 | 6.4% | 3.3%(+3.11)#116 | 3.5%(+2.94)#4,906 |
| 3. | 40212 | 5.9% | 3.3%(+2.58)#140 | 3.5%(+2.41)#5,855 |
| 4. | 40211 | 5.8% | 3.3%(+2.52)#144 | 3.5%(+2.35)#5,987 |
| 5. | 40218 | 5.1% | 3.3%(+1.76)#171 | 3.5%(+1.59)#7,761 |
| 6. | 40215 | 4.3% | 3.3%(+0.947)#208 | 3.5%(+0.776)#10,320 |
| 7. | 40216 | 4.1% | 3.3%(+0.836)#216 | 3.5%(+0.666)#10,750 |
| 8. | 40213 | 4.0% | 3.3%(+0.712)#222 | 3.5%(+0.541)#11,254 |
| 9. | 40219 | 3.7% | 3.3%(+0.392)#247 | 3.5%(+0.222)#12,519 |
| 10. | 40228 | 3.6% | 3.3%(+0.266)#259 | 3.5%(+0.096)#13,079 |
| 11. | 40272 | 3.2% | 3.3%(-0.096)#287 | 3.5%(-0.267)#14,802 |
| 12. | 40258 | 3.0% | 3.3%(-0.308)#316 | 3.5%(-0.479)#15,858 |
| 13. | 40214 | 2.7% | 3.3%(-0.614)#347 | 3.5%(-0.785)#17,472 |
| 14. | 40229 | 2.6% | 3.3%(-0.746)#360 | 3.5%(-0.916)#18,149 |
| 15. | 40217 | 2.5% | 3.3%(-0.799)#362 | 3.5%(-0.969)#18,402 |
| 16. | 40220 | 2.3% | 3.3%(-0.970)#378 | 3.5%(-1.14)#19,325 |
| 17. | 40208 | 2.2% | 3.3%(-1.12)#391 | 3.5%(-1.29)#20,110 |
| 18. | 40299 | 2.2% | 3.3%(-1.13)#394 | 3.5%(-1.30)#20,162 |
| 19. | 40222 | 2.1% | 3.3%(-1.19)#402 | 3.5%(-1.36)#20,442 |
| 20. | 40223 | 1.8% | 3.3%(-1.46)#426 | 3.5%(-1.64)#21,824 |
| 21. | 40202 | 1.8% | 3.3%(-1.49)#430 | 3.5%(-1.66)#21,969 |
| 22. | 40242 | 1.6% | 3.3%(-1.71)#454 | 3.5%(-1.88)#23,028 |
| 23. | 40291 | 1.5% | 3.3%(-1.80)#462 | 3.5%(-1.98)#23,456 |
| 24. | 40241 | 1.5% | 3.3%(-1.85)#469 | 3.5%(-2.02)#23,658 |
| 25. | 40206 | 1.4% | 3.3%(-1.96)#476 | 3.5%(-2.13)#24,139 |
| 26. | 40205 | 1.3% | 3.3%(-1.97)#477 | 3.5%(-2.14)#24,208 |
| 27. | 40243 | 1.1% | 3.3%(-2.22)#488 | 3.5%(-2.39)#25,172 |
| 28. | 40204 | 1.0% | 3.3%(-2.30)#494 | 3.5%(-2.47)#25,477 |
| 29. | 40207 | 0.88% | 3.3%(-2.43)#499 | 3.5%(-2.60)#25,867 |
| 30. | 40245 | 0.83% | 3.3%(-2.49)#504 | 3.5%(-2.66)#26,082 |
1
Common Questions
What are the Top 10 Zip Codes with the Highest Percentage of Population Employed in Cleaning & Maintenance in Louisville, KY?
Top 10 Zip Codes with the Highest Percentage of Population Employed in Cleaning & Maintenance in Louisville, KY are:
What zip code has the Highest Percentage of Population Employed in Cleaning & Maintenance in Louisville, KY?
40203 has the Highest Percentage of Population Employed in Cleaning & Maintenance in Louisville, KY with 6.4%.
What is the Percentage of Population Employed in Cleaning & Maintenance in Louisville, KY?
Percentage of Population Employed in Cleaning & Maintenance in Louisville is 2.8%.
What is the Percentage of Population Employed in Cleaning & Maintenance in Kentucky?
Percentage of Population Employed in Cleaning & Maintenance in Kentucky is 3.3%.
What is the Percentage of Population Employed in Cleaning & Maintenance in the United States?
Percentage of Population Employed in Cleaning & Maintenance in the United States is 3.5%.