Zip Codes with the Highest Percentage of Population Employed in Firefighting & Prevention in Louisville, KY
RELATED REPORTS & OPTIONS
Firefighting & Prevention
Louisville
Compare Zip Codes
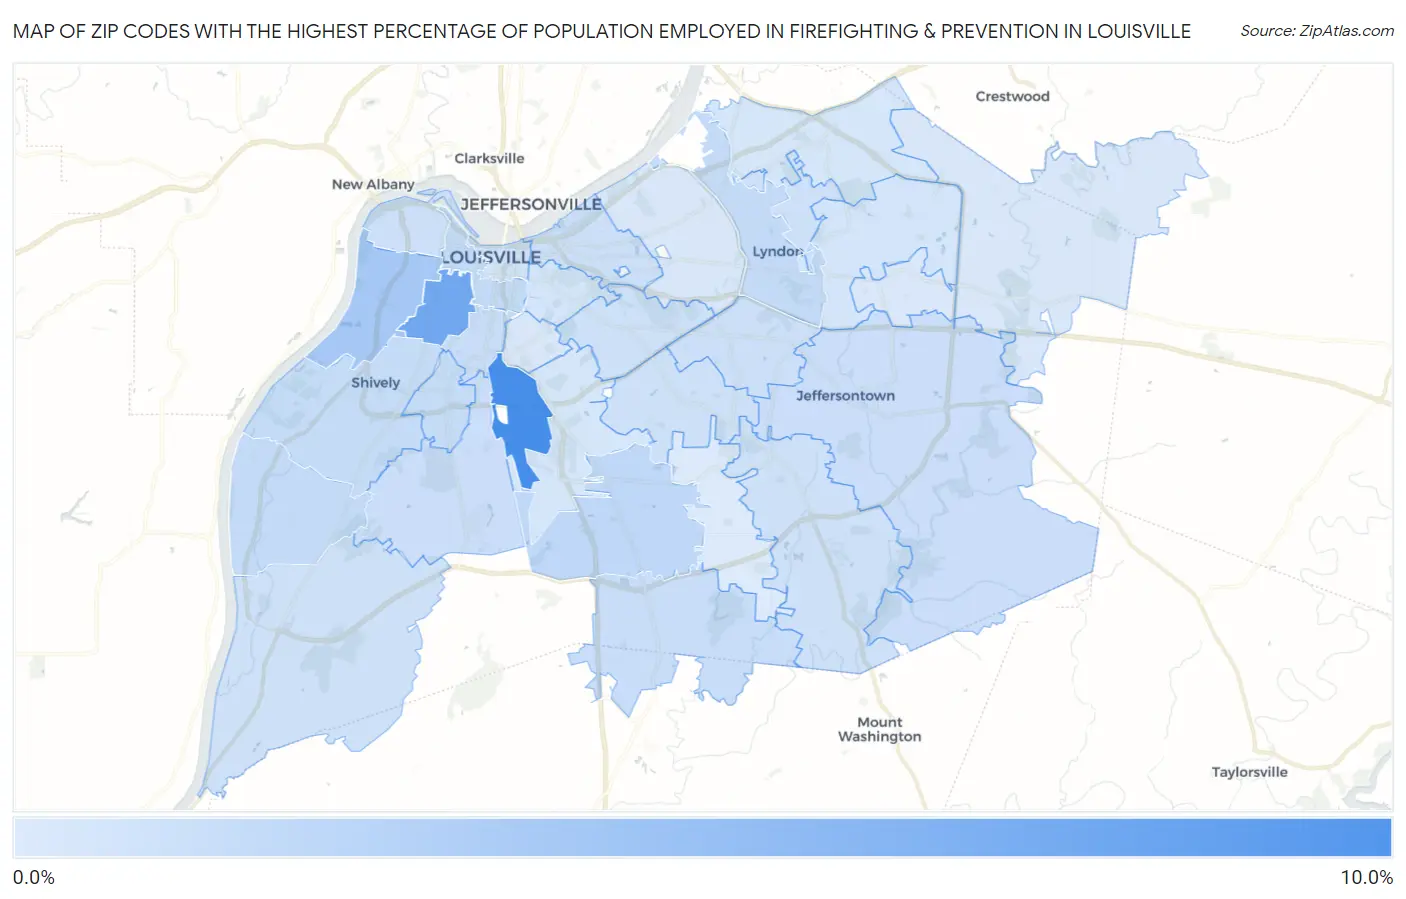
Map of Zip Codes with the Highest Percentage of Population Employed in Firefighting & Prevention in Louisville
0.091%
9.6%
Zip Codes with the Highest Percentage of Population Employed in Firefighting & Prevention in Louisville, KY
| Zip Code | % Employed | vs State | vs National | |
| 1. | 40209 | 9.6% | 1.1%(+8.44)#8 | 1.2%(+8.39)#322 |
| 2. | 40210 | 6.9% | 1.1%(+5.72)#14 | 1.2%(+5.67)#534 |
| 3. | 40211 | 3.4% | 1.1%(+2.29)#43 | 1.2%(+2.24)#1,791 |
| 4. | 40219 | 1.9% | 1.1%(+0.810)#98 | 1.2%(+0.759)#4,721 |
| 5. | 40222 | 1.6% | 1.1%(+0.503)#123 | 1.2%(+0.452)#6,178 |
| 6. | 40203 | 1.6% | 1.1%(+0.501)#124 | 1.2%(+0.450)#6,187 |
| 7. | 40258 | 1.6% | 1.1%(+0.481)#125 | 1.2%(+0.430)#6,298 |
| 8. | 40215 | 1.5% | 1.1%(+0.328)#138 | 1.2%(+0.277)#7,217 |
| 9. | 40216 | 1.4% | 1.1%(+0.306)#143 | 1.2%(+0.255)#7,368 |
| 10. | 40208 | 1.4% | 1.1%(+0.253)#148 | 1.2%(+0.202)#7,728 |
| 11. | 40229 | 1.3% | 1.1%(+0.185)#157 | 1.2%(+0.134)#8,202 |
| 12. | 40299 | 1.3% | 1.1%(+0.140)#162 | 1.2%(+0.090)#8,538 |
| 13. | 40214 | 1.2% | 1.1%(+0.048)#176 | 1.2%(-0.003)#9,291 |
| 14. | 40206 | 1.1% | 1.1%(+0.003)#185 | 1.2%(-0.048)#9,746 |
| 15. | 40220 | 1.1% | 1.1%(+0.001)#188 | 1.2%(-0.050)#9,770 |
| 16. | 40212 | 1.1% | 1.1%(-0.028)#195 | 1.2%(-0.078)#10,045 |
| 17. | 40218 | 1.00% | 1.1%(-0.139)#213 | 1.2%(-0.190)#11,130 |
| 18. | 40205 | 0.95% | 1.1%(-0.189)#220 | 1.2%(-0.240)#11,686 |
| 19. | 40272 | 0.93% | 1.1%(-0.207)#221 | 1.2%(-0.258)#11,871 |
| 20. | 40242 | 0.88% | 1.1%(-0.252)#230 | 1.2%(-0.303)#12,340 |
| 21. | 40291 | 0.86% | 1.1%(-0.271)#234 | 1.2%(-0.322)#12,538 |
| 22. | 40202 | 0.74% | 1.1%(-0.390)#257 | 1.2%(-0.441)#13,826 |
| 23. | 40204 | 0.64% | 1.1%(-0.490)#272 | 1.2%(-0.541)#14,958 |
| 24. | 40223 | 0.61% | 1.1%(-0.525)#280 | 1.2%(-0.576)#15,315 |
| 25. | 40213 | 0.50% | 1.1%(-0.633)#297 | 1.2%(-0.684)#16,531 |
| 26. | 40241 | 0.46% | 1.1%(-0.676)#303 | 1.2%(-0.726)#16,994 |
| 27. | 40245 | 0.39% | 1.1%(-0.740)#315 | 1.2%(-0.791)#17,712 |
| 28. | 40217 | 0.37% | 1.1%(-0.763)#325 | 1.2%(-0.814)#17,978 |
| 29. | 40207 | 0.32% | 1.1%(-0.811)#333 | 1.2%(-0.861)#18,502 |
| 30. | 40243 | 0.24% | 1.1%(-0.899)#345 | 1.2%(-0.950)#19,369 |
| 31. | 40228 | 0.091% | 1.1%(-1.04)#353 | 1.2%(-1.09)#20,341 |
1
Common Questions
What are the Top 10 Zip Codes with the Highest Percentage of Population Employed in Firefighting & Prevention in Louisville, KY?
Top 10 Zip Codes with the Highest Percentage of Population Employed in Firefighting & Prevention in Louisville, KY are:
What zip code has the Highest Percentage of Population Employed in Firefighting & Prevention in Louisville, KY?
40209 has the Highest Percentage of Population Employed in Firefighting & Prevention in Louisville, KY with 9.6%.
What is the Percentage of Population Employed in Firefighting & Prevention in Louisville, KY?
Percentage of Population Employed in Firefighting & Prevention in Louisville is 1.2%.
What is the Percentage of Population Employed in Firefighting & Prevention in Kentucky?
Percentage of Population Employed in Firefighting & Prevention in Kentucky is 1.1%.
What is the Percentage of Population Employed in Firefighting & Prevention in the United States?
Percentage of Population Employed in Firefighting & Prevention in the United States is 1.2%.