Zip Codes with the Highest Percentage of Population Employed in Office & Administration in Lawrence, KS
RELATED REPORTS & OPTIONS
Office & Administration
Lawrence
Compare Zip Codes
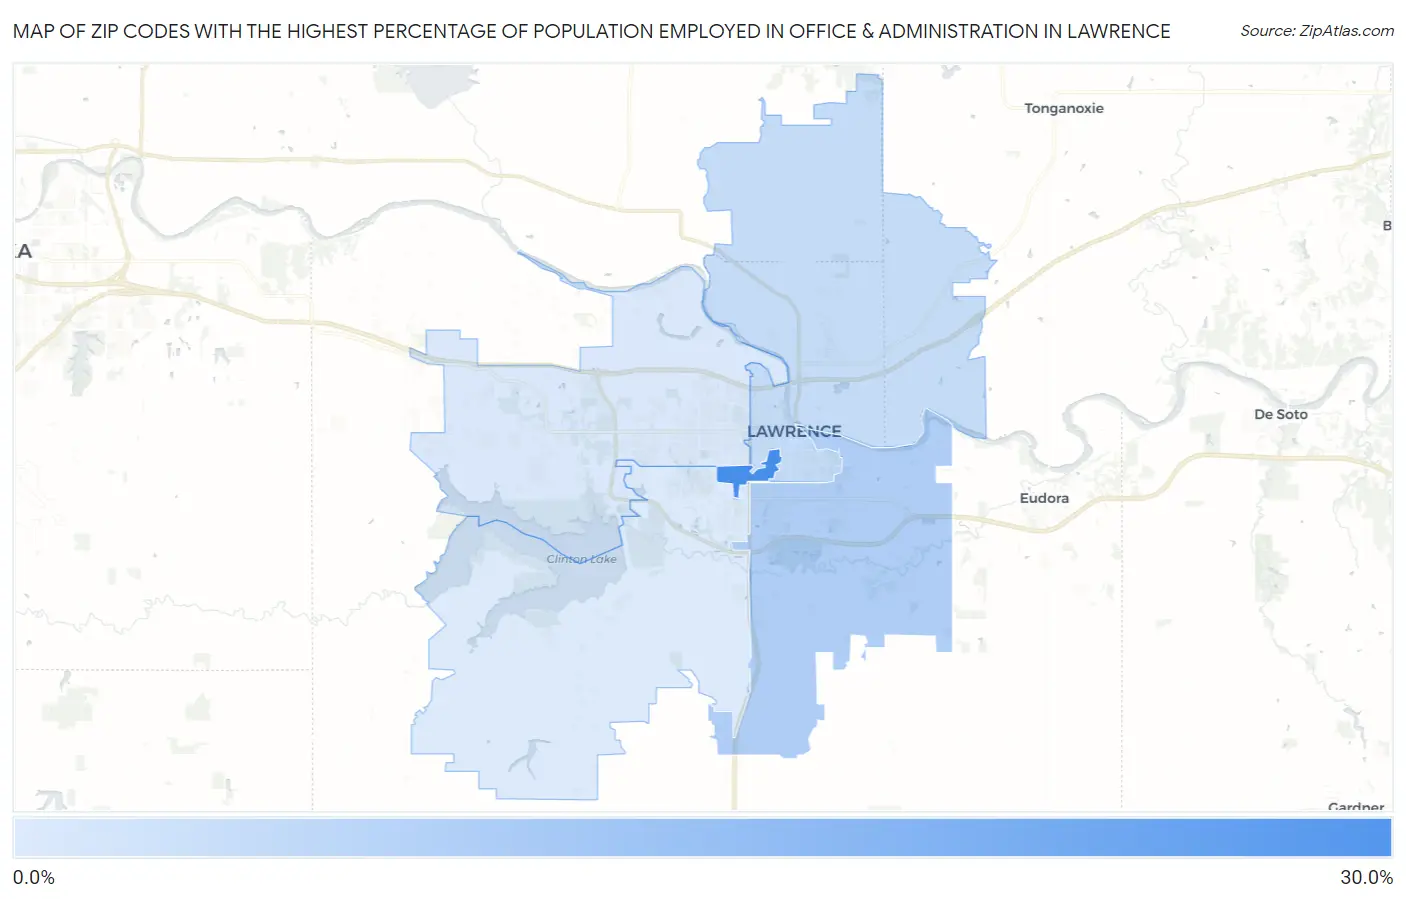
Map of Zip Codes with the Highest Percentage of Population Employed in Office & Administration in Lawrence
8.4%
28.3%
Zip Codes with the Highest Percentage of Population Employed in Office & Administration in Lawrence, KS
| Zip Code | % Employed | vs State | vs National | |
| 1. | 66045 | 28.3% | 10.6%(+17.7)#17 | 10.9%(+17.4)#662 |
| 2. | 66046 | 14.2% | 10.6%(+3.58)#123 | 10.9%(+3.35)#5,695 |
| 3. | 66044 | 11.3% | 10.6%(+0.667)#265 | 10.9%(+0.445)#12,881 |
| 4. | 66049 | 8.8% | 10.6%(-1.83)#422 | 10.9%(-2.05)#20,821 |
| 5. | 66047 | 8.4% | 10.6%(-2.21)#448 | 10.9%(-2.44)#21,904 |
1
Common Questions
What are the Top 3 Zip Codes with the Highest Percentage of Population Employed in Office & Administration in Lawrence, KS?
Top 3 Zip Codes with the Highest Percentage of Population Employed in Office & Administration in Lawrence, KS are:
What zip code has the Highest Percentage of Population Employed in Office & Administration in Lawrence, KS?
66045 has the Highest Percentage of Population Employed in Office & Administration in Lawrence, KS with 28.3%.
What is the Percentage of Population Employed in Office & Administration in Lawrence, KS?
Percentage of Population Employed in Office & Administration in Lawrence is 10.5%.
What is the Percentage of Population Employed in Office & Administration in Kansas?
Percentage of Population Employed in Office & Administration in Kansas is 10.6%.
What is the Percentage of Population Employed in Office & Administration in the United States?
Percentage of Population Employed in Office & Administration in the United States is 10.9%.