Zip Codes with the Highest Percentage of Population Employed in Office & Administration in Mission, KS
RELATED REPORTS & OPTIONS
Office & Administration
Mission
Compare Zip Codes
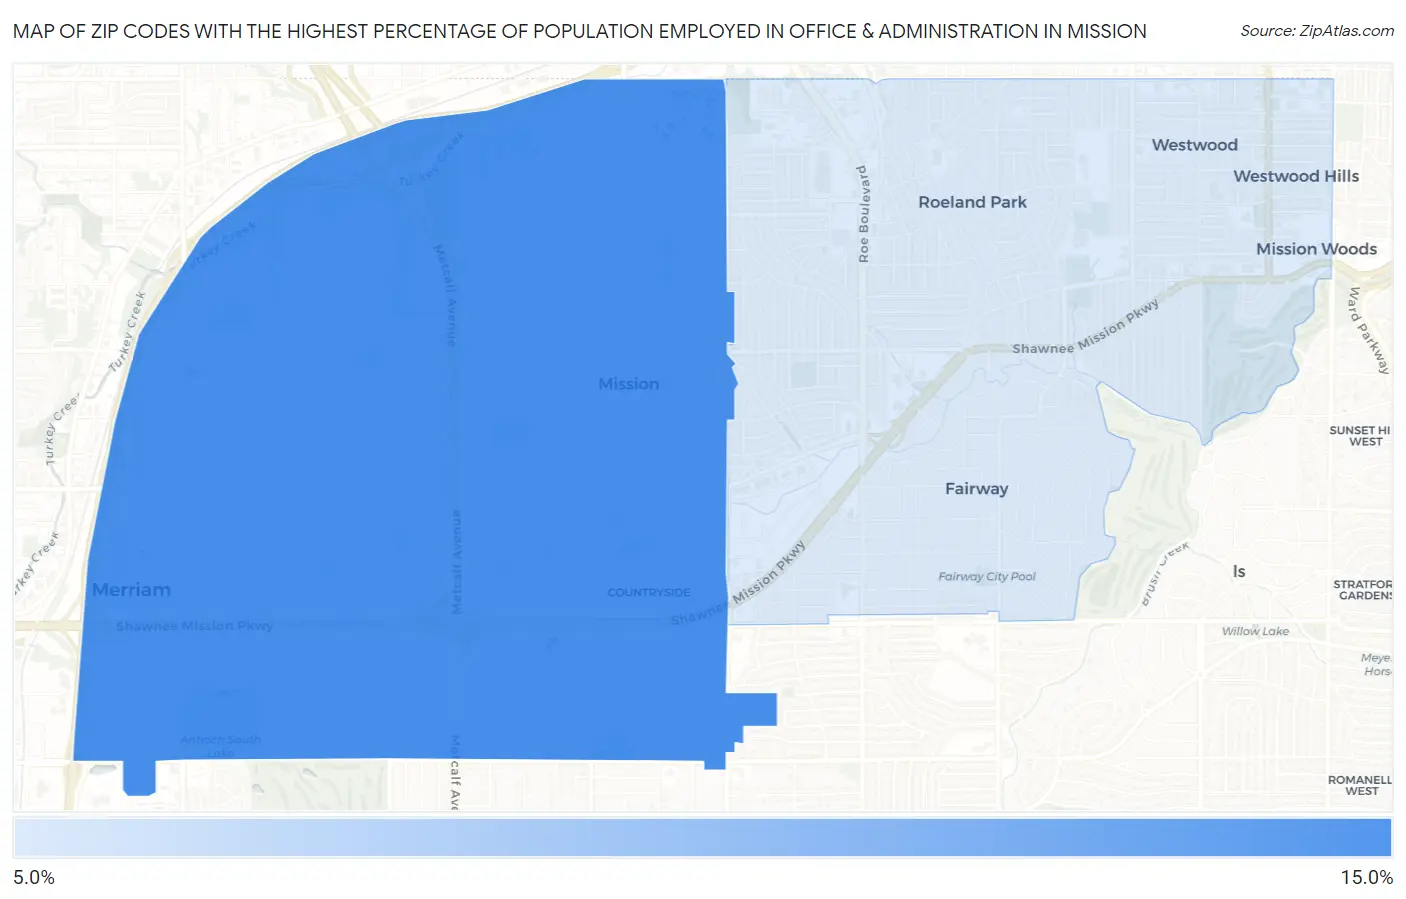
Map of Zip Codes with the Highest Percentage of Population Employed in Office & Administration in Mission
6.8%
13.0%
Zip Codes with the Highest Percentage of Population Employed in Office & Administration in Mission, KS
| Zip Code | % Employed | vs State | vs National | |
| 1. | 66202 | 13.0% | 10.6%(+2.37)#173 | 10.9%(+2.14)#8,065 |
| 2. | 66205 | 6.8% | 10.6%(-3.79)#533 | 10.9%(-4.01)#25,504 |
1
Common Questions
What are the Top Zip Codes with the Highest Percentage of Population Employed in Office & Administration in Mission, KS?
Top Zip Codes with the Highest Percentage of Population Employed in Office & Administration in Mission, KS are:
What zip code has the Highest Percentage of Population Employed in Office & Administration in Mission, KS?
66202 has the Highest Percentage of Population Employed in Office & Administration in Mission, KS with 13.0%.
What is the Percentage of Population Employed in Office & Administration in Mission, KS?
Percentage of Population Employed in Office & Administration in Mission is 11.3%.
What is the Percentage of Population Employed in Office & Administration in Kansas?
Percentage of Population Employed in Office & Administration in Kansas is 10.6%.
What is the Percentage of Population Employed in Office & Administration in the United States?
Percentage of Population Employed in Office & Administration in the United States is 10.9%.