Aucilla, FL Map & Demographics
Aucilla Map
Aucilla Overview
$61,117
PER CAPITA INCOME
0.61
INEQUALITY / GINI INDEX
179
TOTAL POPULATION
59
MALE POPULATION
120
FEMALE POPULATION
49.17
MALES / 100 FEMALES
203.39
FEMALES / 100 MALES
59.2
MEDIAN AGE
2.2
AVG FAMILY SIZE
1.8
AVG HOUSEHOLD SIZE
90
LABOR FORCE [ PEOPLE ]
59.2%
PERCENT IN LABOR FORCE
22.2%
UNEMPLOYMENT RATE
Income in Aucilla
Income Overview in Aucilla
| Characteristic | Number | Measure |
| Per Capita Income | 179 | $61,117 |
| Median Family Income | 66 | $0 |
| Mean Family Income | 66 | $156,267 |
| Median Household Income | 100 | $0 |
| Mean Household Income | 100 | $113,123 |
| Income Deficit | 66 | $0 |
| Wage / Income Gap (%) | 179 | 0.00% |
| Wage / Income Gap ($) | 179 | 100.00¢ per $1 |
| Gini / Inequality Index | 179 | 0.61 |
Earnings by Sex in Aucilla
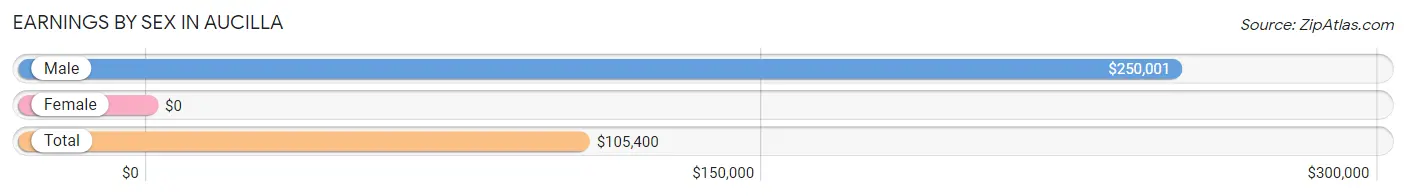
| Sex | Number | Average Earnings |
| Male | 32 (35.6%) | $250,001 |
| Female | 58 (64.4%) | $0 |
| Total | 90 (100.0%) | $105,400 |
Earnings by Sex by Income Bracket in Aucilla
The most common earnings brackets in Aucilla are $100,000+ for men (24 | 75.0%) and $100,000+ for women (25 | 43.1%).
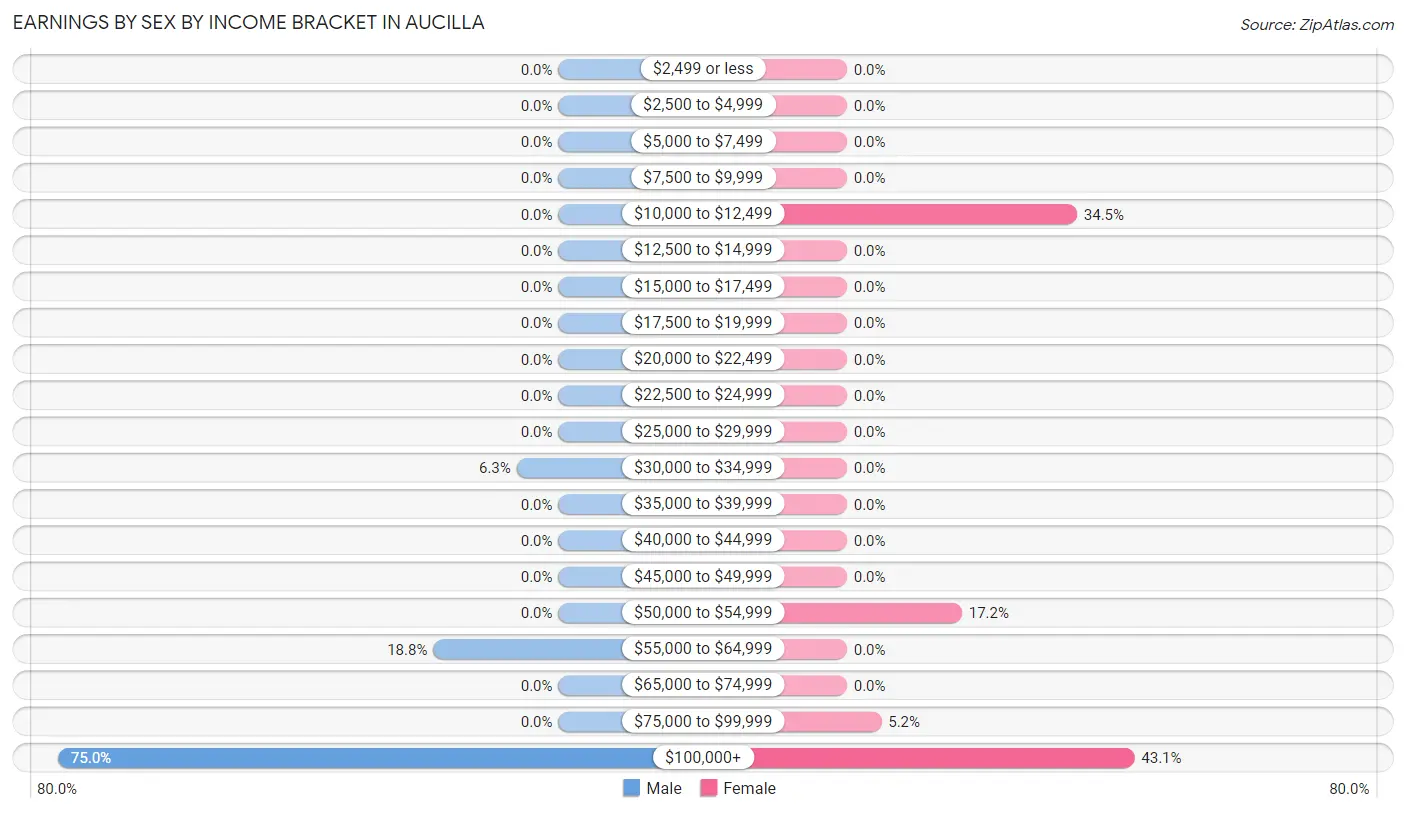
| Income | Male | Female |
| $2,499 or less | 0 (0.0%) | 0 (0.0%) |
| $2,500 to $4,999 | 0 (0.0%) | 0 (0.0%) |
| $5,000 to $7,499 | 0 (0.0%) | 0 (0.0%) |
| $7,500 to $9,999 | 0 (0.0%) | 0 (0.0%) |
| $10,000 to $12,499 | 0 (0.0%) | 20 (34.5%) |
| $12,500 to $14,999 | 0 (0.0%) | 0 (0.0%) |
| $15,000 to $17,499 | 0 (0.0%) | 0 (0.0%) |
| $17,500 to $19,999 | 0 (0.0%) | 0 (0.0%) |
| $20,000 to $22,499 | 0 (0.0%) | 0 (0.0%) |
| $22,500 to $24,999 | 0 (0.0%) | 0 (0.0%) |
| $25,000 to $29,999 | 0 (0.0%) | 0 (0.0%) |
| $30,000 to $34,999 | 2 (6.2%) | 0 (0.0%) |
| $35,000 to $39,999 | 0 (0.0%) | 0 (0.0%) |
| $40,000 to $44,999 | 0 (0.0%) | 0 (0.0%) |
| $45,000 to $49,999 | 0 (0.0%) | 0 (0.0%) |
| $50,000 to $54,999 | 0 (0.0%) | 10 (17.2%) |
| $55,000 to $64,999 | 6 (18.8%) | 0 (0.0%) |
| $65,000 to $74,999 | 0 (0.0%) | 0 (0.0%) |
| $75,000 to $99,999 | 0 (0.0%) | 3 (5.2%) |
| $100,000+ | 24 (75.0%) | 25 (43.1%) |
| Total | 32 (100.0%) | 58 (100.0%) |
Earnings by Sex by Educational Attainment in Aucilla
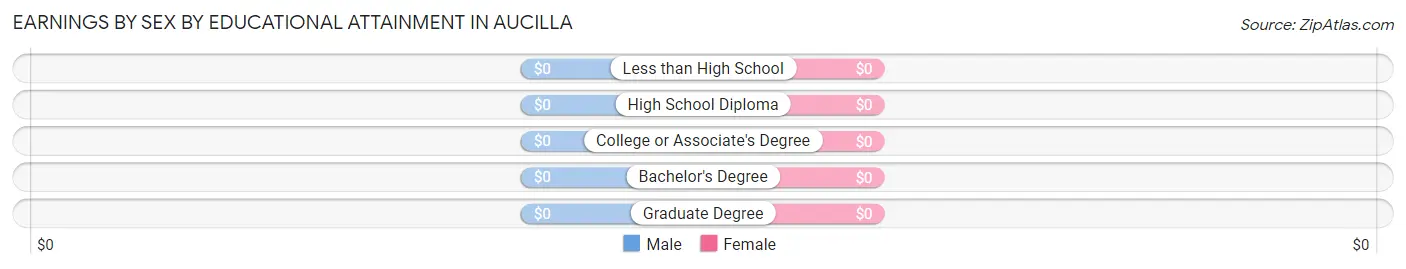
| Educational Attainment | Male Income | Female Income |
| Less than High School | - | - |
| High School Diploma | - | - |
| College or Associate's Degree | - | - |
| Bachelor's Degree | - | - |
| Graduate Degree | - | - |
| Total | $250,001 | $0 |
Family Income in Aucilla
Family Income Brackets in Aucilla
According to the Aucilla family income data, there are 34 families falling into the $10,000 to $14,999 income range, which is the most common income bracket and makes up 51.5% of all families.
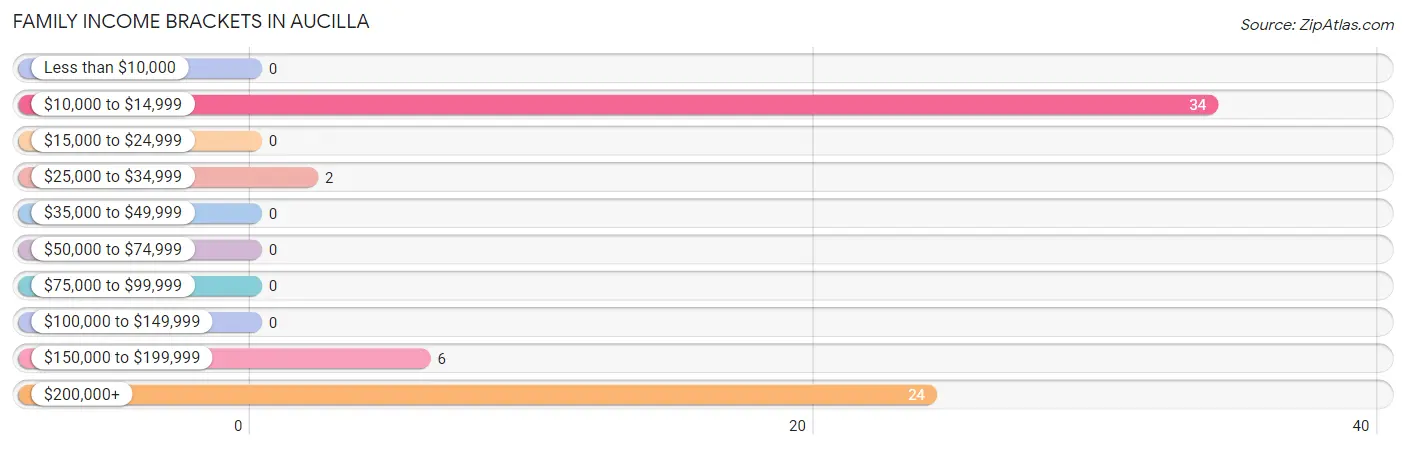
| Income Bracket | # Families | % Families |
| Less than $10,000 | 0 | 0.0% |
| $10,000 to $14,999 | 34 | 51.5% |
| $15,000 to $24,999 | 0 | 0.0% |
| $25,000 to $34,999 | 2 | 3.0% |
| $35,000 to $49,999 | 0 | 0.0% |
| $50,000 to $74,999 | 0 | 0.0% |
| $75,000 to $99,999 | 0 | 0.0% |
| $100,000 to $149,999 | 0 | 0.0% |
| $150,000 to $199,999 | 6 | 9.1% |
| $200,000+ | 24 | 36.4% |
Family Income by Famaliy Size in Aucilla
| Income Bracket | # Families | Median Income |
| 2-Person Families | 26 (39.4%) | $0 |
| 3-Person Families | 40 (60.6%) | $0 |
| 4-Person Families | 0 (0.0%) | $0 |
| 5-Person Families | 0 (0.0%) | $0 |
| 6-Person Families | 0 (0.0%) | $0 |
| 7+ Person Families | 0 (0.0%) | $0 |
| Total | 66 (100.0%) | $0 |
Family Income by Number of Earners in Aucilla
| Number of Earners | # Families | Median Income |
| No Earners | 0 (0.0%) | $0 |
| 1 Earner | 36 (54.5%) | $0 |
| 2 Earners | 30 (45.5%) | $0 |
| 3+ Earners | 0 (0.0%) | $0 |
| Total | 66 (100.0%) | $0 |
Household Income in Aucilla
Household Income Brackets in Aucilla
With 34 households falling in the category, the $10,000 to $14,999 income range is the most frequent in Aucilla, accounting for 34.0% of all households.
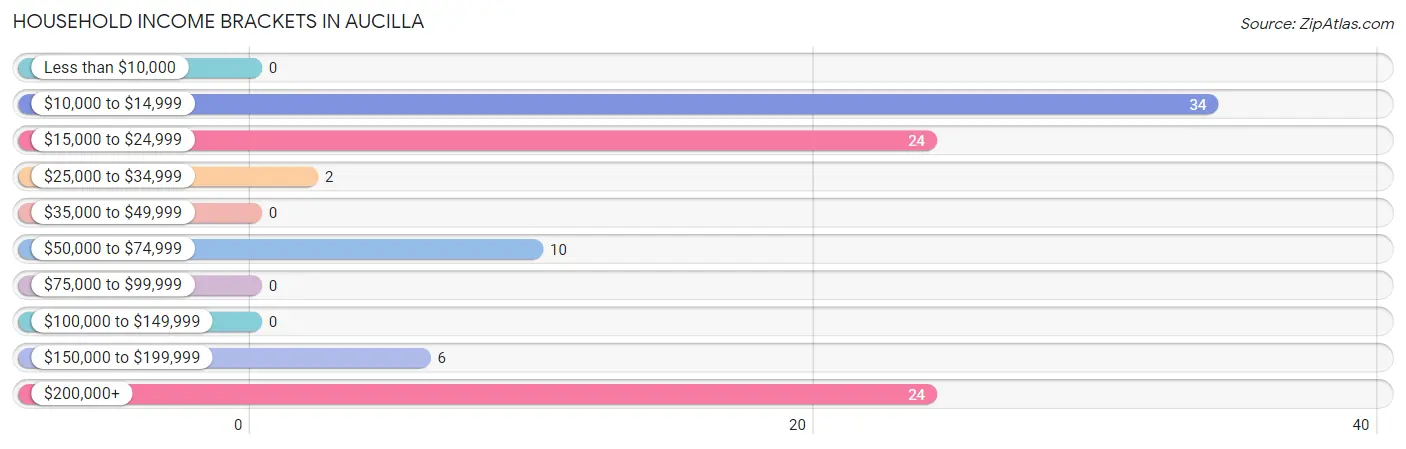
| Income Bracket | # Households | % Households |
| Less than $10,000 | 0 | 0.0% |
| $10,000 to $14,999 | 34 | 34.0% |
| $15,000 to $24,999 | 24 | 24.0% |
| $25,000 to $34,999 | 2 | 2.0% |
| $35,000 to $49,999 | 0 | 0.0% |
| $50,000 to $74,999 | 10 | 10.0% |
| $75,000 to $99,999 | 0 | 0.0% |
| $100,000 to $149,999 | 0 | 0.0% |
| $150,000 to $199,999 | 6 | 6.0% |
| $200,000+ | 24 | 24.0% |
Household Income by Householder Age in Aucilla
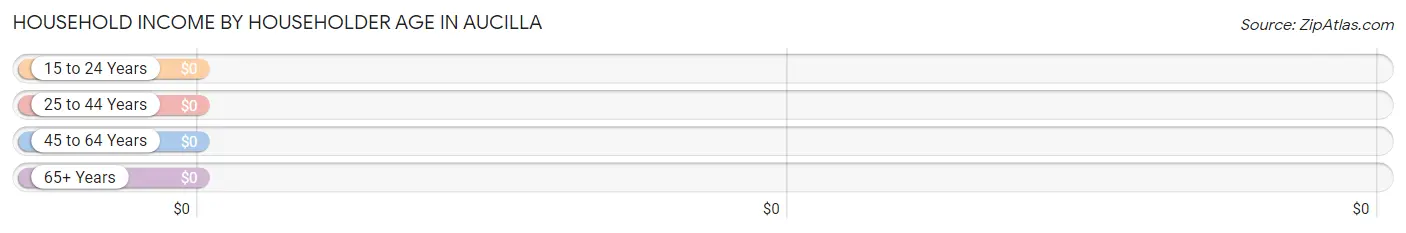
| Income Bracket | # Households | Median Income |
| 15 to 24 Years | 0 (0.0%) | $0 |
| 25 to 44 Years | 0 (0.0%) | $0 |
| 45 to 64 Years | 56 (56.0%) | $0 |
| 65+ Years | 44 (44.0%) | $0 |
| Total | 100 (100.0%) | $0 |
Poverty in Aucilla
Income Below Poverty by Sex and Age in Aucilla
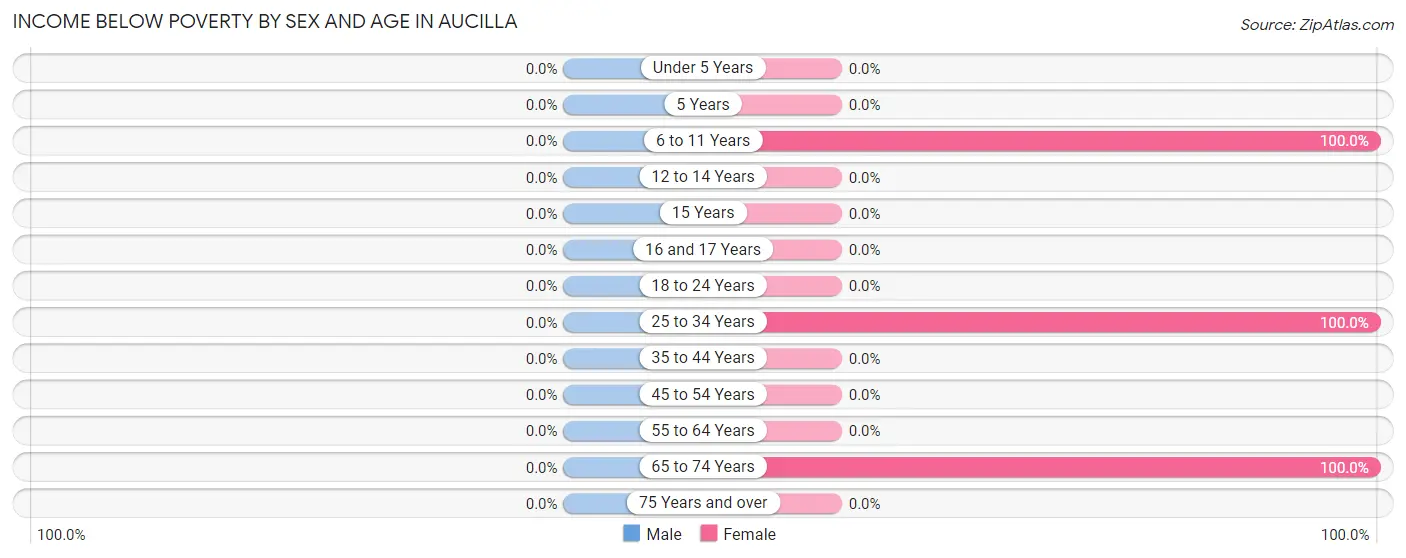
| Age Bracket | Male | Female |
| Under 5 Years | 0 (0.0%) | 0 (0.0%) |
| 5 Years | 0 (0.0%) | 0 (0.0%) |
| 6 to 11 Years | 0 (0.0%) | 24 (100.0%) |
| 12 to 14 Years | 0 (0.0%) | 0 (0.0%) |
| 15 Years | 0 (0.0%) | 0 (0.0%) |
| 16 and 17 Years | 0 (0.0%) | 0 (0.0%) |
| 18 to 24 Years | 0 (0.0%) | 0 (0.0%) |
| 25 to 34 Years | 0 (0.0%) | 20 (100.0%) |
| 35 to 44 Years | 0 (0.0%) | 0 (0.0%) |
| 45 to 54 Years | 0 (0.0%) | 0 (0.0%) |
| 55 to 64 Years | 0 (0.0%) | 0 (0.0%) |
| 65 to 74 Years | 0 (0.0%) | 34 (100.0%) |
| 75 Years and over | 0 (0.0%) | 0 (0.0%) |
| Total | 0 (0.0%) | 78 (65.0%) |
Income Above Poverty by Sex and Age in Aucilla
According to the poverty statistics in Aucilla, males aged 12 to 14 years and females aged 45 to 54 years are the age groups that are most secure financially, with 100.0% of males and 100.0% of females in these age groups living above the poverty line.
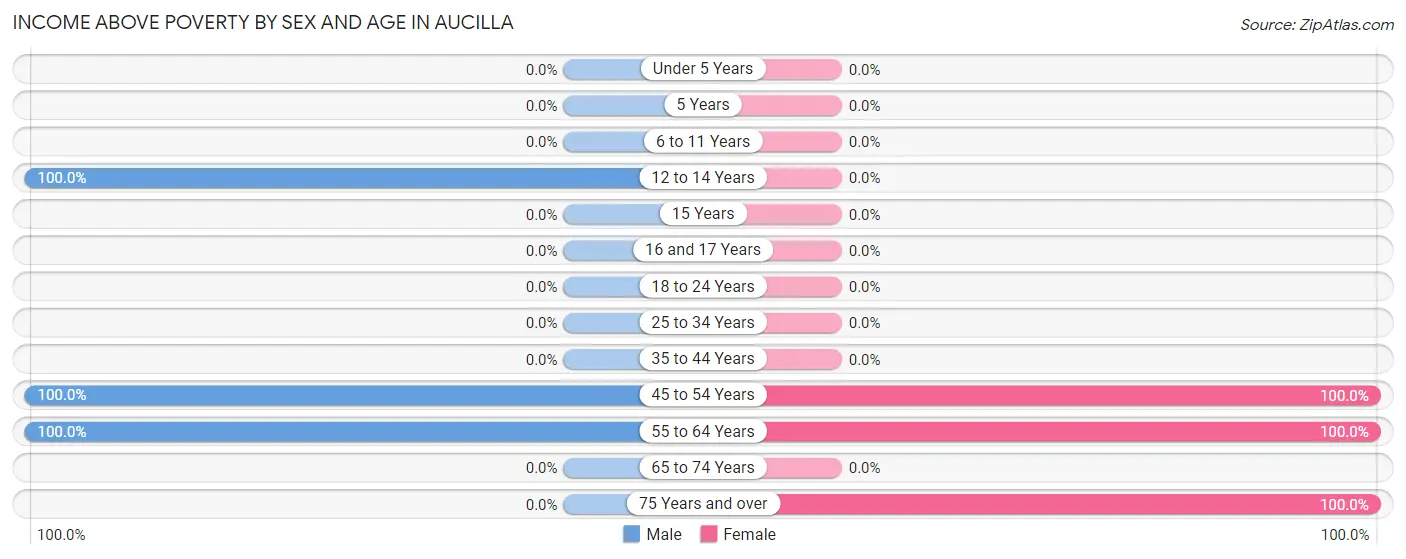
| Age Bracket | Male | Female |
| Under 5 Years | 0 (0.0%) | 0 (0.0%) |
| 5 Years | 0 (0.0%) | 0 (0.0%) |
| 6 to 11 Years | 0 (0.0%) | 0 (0.0%) |
| 12 to 14 Years | 3 (100.0%) | 0 (0.0%) |
| 15 Years | 0 (0.0%) | 0 (0.0%) |
| 16 and 17 Years | 0 (0.0%) | 0 (0.0%) |
| 18 to 24 Years | 0 (0.0%) | 0 (0.0%) |
| 25 to 34 Years | 0 (0.0%) | 0 (0.0%) |
| 35 to 44 Years | 0 (0.0%) | 0 (0.0%) |
| 45 to 54 Years | 6 (100.0%) | 3 (100.0%) |
| 55 to 64 Years | 50 (100.0%) | 29 (100.0%) |
| 65 to 74 Years | 0 (0.0%) | 0 (0.0%) |
| 75 Years and over | 0 (0.0%) | 10 (100.0%) |
| Total | 59 (100.0%) | 42 (35.0%) |
Income Below Poverty Among Married-Couple Families in Aucilla
| Children | Above Poverty | Below Poverty |
| No Children | 26 (100.0%) | 0 (0.0%) |
| 1 or 2 Children | 6 (100.0%) | 0 (0.0%) |
| 3 or 4 Children | 0 (0.0%) | 0 (0.0%) |
| 5 or more Children | 0 (0.0%) | 0 (0.0%) |
| Total | 32 (100.0%) | 0 (0.0%) |
Income Below Poverty Among Single-Parent Households in Aucilla
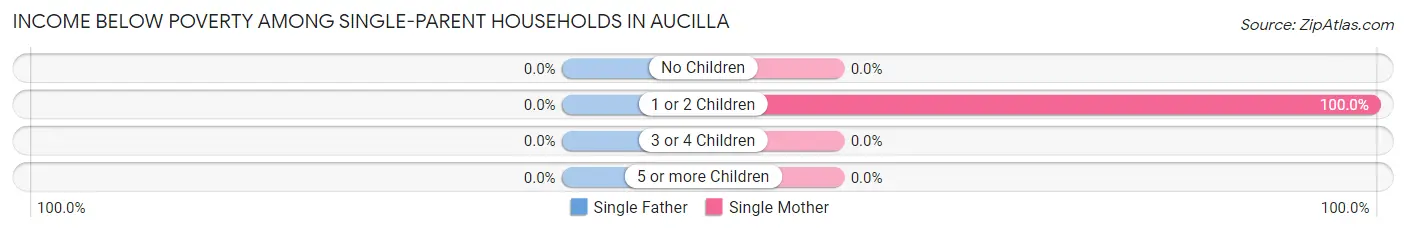
| Children | Single Father | Single Mother |
| No Children | 0 (0.0%) | 0 (0.0%) |
| 1 or 2 Children | 0 (0.0%) | 34 (100.0%) |
| 3 or 4 Children | 0 (0.0%) | 0 (0.0%) |
| 5 or more Children | 0 (0.0%) | 0 (0.0%) |
| Total | 0 (0.0%) | 34 (100.0%) |
Income Below Poverty Among Married-Couple vs Single-Parent Households in Aucilla
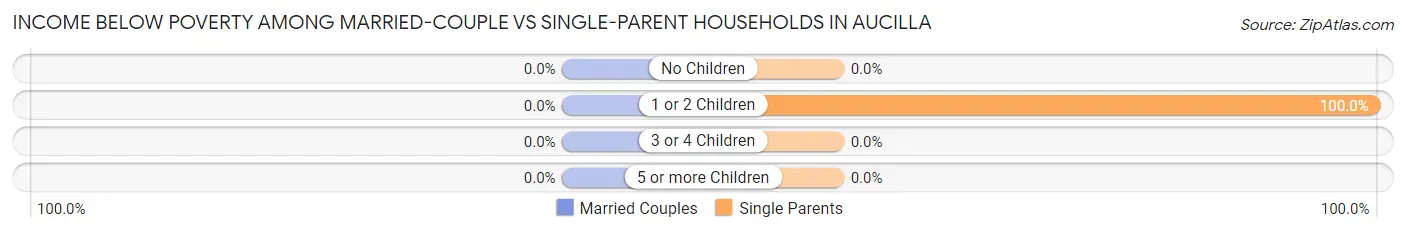
| Children | Married-Couple Families | Single-Parent Households |
| No Children | 0 (0.0%) | 0 (0.0%) |
| 1 or 2 Children | 0 (0.0%) | 34 (100.0%) |
| 3 or 4 Children | 0 (0.0%) | 0 (0.0%) |
| 5 or more Children | 0 (0.0%) | 0 (0.0%) |
| Total | 0 (0.0%) | 34 (100.0%) |
Race in Aucilla
The most populous races in Aucilla are White / Caucasian (95 | 53.1%), Black / African American (78 | 43.6%), and Two or more Races (6 | 3.4%).
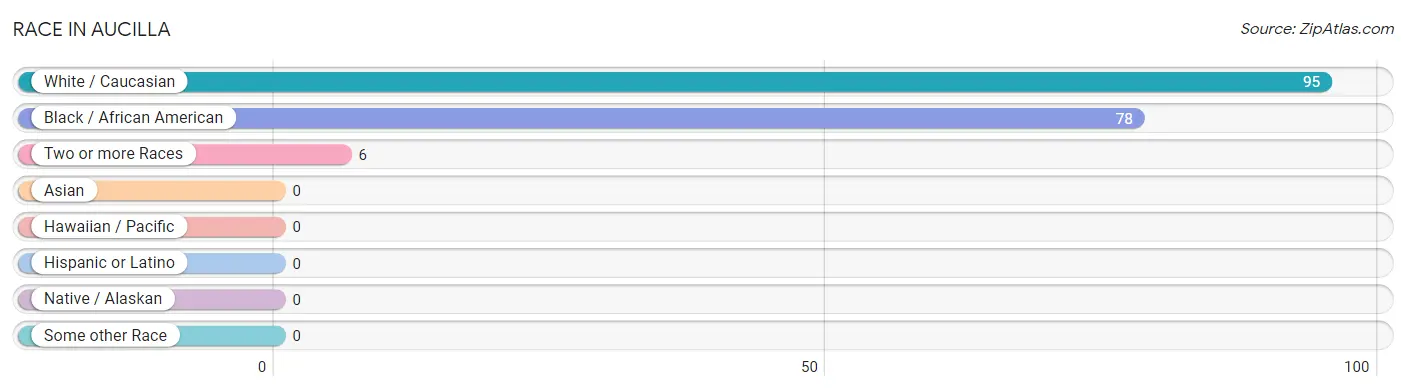
| Race | # Population | % Population |
| Asian | 0 | 0.0% |
| Black / African American | 78 | 43.6% |
| Hawaiian / Pacific | 0 | 0.0% |
| Hispanic or Latino | 0 | 0.0% |
| Native / Alaskan | 0 | 0.0% |
| White / Caucasian | 95 | 53.1% |
| Two or more Races | 6 | 3.4% |
| Some other Race | 0 | 0.0% |
| Total | 179 | 100.0% |
Ancestry in Aucilla
The most populous ancestries reported in Aucilla are English (9 | 5.0%), Irish (6 | 3.4%), and Polish (3 | 1.7%), together accounting for 10.1% of all Aucilla residents.
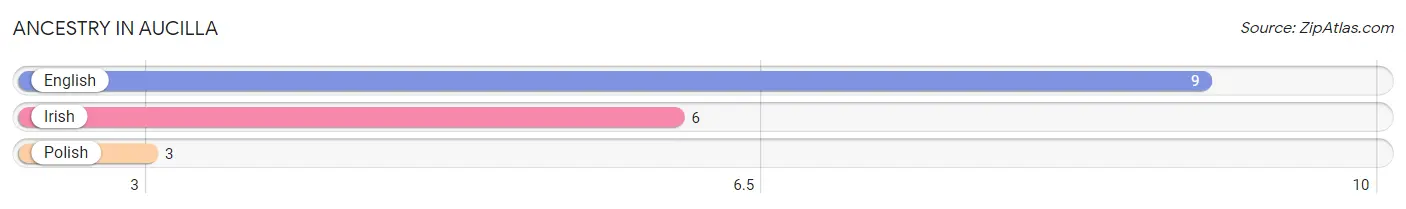
| Ancestry | # Population | % Population |
| English | 9 | 5.0% |
| Irish | 6 | 3.4% |
| Polish | 3 | 1.7% | View All 3 Rows |
Immigrants in Aucilla

| Immigration Origin | # Population | % Population | View All 0 Rows |
Sex and Age in Aucilla
Sex and Age in Aucilla
The most populous age groups in Aucilla are 60 to 64 Years (26 | 44.1%) for men and 70 to 74 Years (34 | 28.3%) for women.
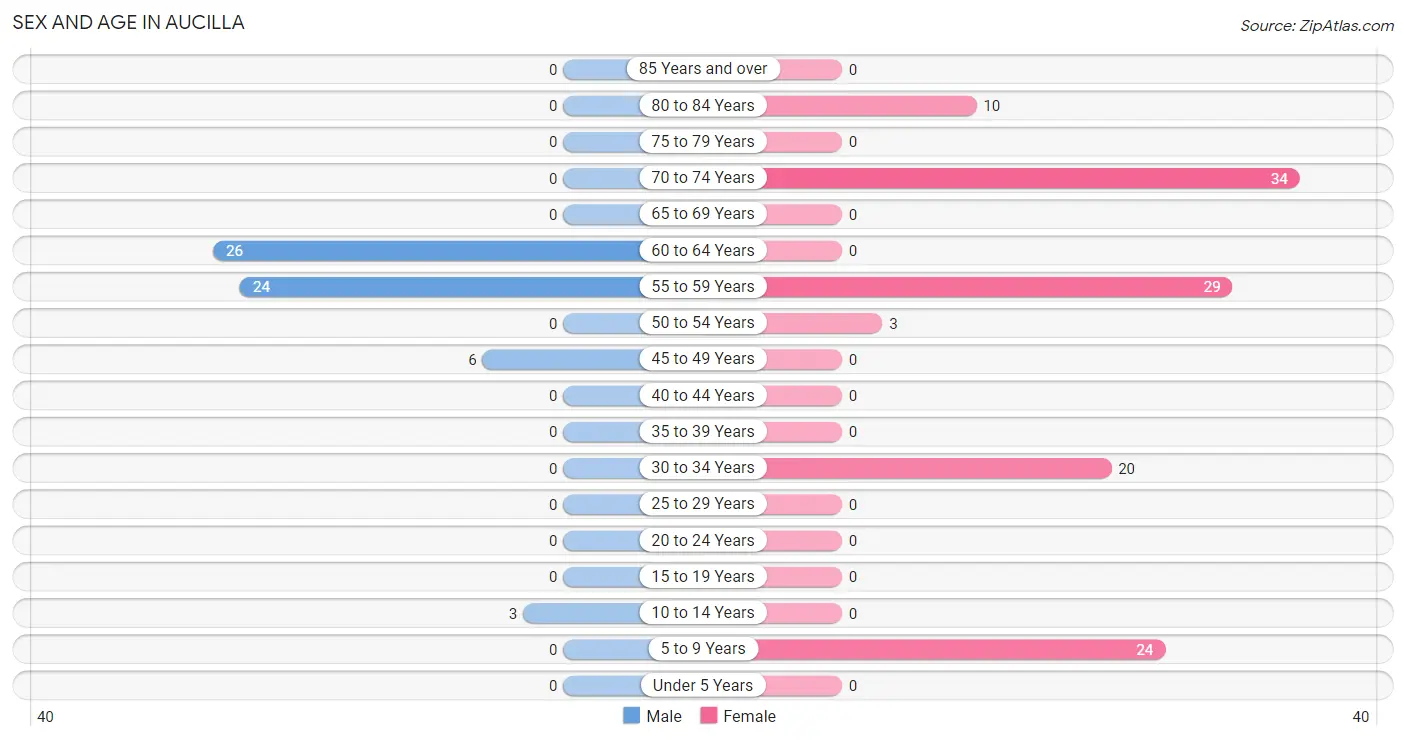
| Age Bracket | Male | Female |
| Under 5 Years | 0 (0.0%) | 0 (0.0%) |
| 5 to 9 Years | 0 (0.0%) | 24 (20.0%) |
| 10 to 14 Years | 3 (5.1%) | 0 (0.0%) |
| 15 to 19 Years | 0 (0.0%) | 0 (0.0%) |
| 20 to 24 Years | 0 (0.0%) | 0 (0.0%) |
| 25 to 29 Years | 0 (0.0%) | 0 (0.0%) |
| 30 to 34 Years | 0 (0.0%) | 20 (16.7%) |
| 35 to 39 Years | 0 (0.0%) | 0 (0.0%) |
| 40 to 44 Years | 0 (0.0%) | 0 (0.0%) |
| 45 to 49 Years | 6 (10.2%) | 0 (0.0%) |
| 50 to 54 Years | 0 (0.0%) | 3 (2.5%) |
| 55 to 59 Years | 24 (40.7%) | 29 (24.2%) |
| 60 to 64 Years | 26 (44.1%) | 0 (0.0%) |
| 65 to 69 Years | 0 (0.0%) | 0 (0.0%) |
| 70 to 74 Years | 0 (0.0%) | 34 (28.3%) |
| 75 to 79 Years | 0 (0.0%) | 0 (0.0%) |
| 80 to 84 Years | 0 (0.0%) | 10 (8.3%) |
| 85 Years and over | 0 (0.0%) | 0 (0.0%) |
| Total | 59 (100.0%) | 120 (100.0%) |
Families and Households in Aucilla
Median Family Size in Aucilla
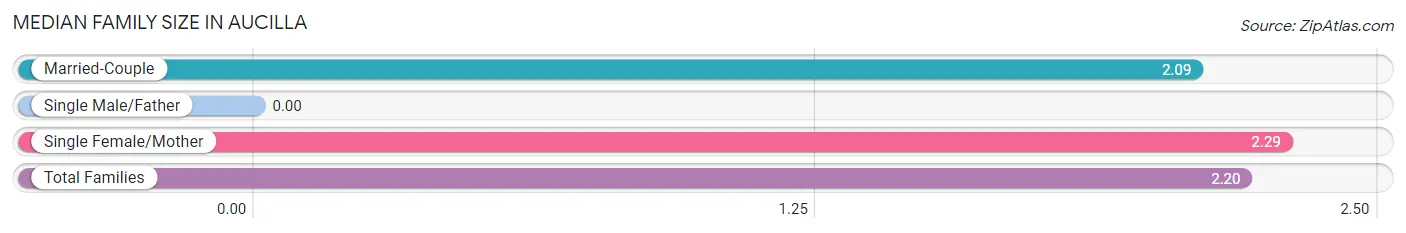
| Family Type | # Families | Family Size |
| Married-Couple | 32 (48.5%) | 2.09 |
| Single Male/Father | 0 (0.0%) | - |
| Single Female/Mother | 34 (51.5%) | 2.29 |
| Total Families | 66 (100.0%) | 2.20 |
Median Household Size in Aucilla
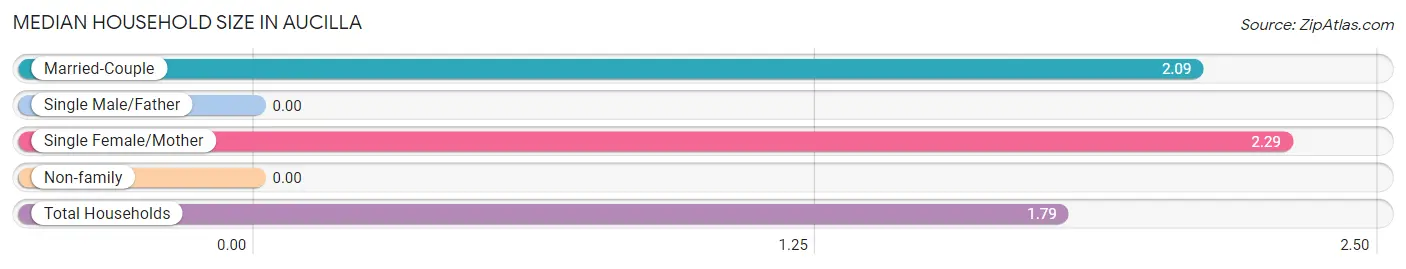
| Household Type | # Households | Household Size |
| Married-Couple | 32 (32.0%) | 2.09 |
| Single Male/Father | 0 (0.0%) | - |
| Single Female/Mother | 34 (34.0%) | 2.29 |
| Non-family | 34 (34.0%) | - |
| Total Households | 100 (100.0%) | 1.79 |
Household Size by Marriage Status in Aucilla
Out of a total of 100 households in Aucilla, 66 (66.0%) are family households, while 34 (34.0%) are nonfamily households. The most numerous type of family households are 3-person households, comprising 40, and the most common type of nonfamily households are 1-person households, comprising 34.
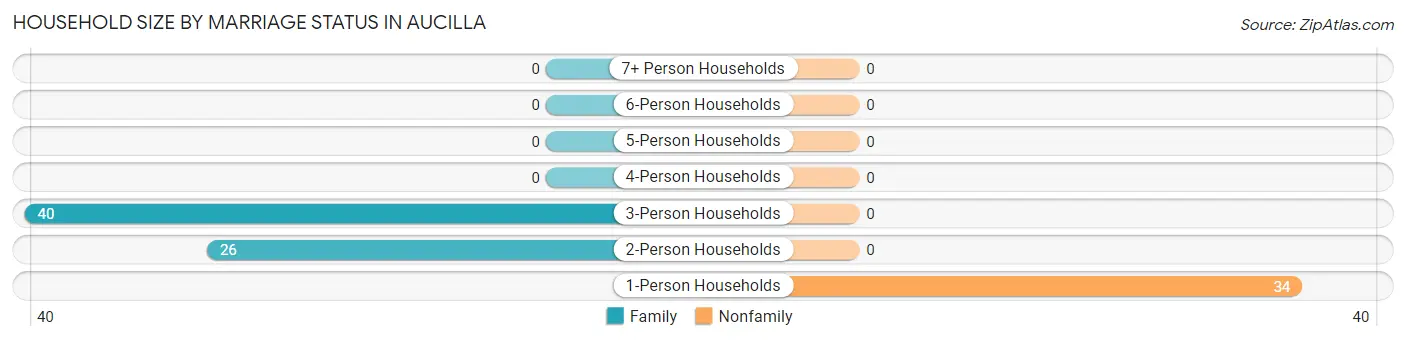
| Household Size | Family Households | Nonfamily Households |
| 1-Person Households | - | 34 (34.0%) |
| 2-Person Households | 26 (26.0%) | 0 (0.0%) |
| 3-Person Households | 40 (40.0%) | 0 (0.0%) |
| 4-Person Households | 0 (0.0%) | 0 (0.0%) |
| 5-Person Households | 0 (0.0%) | 0 (0.0%) |
| 6-Person Households | 0 (0.0%) | 0 (0.0%) |
| 7+ Person Households | 0 (0.0%) | 0 (0.0%) |
| Total | 66 (66.0%) | 34 (34.0%) |
Female Fertility in Aucilla
Fertility by Age in Aucilla
| Age Bracket | Women with Births | Births / 1,000 Women |
| 15 to 19 years | 0 (0.0%) | 0.0 |
| 20 to 34 years | 0 (0.0%) | 0.0 |
| 35 to 50 years | 0 (0.0%) | 0.0 |
| Total | 0 (0.0%) | 0.0 |
Fertility by Age by Marriage Status in Aucilla
| Age Bracket | Married | Unmarried |
| 15 to 19 years | 0 (0.0%) | 0 (0.0%) |
| 20 to 34 years | 0 (0.0%) | 0 (0.0%) |
| 35 to 50 years | 0 (0.0%) | 0 (0.0%) |
| Total | 0 (0.0%) | 0 (0.0%) |
Fertility by Education in Aucilla
| Educational Attainment | Women with Births | Births / 1,000 Women |
| Less than High School | 0 (0.0%) | 0.0 |
| High School Diploma | 0 (0.0%) | 0.0 |
| College or Associate's Degree | 0 (0.0%) | 0.0 |
| Bachelor's Degree | 0 (0.0%) | 0.0 |
| Graduate Degree | 0 (0.0%) | 0.0 |
| Total | 0 (0.0%) | 0.0 |
Fertility by Education by Marriage Status in Aucilla
| Educational Attainment | Married | Unmarried |
| Less than High School | 0 (0.0%) | 0 (0.0%) |
| High School Diploma | 0 (0.0%) | 0 (0.0%) |
| College or Associate's Degree | 0 (0.0%) | 0 (0.0%) |
| Bachelor's Degree | 0 (0.0%) | 0 (0.0%) |
| Graduate Degree | 0 (0.0%) | 0 (0.0%) |
| Total | 0 (0.0%) | 0 (0.0%) |
Employment Characteristics in Aucilla
Employment by Class of Employer in Aucilla
Among the 70 employed individuals in Aucilla, not-for-profit organizations (41 | 58.6%), local government employees (24 | 34.3%), and private company employees (5 | 7.1%) make up the most common classes of employment.
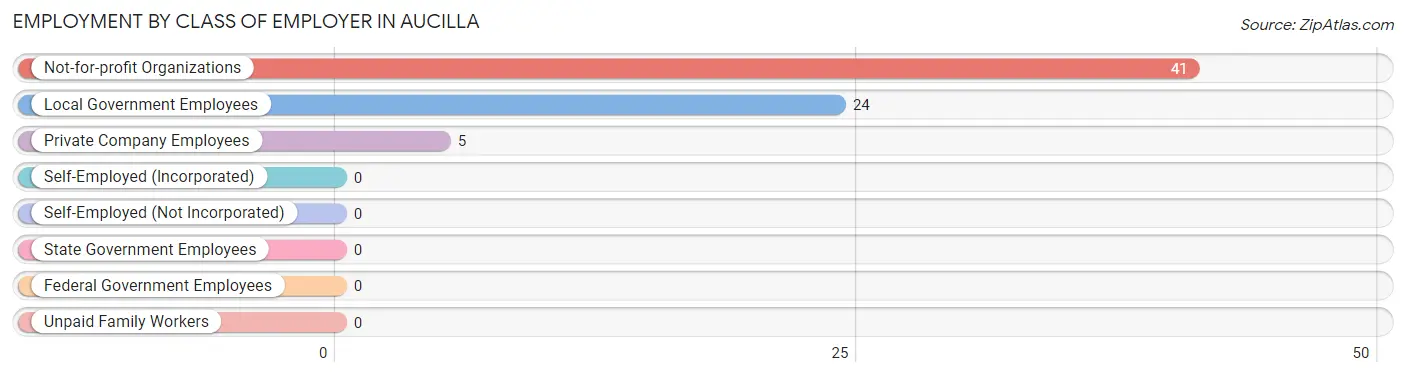
| Employer Class | # Employees | % Employees |
| Private Company Employees | 5 | 7.1% |
| Self-Employed (Incorporated) | 0 | 0.0% |
| Self-Employed (Not Incorporated) | 0 | 0.0% |
| Not-for-profit Organizations | 41 | 58.6% |
| Local Government Employees | 24 | 34.3% |
| State Government Employees | 0 | 0.0% |
| Federal Government Employees | 0 | 0.0% |
| Unpaid Family Workers | 0 | 0.0% |
| Total | 70 | 100.0% |
Employment Status by Age in Aucilla
According to the labor force statistics for Aucilla, out of the total population over 16 years of age (152), 59.2% or 90 individuals are in the labor force, with 22.2% or 20 of them unemployed. The age group with the highest labor force participation rate is 30 to 34 years, with 100.0% or 20 individuals in the labor force. Within the labor force, the 30 to 34 years age range has the highest percentage of unemployed individuals, with 100.0% or 20 of them being unemployed.
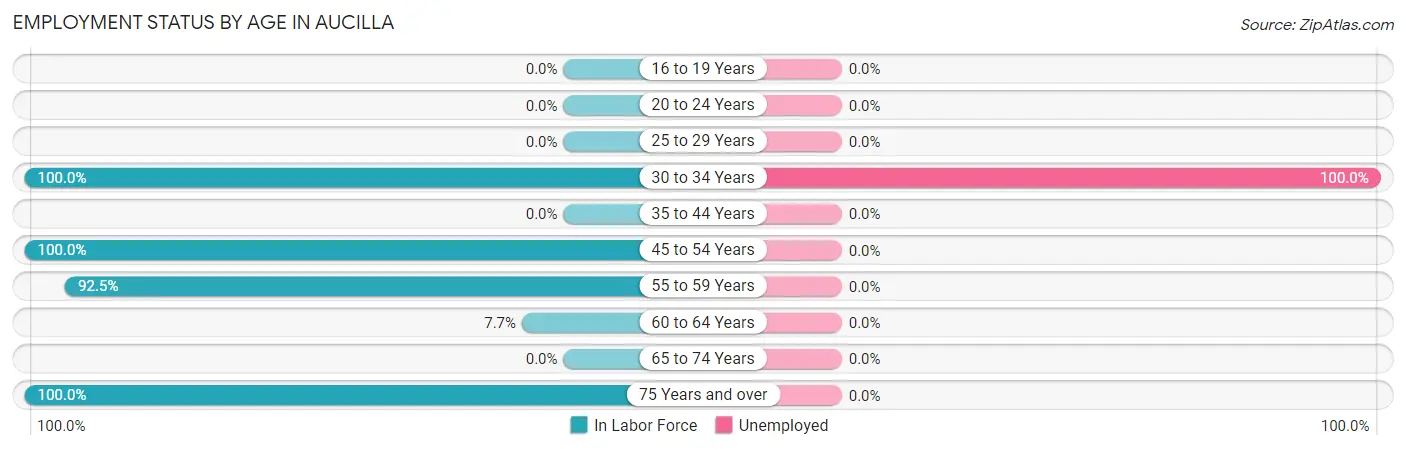
| Age Bracket | In Labor Force | Unemployed |
| 16 to 19 Years | 0 (0.0%) | 0 (0.0%) |
| 20 to 24 Years | 0 (0.0%) | 0 (0.0%) |
| 25 to 29 Years | 0 (0.0%) | 0 (0.0%) |
| 30 to 34 Years | 20 (100.0%) | 20 (100.0%) |
| 35 to 44 Years | 0 (0.0%) | 0 (0.0%) |
| 45 to 54 Years | 9 (100.0%) | 0 (0.0%) |
| 55 to 59 Years | 49 (92.5%) | 0 (0.0%) |
| 60 to 64 Years | 2 (7.7%) | 0 (0.0%) |
| 65 to 74 Years | 0 (0.0%) | 0 (0.0%) |
| 75 Years and over | 10 (100.0%) | 0 (0.0%) |
| Total | 90 (59.2%) | 20 (22.2%) |
Employment Status by Educational Attainment in Aucilla
According to labor force statistics for Aucilla, 74.1% of individuals (80) out of the total population between 25 and 64 years of age (108) are in the labor force, with 25.0% or 20 of them being unemployed. The group with the highest labor force participation rate are those with the educational attainment of college / associate degree, with 100.0% or 25 individuals in the labor force. Within the labor force, individuals with college / associate degree education have the highest percentage of unemployment, with 80.0% or 20 of them being unemployed.
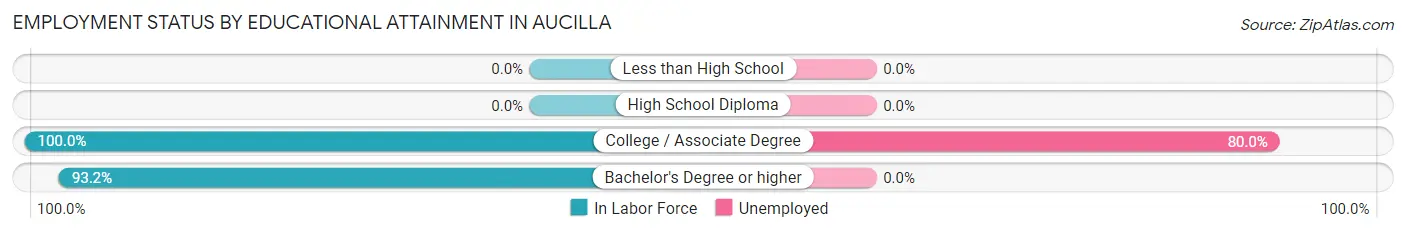
| Educational Attainment | In Labor Force | Unemployed |
| Less than High School | 0 (0.0%) | 0 (0.0%) |
| High School Diploma | 0 (0.0%) | 0 (0.0%) |
| College / Associate Degree | 25 (100.0%) | 20 (80.0%) |
| Bachelor's Degree or higher | 55 (93.2%) | 0 (0.0%) |
| Total | 80 (74.1%) | 27 (25.0%) |
Employment Occupations by Sex in Aucilla
Management, Business, Science and Arts Occupations
The most common Management, Business, Science and Arts occupations in Aucilla are Community & Social Service (31 | 44.3%), and Education Instruction & Library (31 | 44.3%).
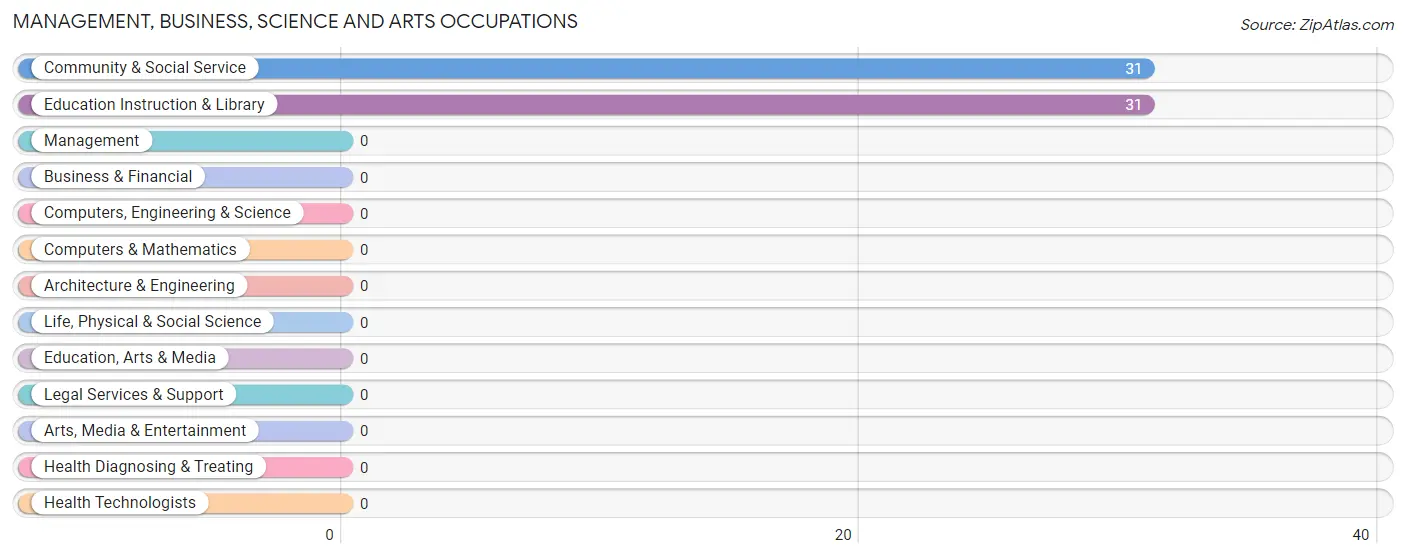
Management, Business, Science and Arts Occupations by Sex
Within the Management, Business, Science and Arts occupations in Aucilla, the most male-oriented occupations are Community & Social Service (19.4%), and Education Instruction & Library (19.4%), while the most female-oriented occupations are Community & Social Service (80.6%), and Education Instruction & Library (80.6%).
| Occupation | Male | Female |
| Management | 0 (0.0%) | 0 (0.0%) |
| Business & Financial | 0 (0.0%) | 0 (0.0%) |
| Computers, Engineering & Science | 0 (0.0%) | 0 (0.0%) |
| Computers & Mathematics | 0 (0.0%) | 0 (0.0%) |
| Architecture & Engineering | 0 (0.0%) | 0 (0.0%) |
| Life, Physical & Social Science | 0 (0.0%) | 0 (0.0%) |
| Community & Social Service | 6 (19.4%) | 25 (80.6%) |
| Education, Arts & Media | 0 (0.0%) | 0 (0.0%) |
| Legal Services & Support | 0 (0.0%) | 0 (0.0%) |
| Education Instruction & Library | 6 (19.4%) | 25 (80.6%) |
| Arts, Media & Entertainment | 0 (0.0%) | 0 (0.0%) |
| Health Diagnosing & Treating | 0 (0.0%) | 0 (0.0%) |
| Health Technologists | 0 (0.0%) | 0 (0.0%) |
| Total (Category) | 6 (19.4%) | 25 (80.6%) |
| Total (Overall) | 32 (45.7%) | 38 (54.3%) |
Services Occupations
The most common Services occupations in Aucilla are Security & Protection (2 | 2.9%), and Firefighting & Prevention (2 | 2.9%).
Services Occupations by Sex
| Occupation | Male | Female |
| Healthcare Support | 0 (0.0%) | 0 (0.0%) |
| Security & Protection | 2 (100.0%) | 0 (0.0%) |
| Firefighting & Prevention | 2 (100.0%) | 0 (0.0%) |
| Law Enforcement | 0 (0.0%) | 0 (0.0%) |
| Food Preparation & Serving | 0 (0.0%) | 0 (0.0%) |
| Cleaning & Maintenance | 0 (0.0%) | 0 (0.0%) |
| Personal Care & Service | 0 (0.0%) | 0 (0.0%) |
| Total (Category) | 2 (100.0%) | 0 (0.0%) |
| Total (Overall) | 32 (45.7%) | 38 (54.3%) |
Sales and Office Occupations
The most common Sales and Office occupations in Aucilla are , and Office & Administration (13 | 18.6%).

Sales and Office Occupations by Sex

| Occupation | Male | Female |
| Sales & Related | 0 (0.0%) | 0 (0.0%) |
| Office & Administration | 0 (0.0%) | 13 (100.0%) |
| Total (Category) | 0 (0.0%) | 13 (100.0%) |
| Total (Overall) | 32 (45.7%) | 38 (54.3%) |
Natural Resources, Construction and Maintenance Occupations

Natural Resources, Construction and Maintenance Occupations by Sex
| Occupation | Male | Female |
| Farming, Fishing & Forestry | 0 (0.0%) | 0 (0.0%) |
| Construction & Extraction | 0 (0.0%) | 0 (0.0%) |
| Installation, Maintenance & Repair | 0 (0.0%) | 0 (0.0%) |
| Total (Category) | 0 (0.0%) | 0 (0.0%) |
| Total (Overall) | 32 (45.7%) | 38 (54.3%) |
Production, Transportation and Moving Occupations
The most common Production, Transportation and Moving occupations in Aucilla are , and Transportation (24 | 34.3%).
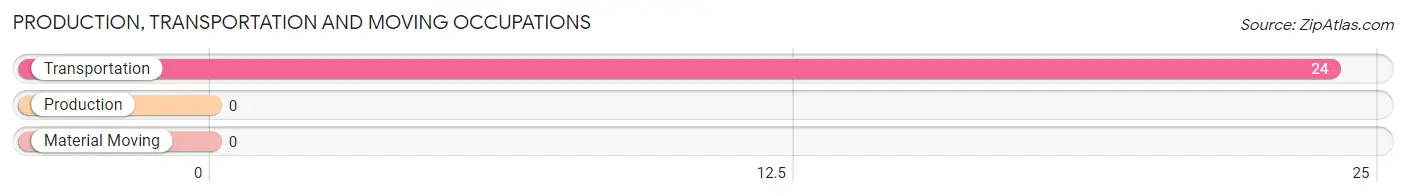
Production, Transportation and Moving Occupations by Sex
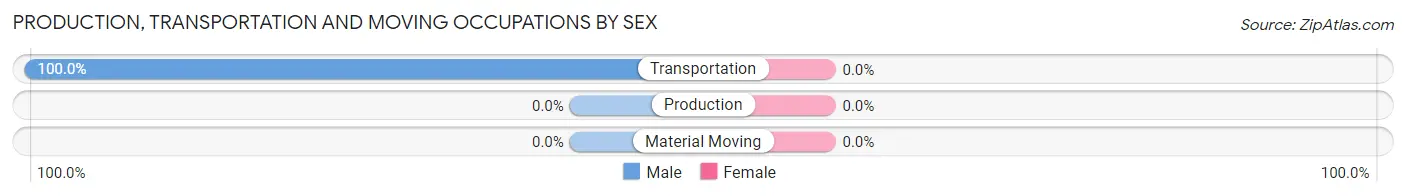
| Occupation | Male | Female |
| Production | 0 (0.0%) | 0 (0.0%) |
| Transportation | 24 (100.0%) | 0 (0.0%) |
| Material Moving | 0 (0.0%) | 0 (0.0%) |
| Total (Category) | 24 (100.0%) | 0 (0.0%) |
| Total (Overall) | 32 (45.7%) | 38 (54.3%) |
Employment Industries by Sex in Aucilla
Employment Industries in Aucilla
The major employment industries in Aucilla include Educational Services (31 | 44.3%), Transportation & Warehousing (24 | 34.3%), Finance & Insurance (3 | 4.3%), and Administrative & Support (2 | 2.9%).
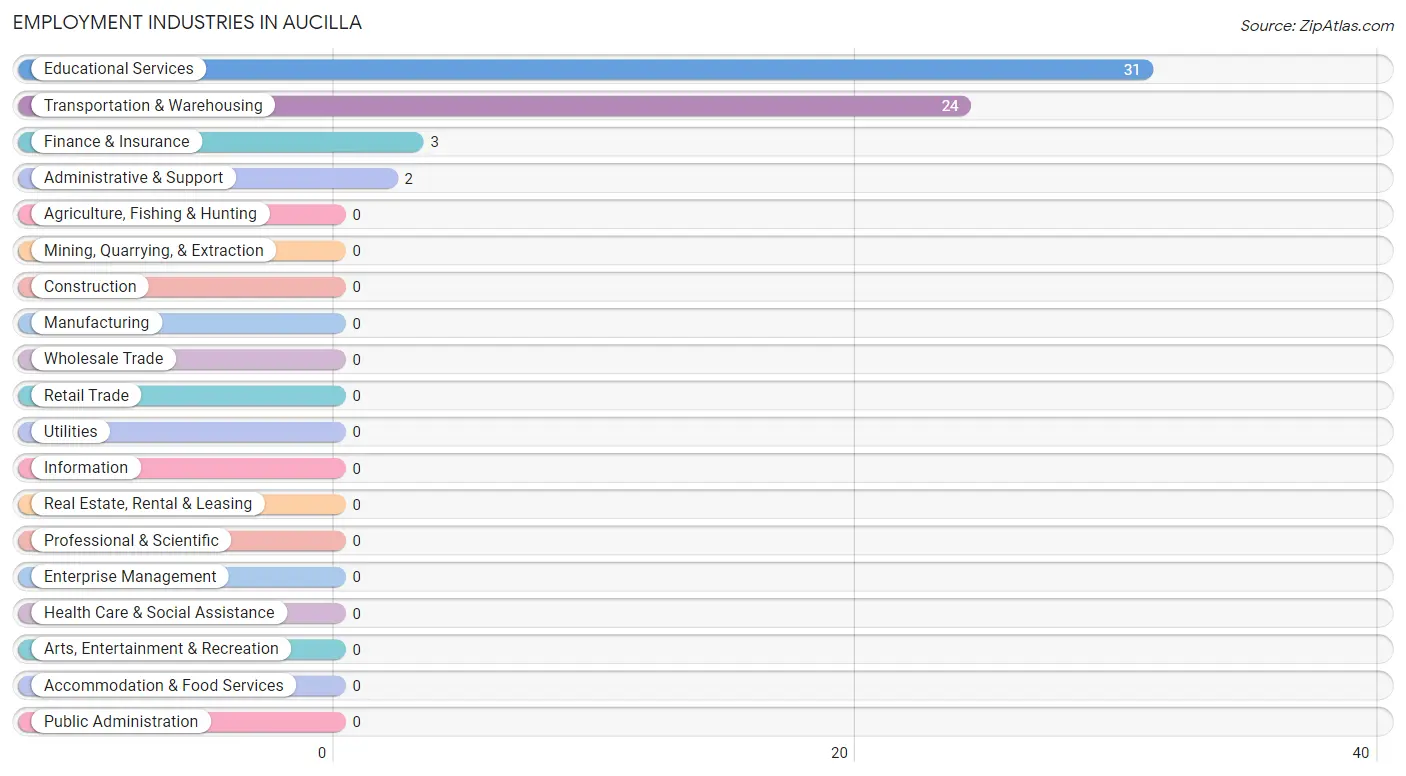
Employment Industries by Sex in Aucilla
The Aucilla industries that see more men than women are Transportation & Warehousing (100.0%), Administrative & Support (100.0%), and Educational Services (19.4%), whereas the industries that tend to have a higher number of women are Finance & Insurance (100.0%), and Educational Services (80.6%).
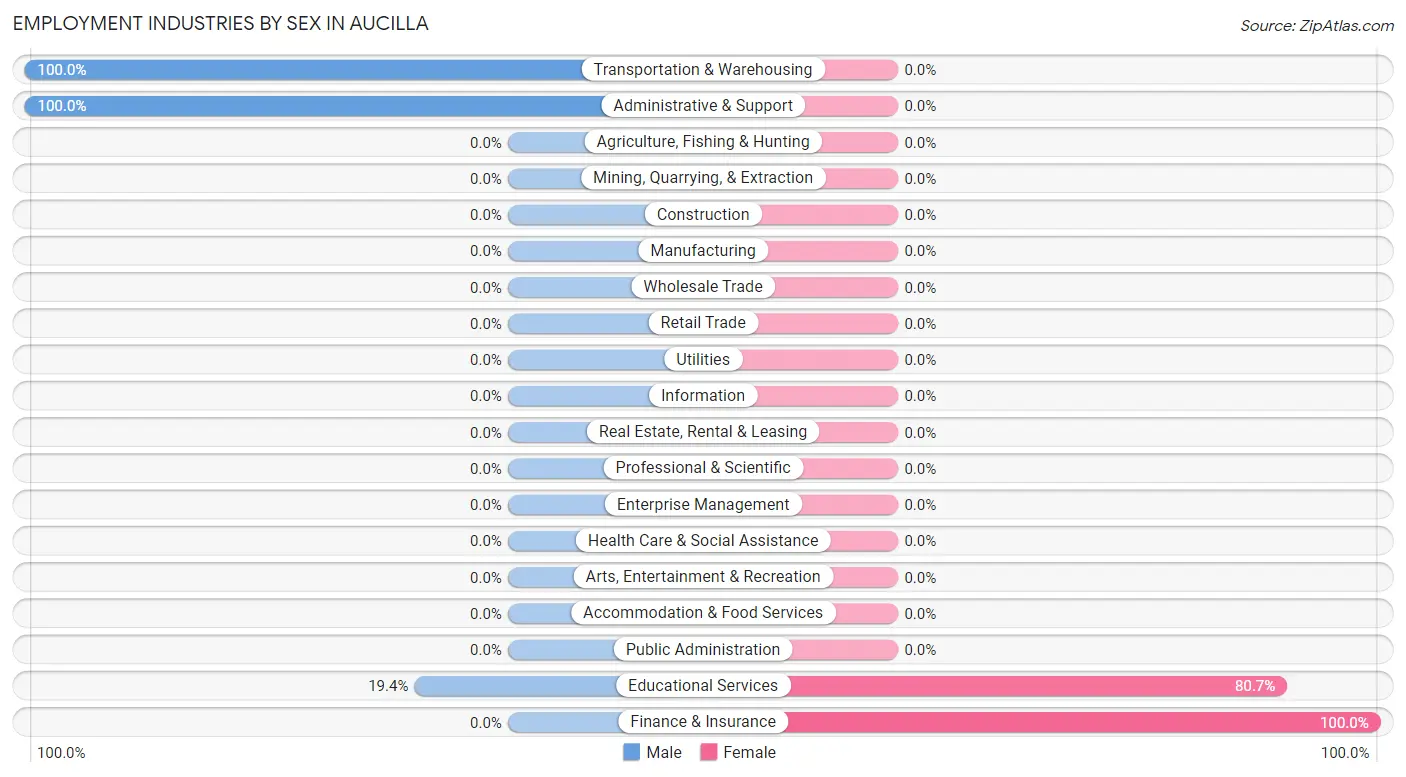
| Industry | Male | Female |
| Agriculture, Fishing & Hunting | 0 (0.0%) | 0 (0.0%) |
| Mining, Quarrying, & Extraction | 0 (0.0%) | 0 (0.0%) |
| Construction | 0 (0.0%) | 0 (0.0%) |
| Manufacturing | 0 (0.0%) | 0 (0.0%) |
| Wholesale Trade | 0 (0.0%) | 0 (0.0%) |
| Retail Trade | 0 (0.0%) | 0 (0.0%) |
| Transportation & Warehousing | 24 (100.0%) | 0 (0.0%) |
| Utilities | 0 (0.0%) | 0 (0.0%) |
| Information | 0 (0.0%) | 0 (0.0%) |
| Finance & Insurance | 0 (0.0%) | 3 (100.0%) |
| Real Estate, Rental & Leasing | 0 (0.0%) | 0 (0.0%) |
| Professional & Scientific | 0 (0.0%) | 0 (0.0%) |
| Enterprise Management | 0 (0.0%) | 0 (0.0%) |
| Administrative & Support | 2 (100.0%) | 0 (0.0%) |
| Educational Services | 6 (19.4%) | 25 (80.6%) |
| Health Care & Social Assistance | 0 (0.0%) | 0 (0.0%) |
| Arts, Entertainment & Recreation | 0 (0.0%) | 0 (0.0%) |
| Accommodation & Food Services | 0 (0.0%) | 0 (0.0%) |
| Public Administration | 0 (0.0%) | 0 (0.0%) |
| Total | 32 (45.7%) | 38 (54.3%) |
Education in Aucilla
School Enrollment in Aucilla
The most common levels of schooling among the 49 students in Aucilla are elementary school (24 | 49.0%), college / undergraduate (22 | 44.9%), and middle school (3 | 6.1%).
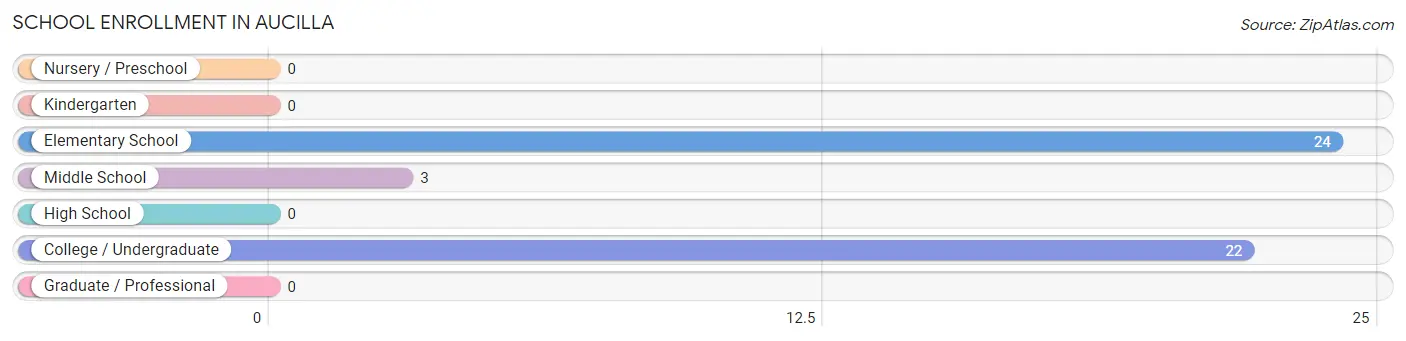
| School Level | # Students | % Students |
| Nursery / Preschool | 0 | 0.0% |
| Kindergarten | 0 | 0.0% |
| Elementary School | 24 | 49.0% |
| Middle School | 3 | 6.1% |
| High School | 0 | 0.0% |
| College / Undergraduate | 22 | 44.9% |
| Graduate / Professional | 0 | 0.0% |
| Total | 49 | 100.0% |
School Enrollment by Age by Funding Source in Aucilla
Out of a total of 49 students who are enrolled in schools in Aucilla, 3 (6.1%) attend a private institution, while the remaining 46 (93.9%) are enrolled in public schools. The age group of 10 to 14 year olds has the highest likelihood of being enrolled in private schools, with 3 (100.0% in the age bracket) enrolled. Conversely, the age group of 5 to 9 year old has the lowest likelihood of being enrolled in a private school, with 24 (100.0% in the age bracket) attending a public institution.
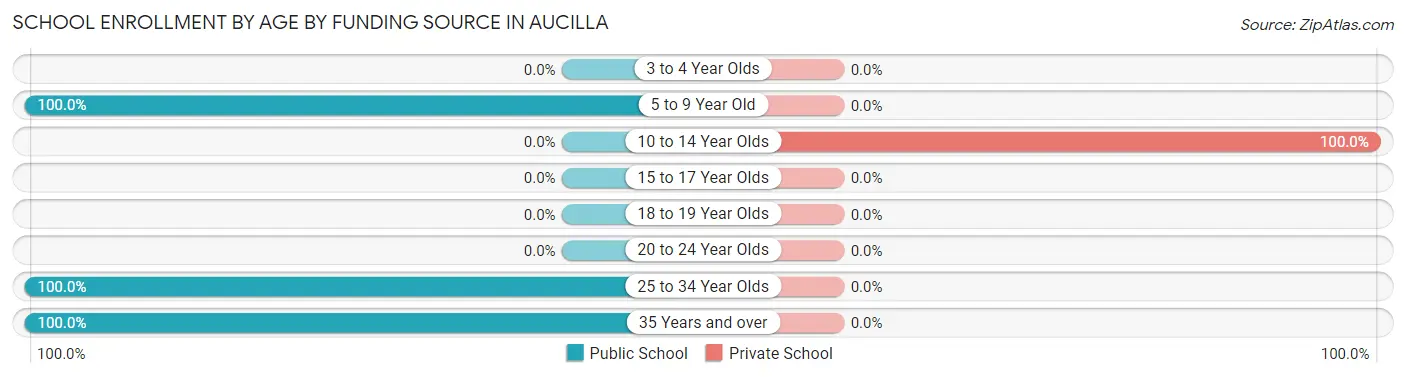
| Age Bracket | Public School | Private School |
| 3 to 4 Year Olds | 0 (0.0%) | 0 (0.0%) |
| 5 to 9 Year Old | 24 (100.0%) | 0 (0.0%) |
| 10 to 14 Year Olds | 0 (0.0%) | 3 (100.0%) |
| 15 to 17 Year Olds | 0 (0.0%) | 0 (0.0%) |
| 18 to 19 Year Olds | 0 (0.0%) | 0 (0.0%) |
| 20 to 24 Year Olds | 0 (0.0%) | 0 (0.0%) |
| 25 to 34 Year Olds | 20 (100.0%) | 0 (0.0%) |
| 35 Years and over | 2 (100.0%) | 0 (0.0%) |
| Total | 46 (93.9%) | 3 (6.1%) |
Educational Attainment by Field of Study in Aucilla
Education (25 | 42.4%), social sciences (24 | 40.7%), liberal arts & history (6 | 10.2%), and science & technology (4 | 6.8%) are the most common fields of study among 59 individuals in Aucilla who have obtained a bachelor's degree or higher.
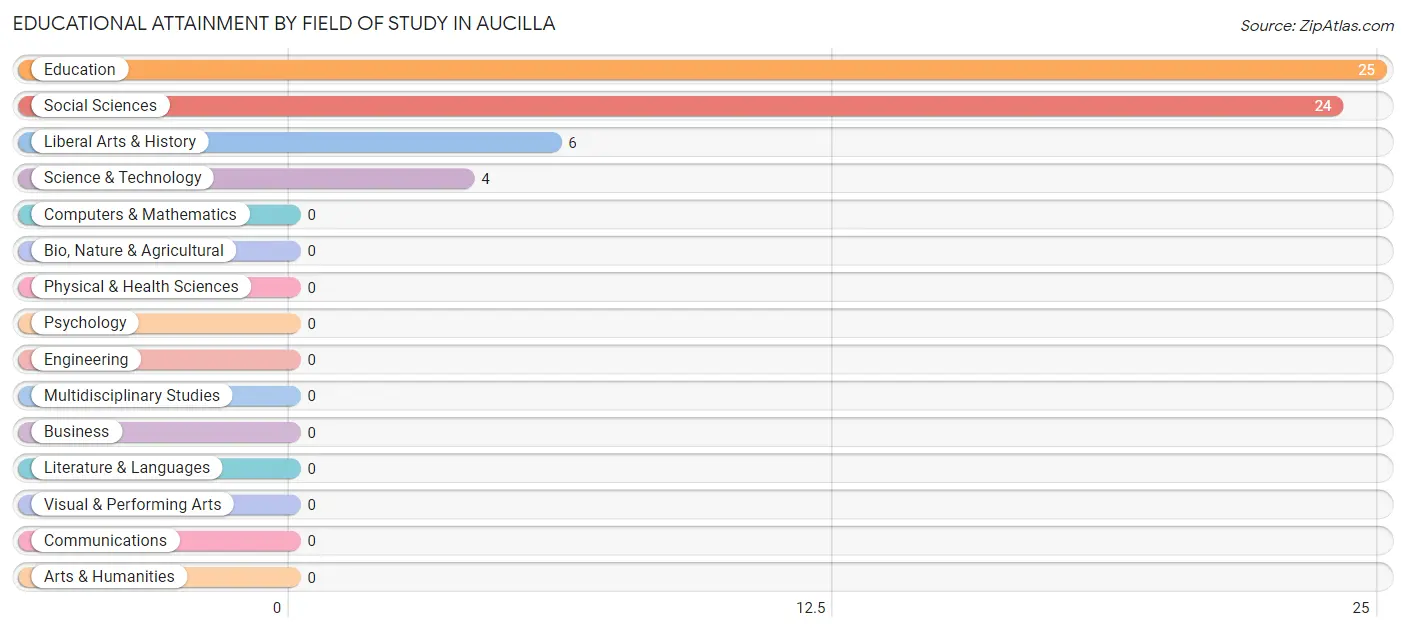
| Field of Study | # Graduates | % Graduates |
| Computers & Mathematics | 0 | 0.0% |
| Bio, Nature & Agricultural | 0 | 0.0% |
| Physical & Health Sciences | 0 | 0.0% |
| Psychology | 0 | 0.0% |
| Social Sciences | 24 | 40.7% |
| Engineering | 0 | 0.0% |
| Multidisciplinary Studies | 0 | 0.0% |
| Science & Technology | 4 | 6.8% |
| Business | 0 | 0.0% |
| Education | 25 | 42.4% |
| Literature & Languages | 0 | 0.0% |
| Liberal Arts & History | 6 | 10.2% |
| Visual & Performing Arts | 0 | 0.0% |
| Communications | 0 | 0.0% |
| Arts & Humanities | 0 | 0.0% |
| Total | 59 | 100.0% |
Transportation & Commute in Aucilla
Vehicle Availability by Sex in Aucilla
The most prevalent vehicle ownership categories in Aucilla are males with 3 vehicles (24, accounting for 75.0%) and females with 3 vehicles (25, making up 63.2%).
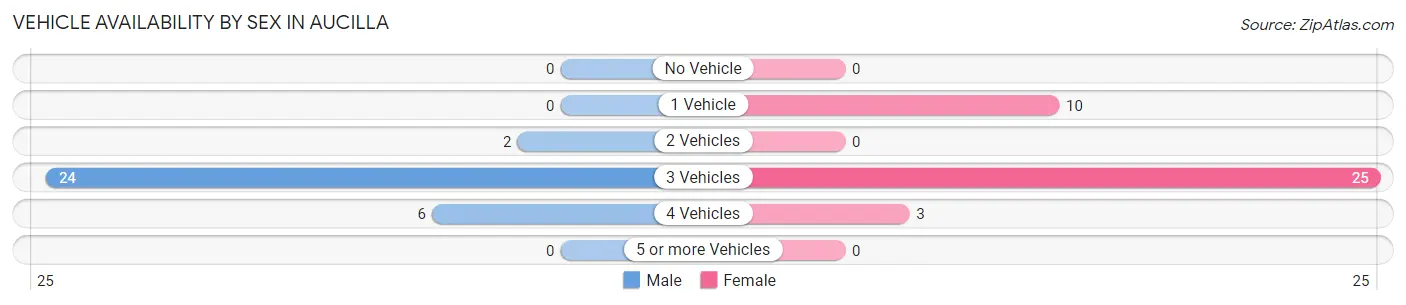
| Vehicles Available | Male | Female |
| No Vehicle | 0 (0.0%) | 0 (0.0%) |
| 1 Vehicle | 0 (0.0%) | 10 (26.3%) |
| 2 Vehicles | 2 (6.2%) | 0 (0.0%) |
| 3 Vehicles | 24 (75.0%) | 25 (65.8%) |
| 4 Vehicles | 6 (18.8%) | 3 (7.9%) |
| 5 or more Vehicles | 0 (0.0%) | 0 (0.0%) |
| Total | 32 (100.0%) | 38 (100.0%) |
Commute Time in Aucilla
The most frequently occuring commute durations in Aucilla are 5 to 9 minutes (25 commuters, 35.7%), 10 to 14 minutes (24 commuters, 34.3%), and 45 to 59 minutes (10 commuters, 14.3%).
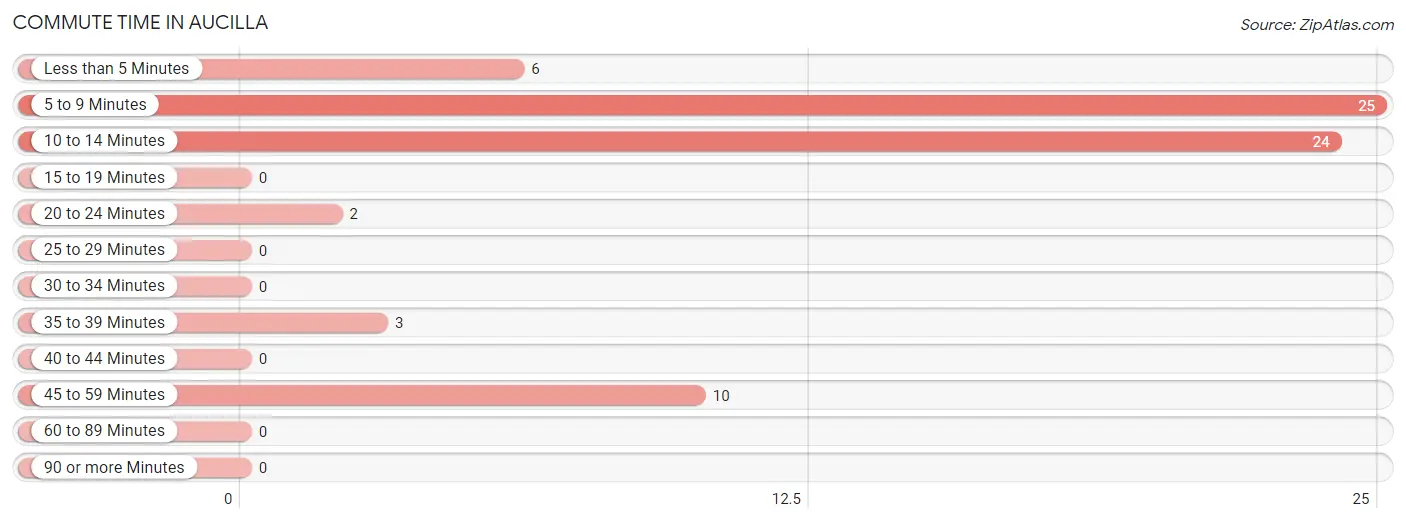
| Commute Time | # Commuters | % Commuters |
| Less than 5 Minutes | 6 | 8.6% |
| 5 to 9 Minutes | 25 | 35.7% |
| 10 to 14 Minutes | 24 | 34.3% |
| 15 to 19 Minutes | 0 | 0.0% |
| 20 to 24 Minutes | 2 | 2.9% |
| 25 to 29 Minutes | 0 | 0.0% |
| 30 to 34 Minutes | 0 | 0.0% |
| 35 to 39 Minutes | 3 | 4.3% |
| 40 to 44 Minutes | 0 | 0.0% |
| 45 to 59 Minutes | 10 | 14.3% |
| 60 to 89 Minutes | 0 | 0.0% |
| 90 or more Minutes | 0 | 0.0% |
Commute Time by Sex in Aucilla
The most common commute times in Aucilla are 10 to 14 minutes (24 commuters, 75.0%) for males and 5 to 9 minutes (25 commuters, 65.8%) for females.
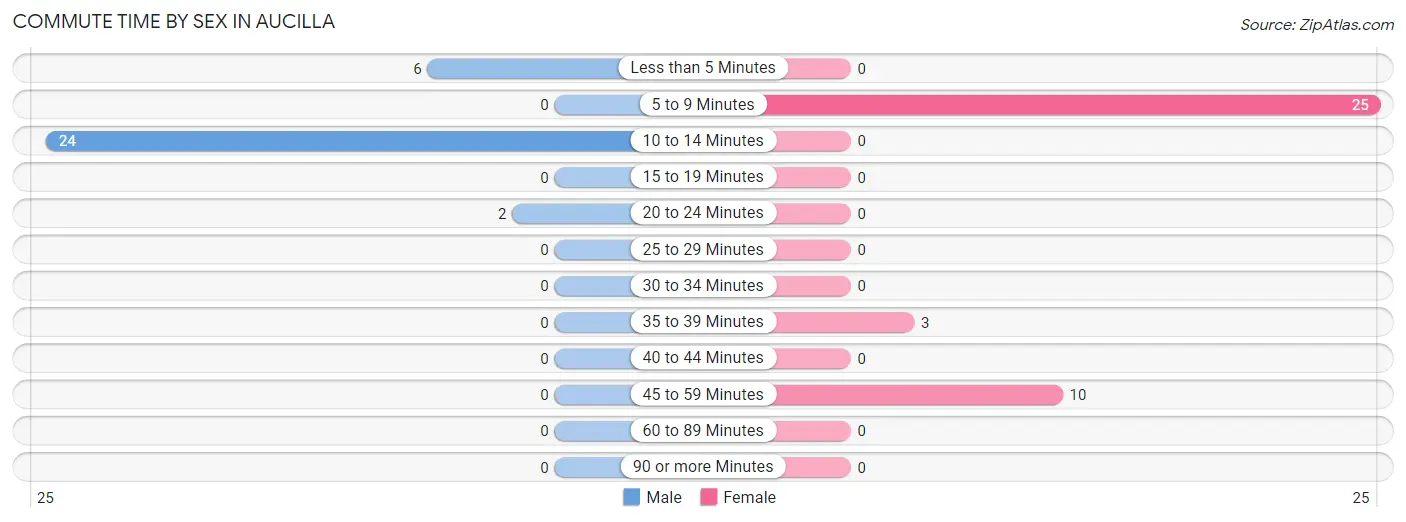
| Commute Time | Male | Female |
| Less than 5 Minutes | 6 (18.8%) | 0 (0.0%) |
| 5 to 9 Minutes | 0 (0.0%) | 25 (65.8%) |
| 10 to 14 Minutes | 24 (75.0%) | 0 (0.0%) |
| 15 to 19 Minutes | 0 (0.0%) | 0 (0.0%) |
| 20 to 24 Minutes | 2 (6.2%) | 0 (0.0%) |
| 25 to 29 Minutes | 0 (0.0%) | 0 (0.0%) |
| 30 to 34 Minutes | 0 (0.0%) | 0 (0.0%) |
| 35 to 39 Minutes | 0 (0.0%) | 3 (7.9%) |
| 40 to 44 Minutes | 0 (0.0%) | 0 (0.0%) |
| 45 to 59 Minutes | 0 (0.0%) | 10 (26.3%) |
| 60 to 89 Minutes | 0 (0.0%) | 0 (0.0%) |
| 90 or more Minutes | 0 (0.0%) | 0 (0.0%) |
Time of Departure to Work by Sex in Aucilla
The most frequent times of departure to work in Aucilla are 12:00 AM to 4:59 AM (24, 75.0%) for males and 7:30 AM to 7:59 AM (25, 65.8%) for females.
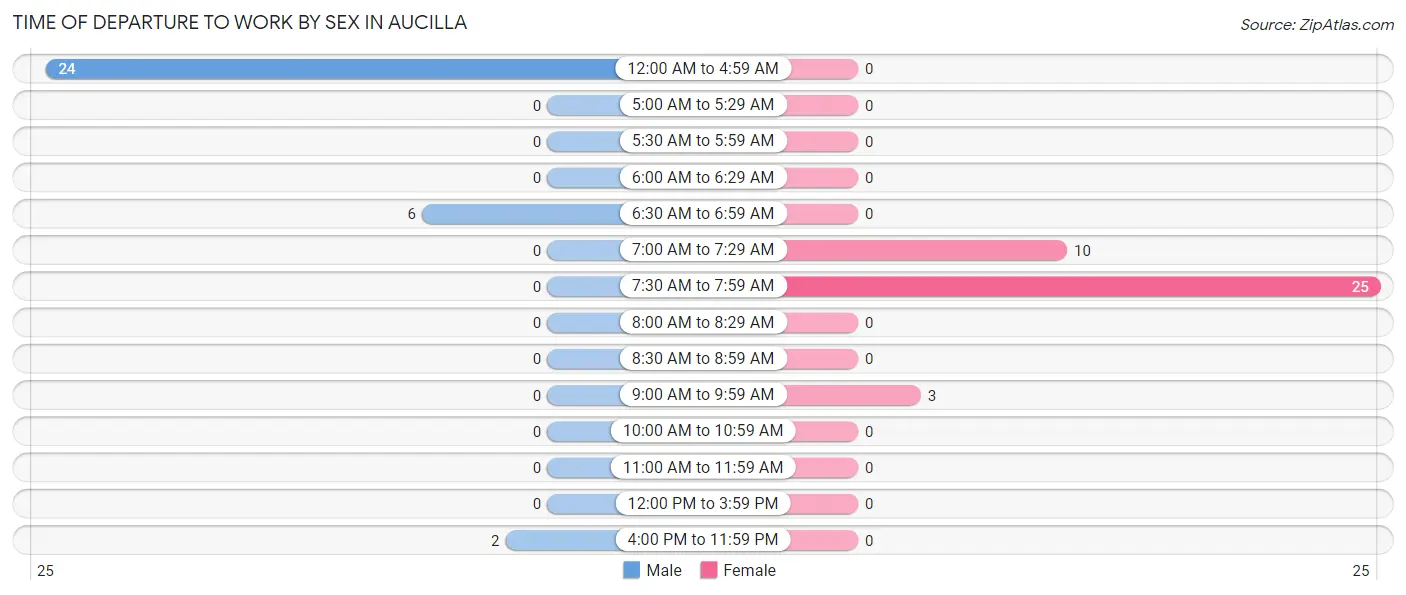
| Time of Departure | Male | Female |
| 12:00 AM to 4:59 AM | 24 (75.0%) | 0 (0.0%) |
| 5:00 AM to 5:29 AM | 0 (0.0%) | 0 (0.0%) |
| 5:30 AM to 5:59 AM | 0 (0.0%) | 0 (0.0%) |
| 6:00 AM to 6:29 AM | 0 (0.0%) | 0 (0.0%) |
| 6:30 AM to 6:59 AM | 6 (18.8%) | 0 (0.0%) |
| 7:00 AM to 7:29 AM | 0 (0.0%) | 10 (26.3%) |
| 7:30 AM to 7:59 AM | 0 (0.0%) | 25 (65.8%) |
| 8:00 AM to 8:29 AM | 0 (0.0%) | 0 (0.0%) |
| 8:30 AM to 8:59 AM | 0 (0.0%) | 0 (0.0%) |
| 9:00 AM to 9:59 AM | 0 (0.0%) | 3 (7.9%) |
| 10:00 AM to 10:59 AM | 0 (0.0%) | 0 (0.0%) |
| 11:00 AM to 11:59 AM | 0 (0.0%) | 0 (0.0%) |
| 12:00 PM to 3:59 PM | 0 (0.0%) | 0 (0.0%) |
| 4:00 PM to 11:59 PM | 2 (6.2%) | 0 (0.0%) |
| Total | 32 (100.0%) | 38 (100.0%) |
Housing Occupancy in Aucilla
Occupancy by Ownership in Aucilla
Of the total 100 dwellings in Aucilla, owner-occupied units account for 94 (94.0%), while renter-occupied units make up 6 (6.0%).
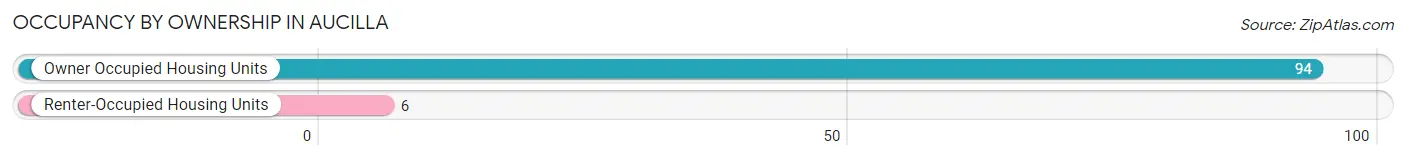
| Occupancy | # Housing Units | % Housing Units |
| Owner Occupied Housing Units | 94 | 94.0% |
| Renter-Occupied Housing Units | 6 | 6.0% |
| Total Occupied Housing Units | 100 | 100.0% |
Occupancy by Household Size in Aucilla
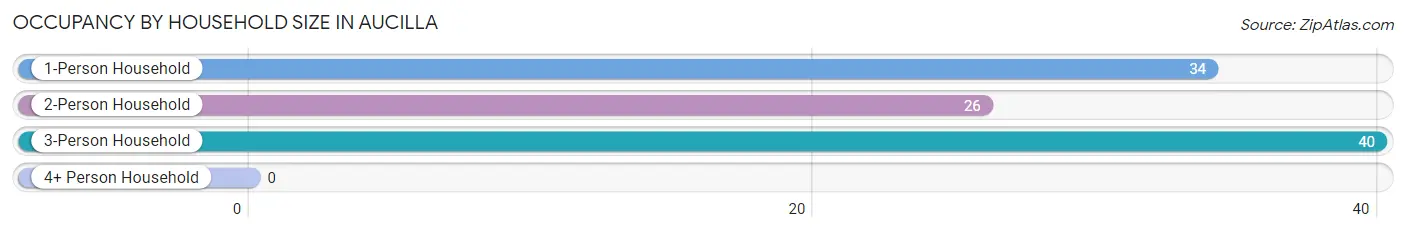
| Household Size | # Housing Units | % Housing Units |
| 1-Person Household | 34 | 34.0% |
| 2-Person Household | 26 | 26.0% |
| 3-Person Household | 40 | 40.0% |
| 4+ Person Household | 0 | 0.0% |
| Total Housing Units | 100 | 100.0% |
Occupancy by Ownership by Household Size in Aucilla
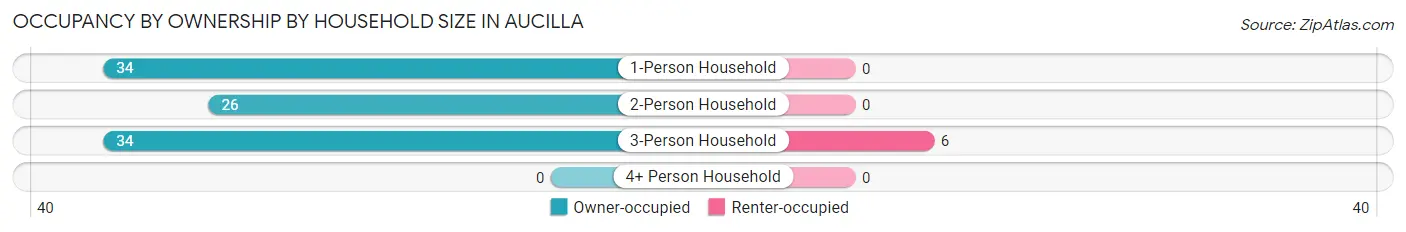
| Household Size | Owner-occupied | Renter-occupied |
| 1-Person Household | 34 (100.0%) | 0 (0.0%) |
| 2-Person Household | 26 (100.0%) | 0 (0.0%) |
| 3-Person Household | 34 (85.0%) | 6 (15.0%) |
| 4+ Person Household | 0 (0.0%) | 0 (0.0%) |
| Total Housing Units | 94 (94.0%) | 6 (6.0%) |
Occupancy by Educational Attainment in Aucilla
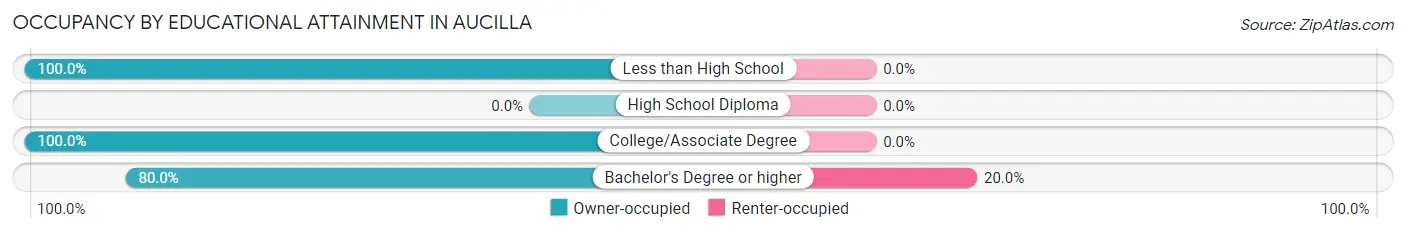
| Household Size | Owner-occupied | Renter-occupied |
| Less than High School | 58 (100.0%) | 0 (0.0%) |
| High School Diploma | 0 (0.0%) | 0 (0.0%) |
| College/Associate Degree | 12 (100.0%) | 0 (0.0%) |
| Bachelor's Degree or higher | 24 (80.0%) | 6 (20.0%) |
Occupancy by Age of Householder in Aucilla
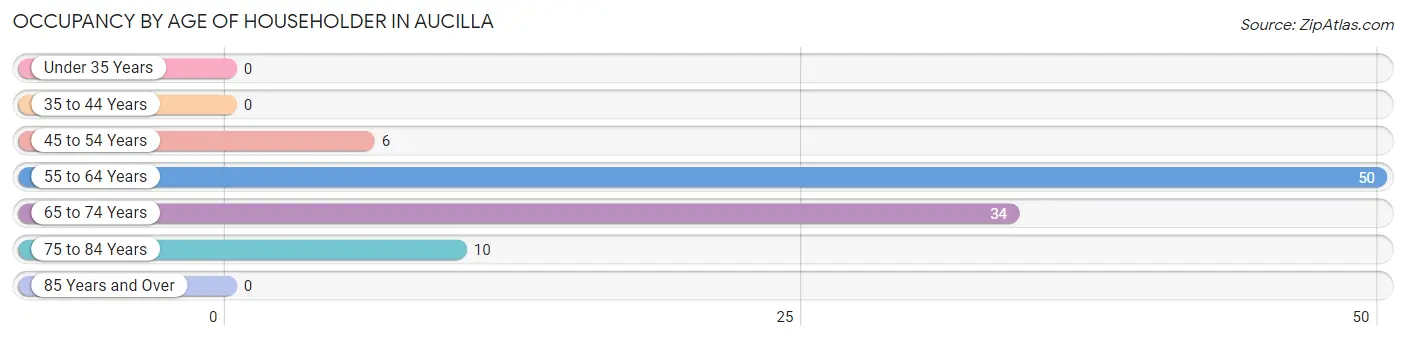
| Age Bracket | # Households | % Households |
| Under 35 Years | 0 | 0.0% |
| 35 to 44 Years | 0 | 0.0% |
| 45 to 54 Years | 6 | 6.0% |
| 55 to 64 Years | 50 | 50.0% |
| 65 to 74 Years | 34 | 34.0% |
| 75 to 84 Years | 10 | 10.0% |
| 85 Years and Over | 0 | 0.0% |
| Total | 100 | 100.0% |
Housing Finances in Aucilla
Median Income by Occupancy in Aucilla
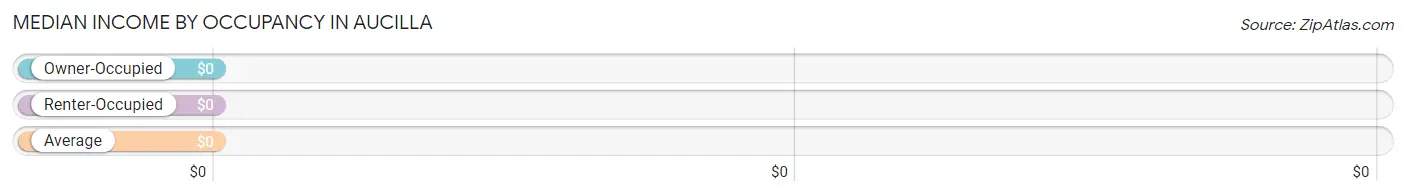
| Occupancy Type | # Households | Median Income |
| Owner-Occupied | 94 (94.0%) | $0 |
| Renter-Occupied | 6 (6.0%) | $0 |
| Average | 100 (100.0%) | $0 |
Occupancy by Householder Income Bracket in Aucilla
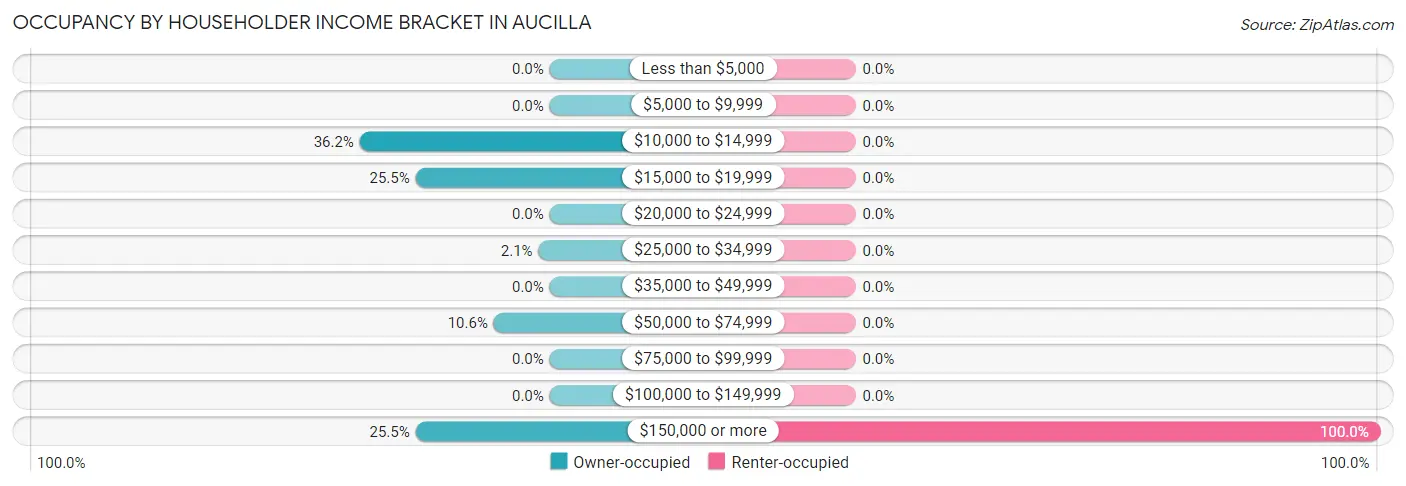
| Income Bracket | Owner-occupied | Renter-occupied |
| Less than $5,000 | 0 (0.0%) | 0 (0.0%) |
| $5,000 to $9,999 | 0 (0.0%) | 0 (0.0%) |
| $10,000 to $14,999 | 34 (36.2%) | 0 (0.0%) |
| $15,000 to $19,999 | 24 (25.5%) | 0 (0.0%) |
| $20,000 to $24,999 | 0 (0.0%) | 0 (0.0%) |
| $25,000 to $34,999 | 2 (2.1%) | 0 (0.0%) |
| $35,000 to $49,999 | 0 (0.0%) | 0 (0.0%) |
| $50,000 to $74,999 | 10 (10.6%) | 0 (0.0%) |
| $75,000 to $99,999 | 0 (0.0%) | 0 (0.0%) |
| $100,000 to $149,999 | 0 (0.0%) | 0 (0.0%) |
| $150,000 or more | 24 (25.5%) | 6 (100.0%) |
| Total | 94 (100.0%) | 6 (100.0%) |
Monthly Housing Cost Tiers in Aucilla
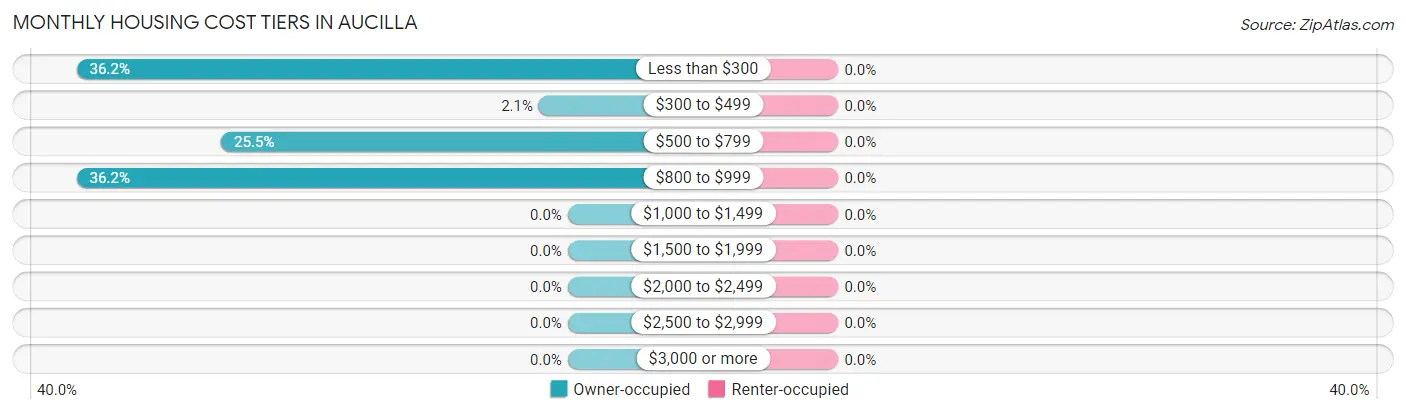
| Monthly Cost | Owner-occupied | Renter-occupied |
| Less than $300 | 34 (36.2%) | 0 (0.0%) |
| $300 to $499 | 2 (2.1%) | 0 (0.0%) |
| $500 to $799 | 24 (25.5%) | 0 (0.0%) |
| $800 to $999 | 34 (36.2%) | 0 (0.0%) |
| $1,000 to $1,499 | 0 (0.0%) | 0 (0.0%) |
| $1,500 to $1,999 | 0 (0.0%) | 0 (0.0%) |
| $2,000 to $2,499 | 0 (0.0%) | 0 (0.0%) |
| $2,500 to $2,999 | 0 (0.0%) | 0 (0.0%) |
| $3,000 or more | 0 (0.0%) | 0 (0.0%) |
| Total | 94 (100.0%) | 6 (100.0%) |
Physical Housing Characteristics in Aucilla
Housing Structures in Aucilla
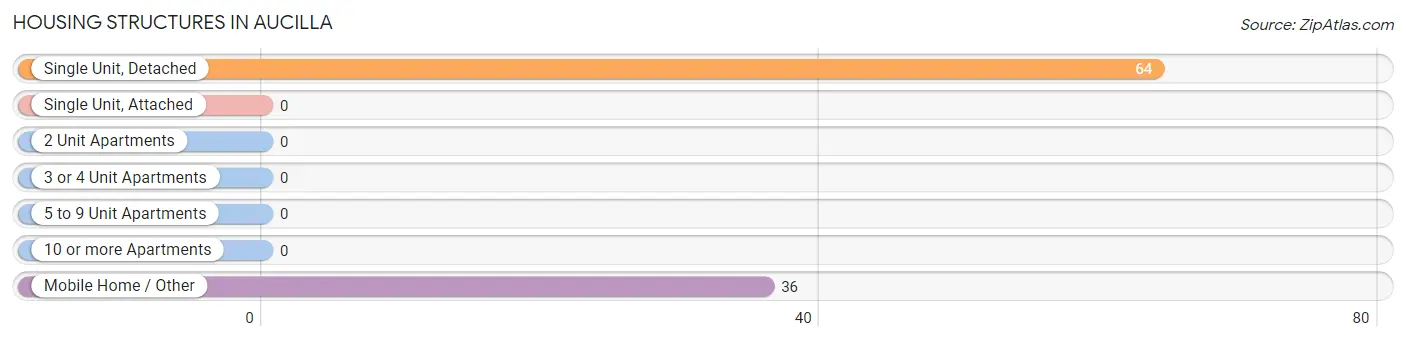
| Structure Type | # Housing Units | % Housing Units |
| Single Unit, Detached | 64 | 64.0% |
| Single Unit, Attached | 0 | 0.0% |
| 2 Unit Apartments | 0 | 0.0% |
| 3 or 4 Unit Apartments | 0 | 0.0% |
| 5 to 9 Unit Apartments | 0 | 0.0% |
| 10 or more Apartments | 0 | 0.0% |
| Mobile Home / Other | 36 | 36.0% |
| Total | 100 | 100.0% |
Housing Structures by Occupancy in Aucilla
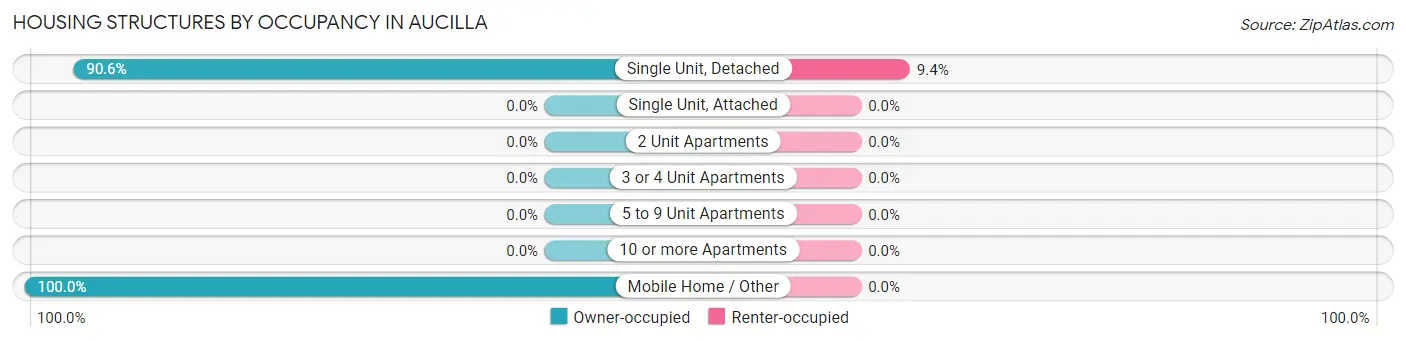
| Structure Type | Owner-occupied | Renter-occupied |
| Single Unit, Detached | 58 (90.6%) | 6 (9.4%) |
| Single Unit, Attached | 0 (0.0%) | 0 (0.0%) |
| 2 Unit Apartments | 0 (0.0%) | 0 (0.0%) |
| 3 or 4 Unit Apartments | 0 (0.0%) | 0 (0.0%) |
| 5 to 9 Unit Apartments | 0 (0.0%) | 0 (0.0%) |
| 10 or more Apartments | 0 (0.0%) | 0 (0.0%) |
| Mobile Home / Other | 36 (100.0%) | 0 (0.0%) |
| Total | 94 (94.0%) | 6 (6.0%) |
Housing Structures by Number of Rooms in Aucilla
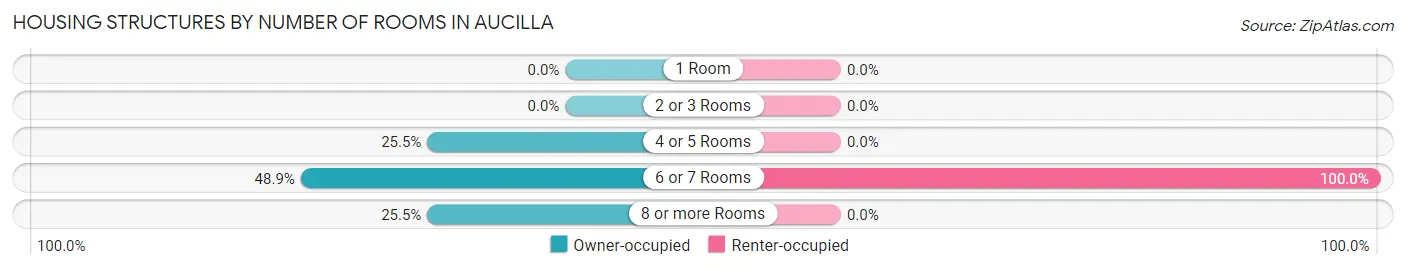
| Number of Rooms | Owner-occupied | Renter-occupied |
| 1 Room | 0 (0.0%) | 0 (0.0%) |
| 2 or 3 Rooms | 0 (0.0%) | 0 (0.0%) |
| 4 or 5 Rooms | 24 (25.5%) | 0 (0.0%) |
| 6 or 7 Rooms | 46 (48.9%) | 6 (100.0%) |
| 8 or more Rooms | 24 (25.5%) | 0 (0.0%) |
| Total | 94 (100.0%) | 6 (100.0%) |
Housing Structure by Heating Type in Aucilla
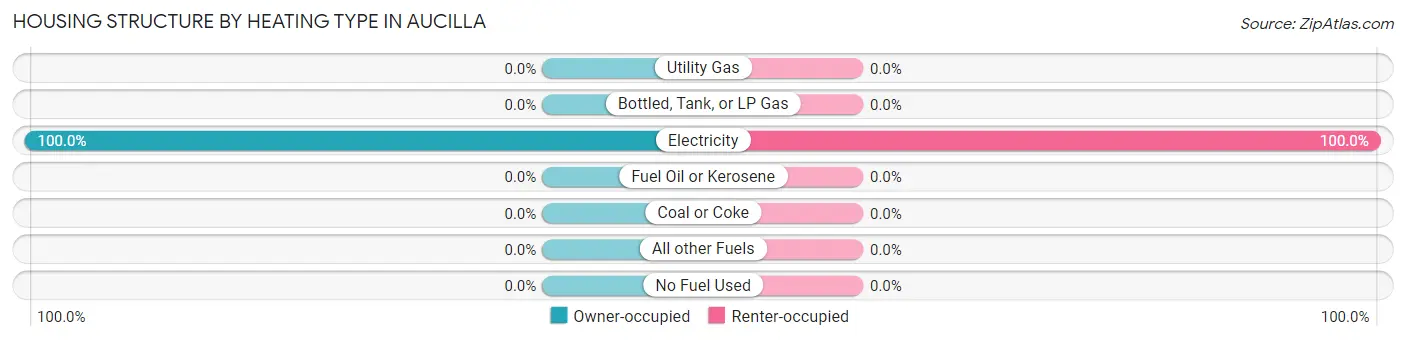
| Heating Type | Owner-occupied | Renter-occupied |
| Utility Gas | 0 (0.0%) | 0 (0.0%) |
| Bottled, Tank, or LP Gas | 0 (0.0%) | 0 (0.0%) |
| Electricity | 94 (100.0%) | 6 (100.0%) |
| Fuel Oil or Kerosene | 0 (0.0%) | 0 (0.0%) |
| Coal or Coke | 0 (0.0%) | 0 (0.0%) |
| All other Fuels | 0 (0.0%) | 0 (0.0%) |
| No Fuel Used | 0 (0.0%) | 0 (0.0%) |
| Total | 94 (100.0%) | 6 (100.0%) |
Household Vehicle Usage in Aucilla
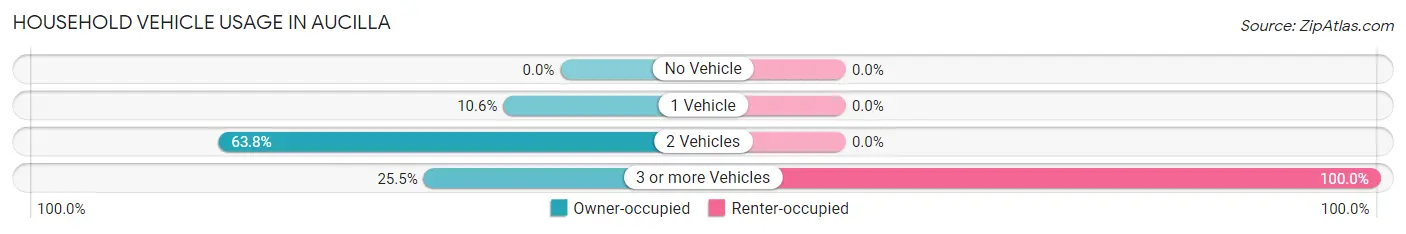
| Vehicles per Household | Owner-occupied | Renter-occupied |
| No Vehicle | 0 (0.0%) | 0 (0.0%) |
| 1 Vehicle | 10 (10.6%) | 0 (0.0%) |
| 2 Vehicles | 60 (63.8%) | 0 (0.0%) |
| 3 or more Vehicles | 24 (25.5%) | 6 (100.0%) |
| Total | 94 (100.0%) | 6 (100.0%) |
Real Estate & Mortgages in Aucilla
Real Estate and Mortgage Overview in Aucilla
| Characteristic | Without Mortgage | With Mortgage |
| Housing Units | 94 | 0 |
| Median Property Value | $158,100 | $0 |
| Median Household Income | - | - |
| Monthly Housing Costs | $746 | $0 |
| Real Estate Taxes | $732 | $0 |
Property Value by Mortgage Status in Aucilla
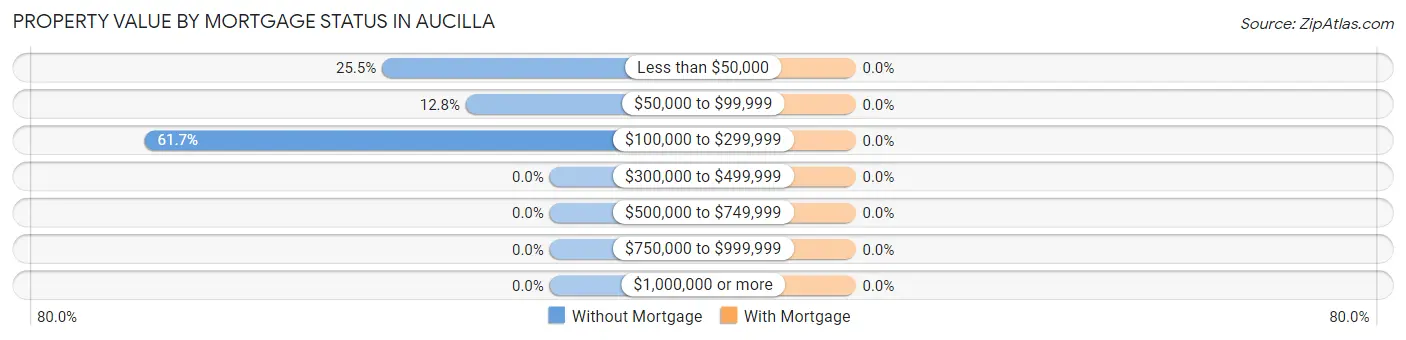
| Property Value | Without Mortgage | With Mortgage |
| Less than $50,000 | 24 (25.5%) | 0 (0.0%) |
| $50,000 to $99,999 | 12 (12.8%) | 0 (0.0%) |
| $100,000 to $299,999 | 58 (61.7%) | 0 (0.0%) |
| $300,000 to $499,999 | 0 (0.0%) | 0 (0.0%) |
| $500,000 to $749,999 | 0 (0.0%) | 0 (0.0%) |
| $750,000 to $999,999 | 0 (0.0%) | 0 (0.0%) |
| $1,000,000 or more | 0 (0.0%) | 0 (0.0%) |
| Total | 94 (100.0%) | 0 (0.0%) |
Household Income by Mortgage Status in Aucilla
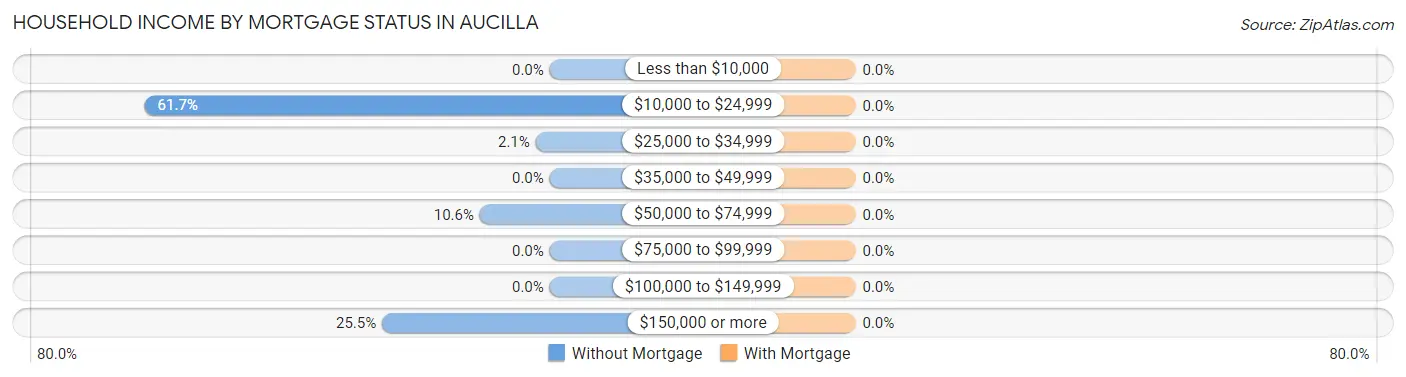
| Household Income | Without Mortgage | With Mortgage |
| Less than $10,000 | 0 (0.0%) | 0 (0.0%) |
| $10,000 to $24,999 | 58 (61.7%) | 0 (0.0%) |
| $25,000 to $34,999 | 2 (2.1%) | 0 (0.0%) |
| $35,000 to $49,999 | 0 (0.0%) | 0 (0.0%) |
| $50,000 to $74,999 | 10 (10.6%) | 0 (0.0%) |
| $75,000 to $99,999 | 0 (0.0%) | 0 (0.0%) |
| $100,000 to $149,999 | 0 (0.0%) | 0 (0.0%) |
| $150,000 or more | 24 (25.5%) | 0 (0.0%) |
| Total | 94 (100.0%) | 0 (0.0%) |
Property Value to Household Income Ratio in Aucilla
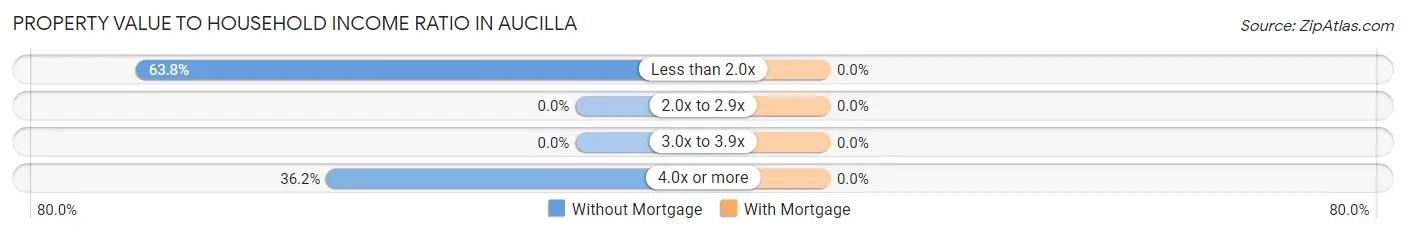
| Value-to-Income Ratio | Without Mortgage | With Mortgage |
| Less than 2.0x | 60 (63.8%) | 0 (0.0%) |
| 2.0x to 2.9x | 0 (0.0%) | 0 (0.0%) |
| 3.0x to 3.9x | 0 (0.0%) | 0 (0.0%) |
| 4.0x or more | 34 (36.2%) | 0 (0.0%) |
| Total | 94 (100.0%) | 0 (0.0%) |
Real Estate Taxes by Mortgage Status in Aucilla
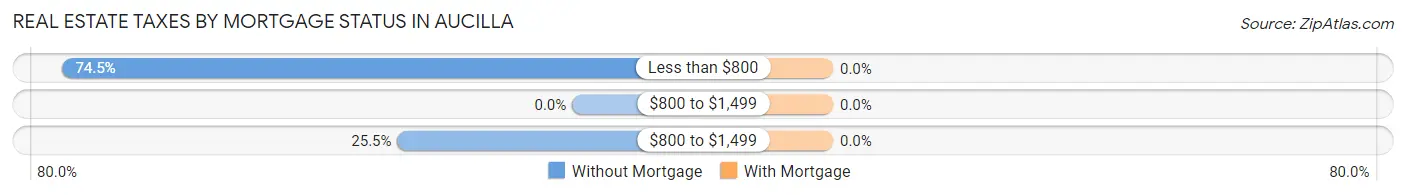
| Property Taxes | Without Mortgage | With Mortgage |
| Less than $800 | 70 (74.5%) | 0 (0.0%) |
| $800 to $1,499 | 0 (0.0%) | 0 (0.0%) |
| $800 to $1,499 | 24 (25.5%) | 0 (0.0%) |
| Total | 94 (100.0%) | 0 (0.0%) |
Health & Disability in Aucilla
Health Insurance Coverage by Age in Aucilla
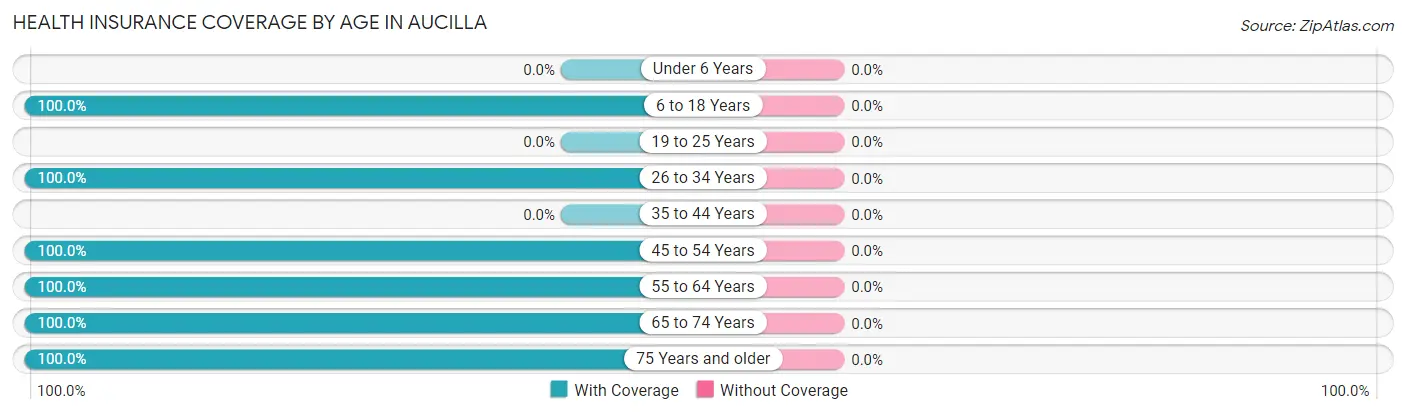
| Age Bracket | With Coverage | Without Coverage |
| Under 6 Years | 0 (0.0%) | 0 (0.0%) |
| 6 to 18 Years | 27 (100.0%) | 0 (0.0%) |
| 19 to 25 Years | 0 (0.0%) | 0 (0.0%) |
| 26 to 34 Years | 20 (100.0%) | 0 (0.0%) |
| 35 to 44 Years | 0 (0.0%) | 0 (0.0%) |
| 45 to 54 Years | 9 (100.0%) | 0 (0.0%) |
| 55 to 64 Years | 79 (100.0%) | 0 (0.0%) |
| 65 to 74 Years | 34 (100.0%) | 0 (0.0%) |
| 75 Years and older | 10 (100.0%) | 0 (0.0%) |
| Total | 179 (100.0%) | 0 (0.0%) |
Health Insurance Coverage by Citizenship Status in Aucilla
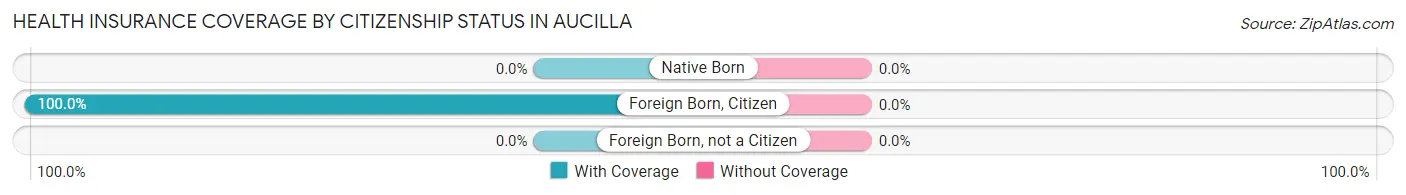
| Citizenship Status | With Coverage | Without Coverage |
| Native Born | 0 (0.0%) | 0 (0.0%) |
| Foreign Born, Citizen | 27 (100.0%) | 0 (0.0%) |
| Foreign Born, not a Citizen | 0 (0.0%) | 0 (0.0%) |
Health Insurance Coverage by Household Income in Aucilla
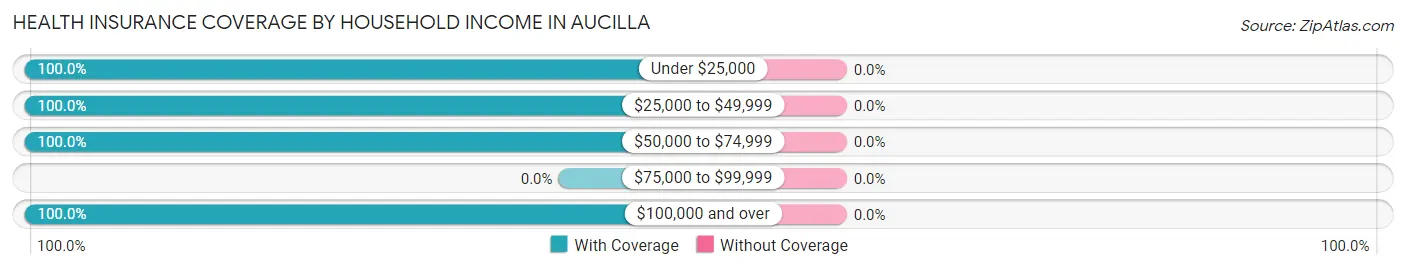
| Household Income | With Coverage | Without Coverage |
| Under $25,000 | 102 (100.0%) | 0 (0.0%) |
| $25,000 to $49,999 | 6 (100.0%) | 0 (0.0%) |
| $50,000 to $74,999 | 10 (100.0%) | 0 (0.0%) |
| $75,000 to $99,999 | 0 (0.0%) | 0 (0.0%) |
| $100,000 and over | 61 (100.0%) | 0 (0.0%) |
Public vs Private Health Insurance Coverage by Age in Aucilla
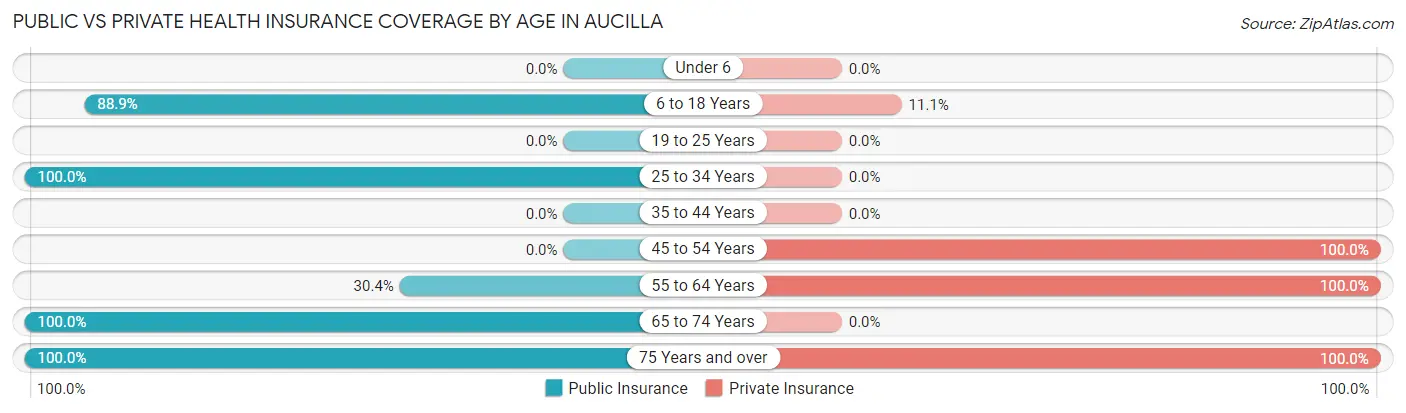
| Age Bracket | Public Insurance | Private Insurance |
| Under 6 | 0 (0.0%) | 0 (0.0%) |
| 6 to 18 Years | 24 (88.9%) | 3 (11.1%) |
| 19 to 25 Years | 0 (0.0%) | 0 (0.0%) |
| 25 to 34 Years | 20 (100.0%) | 0 (0.0%) |
| 35 to 44 Years | 0 (0.0%) | 0 (0.0%) |
| 45 to 54 Years | 0 (0.0%) | 9 (100.0%) |
| 55 to 64 Years | 24 (30.4%) | 79 (100.0%) |
| 65 to 74 Years | 34 (100.0%) | 0 (0.0%) |
| 75 Years and over | 10 (100.0%) | 10 (100.0%) |
| Total | 112 (62.6%) | 101 (56.4%) |
Disability Status by Sex by Age in Aucilla
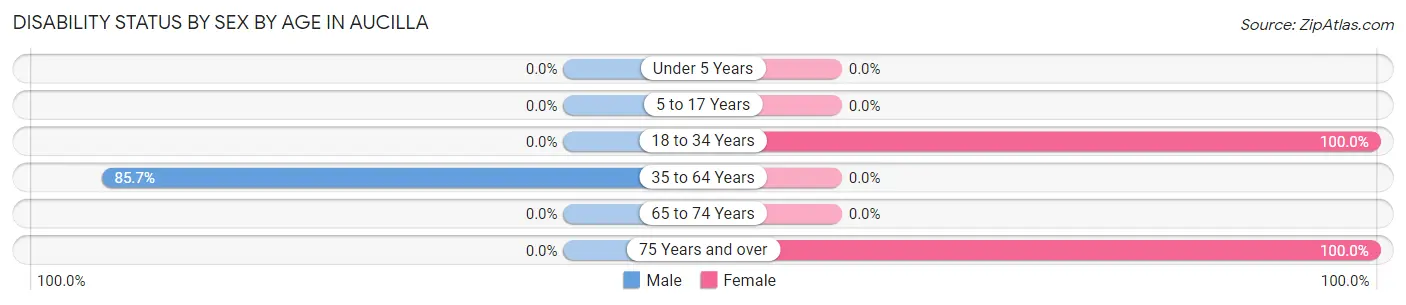
| Age Bracket | Male | Female |
| Under 5 Years | 0 (0.0%) | 0 (0.0%) |
| 5 to 17 Years | 0 (0.0%) | 0 (0.0%) |
| 18 to 34 Years | 0 (0.0%) | 20 (100.0%) |
| 35 to 64 Years | 48 (85.7%) | 0 (0.0%) |
| 65 to 74 Years | 0 (0.0%) | 0 (0.0%) |
| 75 Years and over | 0 (0.0%) | 10 (100.0%) |
Disability Class by Sex by Age in Aucilla
Disability Class: Hearing Difficulty
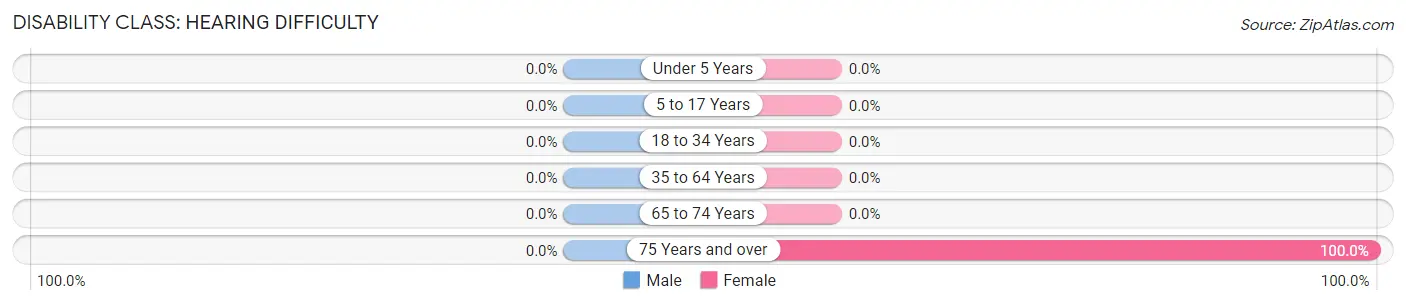
| Age Bracket | Male | Female |
| Under 5 Years | 0 (0.0%) | 0 (0.0%) |
| 5 to 17 Years | 0 (0.0%) | 0 (0.0%) |
| 18 to 34 Years | 0 (0.0%) | 0 (0.0%) |
| 35 to 64 Years | 0 (0.0%) | 0 (0.0%) |
| 65 to 74 Years | 0 (0.0%) | 0 (0.0%) |
| 75 Years and over | 0 (0.0%) | 10 (100.0%) |
Disability Class: Vision Difficulty
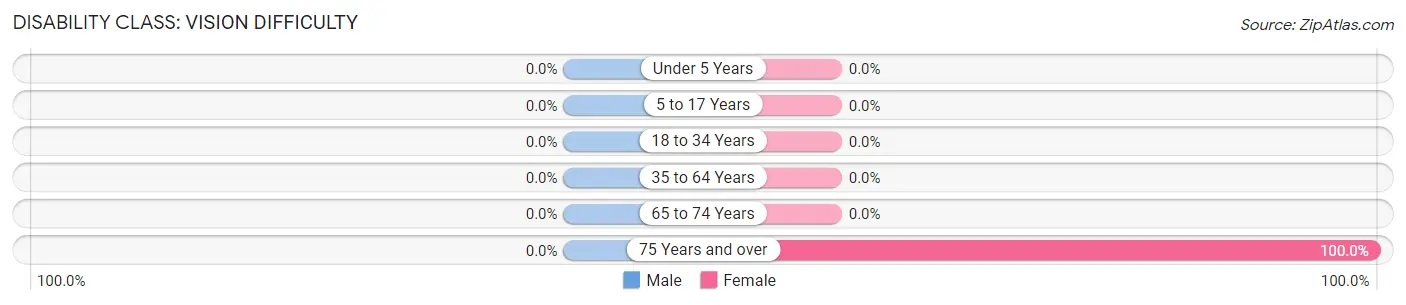
| Age Bracket | Male | Female |
| Under 5 Years | 0 (0.0%) | 0 (0.0%) |
| 5 to 17 Years | 0 (0.0%) | 0 (0.0%) |
| 18 to 34 Years | 0 (0.0%) | 0 (0.0%) |
| 35 to 64 Years | 0 (0.0%) | 0 (0.0%) |
| 65 to 74 Years | 0 (0.0%) | 0 (0.0%) |
| 75 Years and over | 0 (0.0%) | 10 (100.0%) |
Disability Class: Cognitive Difficulty
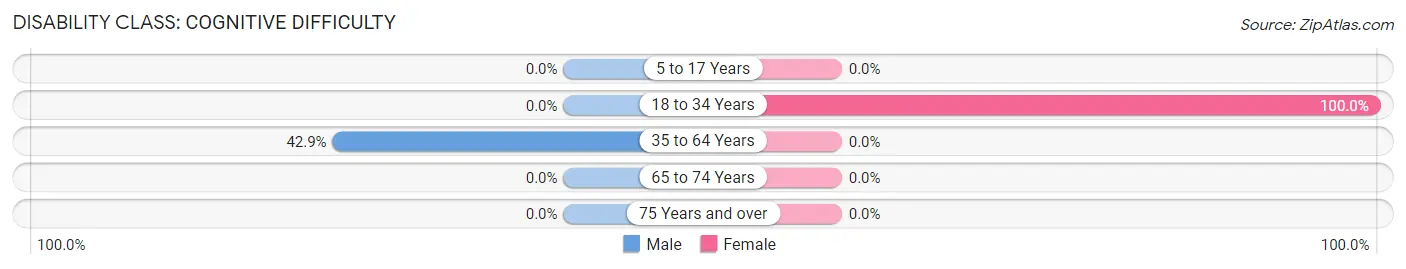
| Age Bracket | Male | Female |
| 5 to 17 Years | 0 (0.0%) | 0 (0.0%) |
| 18 to 34 Years | 0 (0.0%) | 20 (100.0%) |
| 35 to 64 Years | 24 (42.9%) | 0 (0.0%) |
| 65 to 74 Years | 0 (0.0%) | 0 (0.0%) |
| 75 Years and over | 0 (0.0%) | 0 (0.0%) |
Disability Class: Ambulatory Difficulty
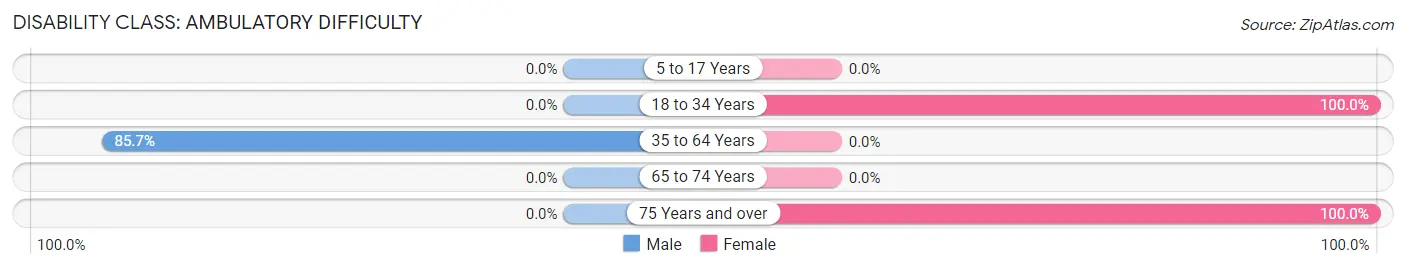
| Age Bracket | Male | Female |
| 5 to 17 Years | 0 (0.0%) | 0 (0.0%) |
| 18 to 34 Years | 0 (0.0%) | 20 (100.0%) |
| 35 to 64 Years | 48 (85.7%) | 0 (0.0%) |
| 65 to 74 Years | 0 (0.0%) | 0 (0.0%) |
| 75 Years and over | 0 (0.0%) | 10 (100.0%) |
Disability Class: Self-Care Difficulty
| Age Bracket | Male | Female |
| 5 to 17 Years | 0 (0.0%) | 0 (0.0%) |
| 18 to 34 Years | 0 (0.0%) | 0 (0.0%) |
| 35 to 64 Years | 0 (0.0%) | 0 (0.0%) |
| 65 to 74 Years | 0 (0.0%) | 0 (0.0%) |
| 75 Years and over | 0 (0.0%) | 0 (0.0%) |
Technology Access in Aucilla
Computing Device Access in Aucilla
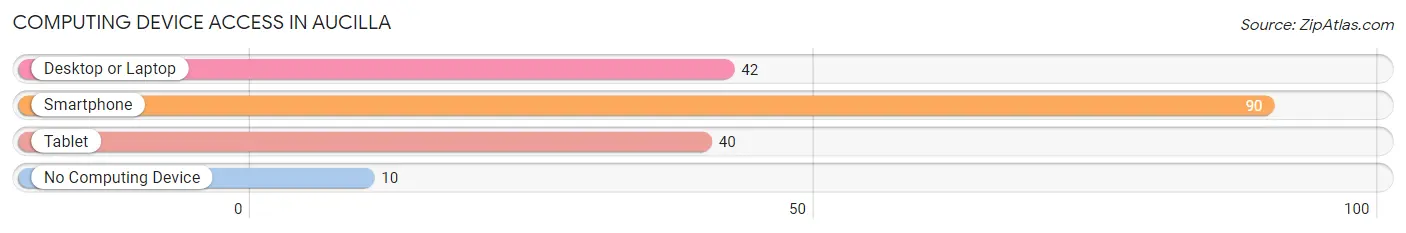
| Device Type | # Households | % Households |
| Desktop or Laptop | 42 | 42.0% |
| Smartphone | 90 | 90.0% |
| Tablet | 40 | 40.0% |
| No Computing Device | 10 | 10.0% |
| Total | 100 | 100.0% |
Internet Access in Aucilla
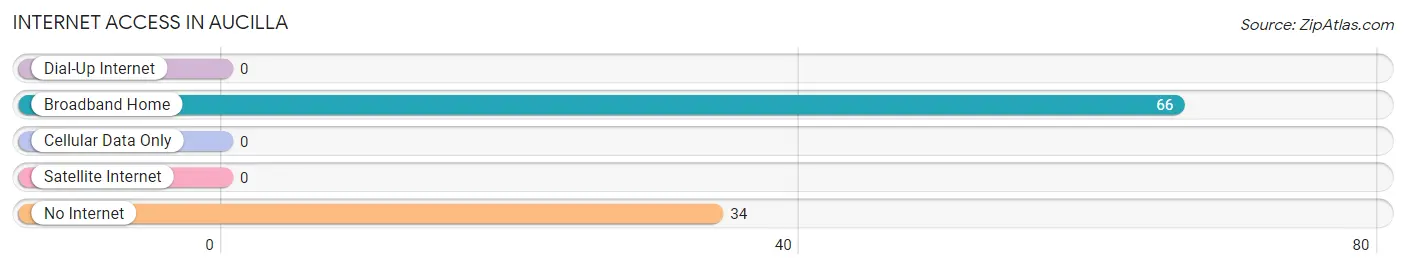
| Internet Type | # Households | % Households |
| Dial-Up Internet | 0 | 0.0% |
| Broadband Home | 66 | 66.0% |
| Cellular Data Only | 0 | 0.0% |
| Satellite Internet | 0 | 0.0% |
| No Internet | 34 | 34.0% |
| Total | 100 | 100.0% |
Aucilla Summary
Aucilla, Florida is a small town located in the panhandle of Florida, in Jefferson County. It is situated on the Aucilla River, which is a tributary of the Apalachicola River. The town was founded in 1827 and is named after the Aucilla River, which is derived from the Spanish word for “little river”. The town is located approximately 30 miles east of Tallahassee, the state capital.
Geography
Aucilla is located in the panhandle of Florida, in Jefferson County. It is situated on the Aucilla River, which is a tributary of the Apalachicola River. The town is located approximately 30 miles east of Tallahassee, the state capital. The town is surrounded by the Aucilla Wildlife Management Area, which is a protected area of over 10,000 acres of wetlands, forests, and prairies. The town is also located near the Apalachicola National Forest, which is a protected area of over 600,000 acres of forests and wetlands.
The town of Aucilla is located in a humid subtropical climate zone, with hot and humid summers and mild winters. The average temperature in the summer is around 90 degrees Fahrenheit, and the average temperature in the winter is around 60 degrees Fahrenheit. The town receives an average of 54 inches of rain per year.
Economy
The economy of Aucilla is largely based on agriculture and forestry. The town is home to several farms, which produce a variety of crops, including corn, soybeans, cotton, and peanuts. The town is also home to several timber companies, which harvest timber from the surrounding forests.
The town is also home to several small businesses, including restaurants, convenience stores, and gas stations. The town is also home to several churches, which provide services to the local community.
Demographics
As of the 2010 census, the population of Aucilla was 1,092. The population is predominantly white, with a small percentage of African Americans and Hispanics. The median household income in the town is $31,250, and the median age is 44.
The town is served by the Jefferson County School District, which operates several elementary, middle, and high schools in the area. The town is also home to several churches, which provide services to the local community.
Conclusion
Aucilla, Florida is a small town located in the panhandle of Florida, in Jefferson County. It is situated on the Aucilla River, which is a tributary of the Apalachicola River. The town was founded in 1827 and is named after the Aucilla River, which is derived from the Spanish word for “little river”. The town is located approximately 30 miles east of Tallahassee, the state capital. The town is surrounded by the Aucilla Wildlife Management Area, which is a protected area of over 10,000 acres of wetlands, forests, and prairies. The town is also located near the Apalachicola National Forest, which is a protected area of over 600,000 acres of forests and wetlands. The economy of Aucilla is largely based on agriculture and forestry, and the town is home to several small businesses, churches, and schools. The population of Aucilla is predominantly white, with a small percentage of African Americans and Hispanics. The median household income in the town is $31,250, and the median age is 44.
Common Questions
What is Per Capita Income in Aucilla?
Per Capita income in Aucilla is $61,117.
What is Inequality or Gini Index in Aucilla?
Inequality or Gini Index in Aucilla is 0.61.
What is the Total Population of Aucilla?
Total Population of Aucilla is 179.
What is the Total Male Population of Aucilla?
Total Male Population of Aucilla is 59.
What is the Total Female Population of Aucilla?
Total Female Population of Aucilla is 120.
What is the Ratio of Males per 100 Females in Aucilla?
There are 49.17 Males per 100 Females in Aucilla.
What is the Ratio of Females per 100 Males in Aucilla?
There are 203.39 Females per 100 Males in Aucilla.
What is the Median Population Age in Aucilla?
Median Population Age in Aucilla is 59.2 Years.
What is the Average Family Size in Aucilla
Average Family Size in Aucilla is 2.2 People.
What is the Average Household Size in Aucilla
Average Household Size in Aucilla is 1.8 People.
How Large is the Labor Force in Aucilla?
There are 90 People in the Labor Forcein in Aucilla.
What is the Percentage of People in the Labor Force in Aucilla?
59.2% of People are in the Labor Force in Aucilla.
What is the Unemployment Rate in Aucilla?
Unemployment Rate in Aucilla is 22.2%.