Mexican American Indian vs French Canadian Disability Age 5 to 17
COMPARE
Mexican American Indian
French Canadian
Disability Age 5 to 17
Disability Age 5 to 17 Comparison
Mexican American Indians
French Canadians
5.6%
DISABILITY AGE 5 TO 17
35.2/ 100
METRIC RATING
182nd/ 347
METRIC RANK
6.7%
DISABILITY AGE 5 TO 17
0.0/ 100
METRIC RATING
331st/ 347
METRIC RANK
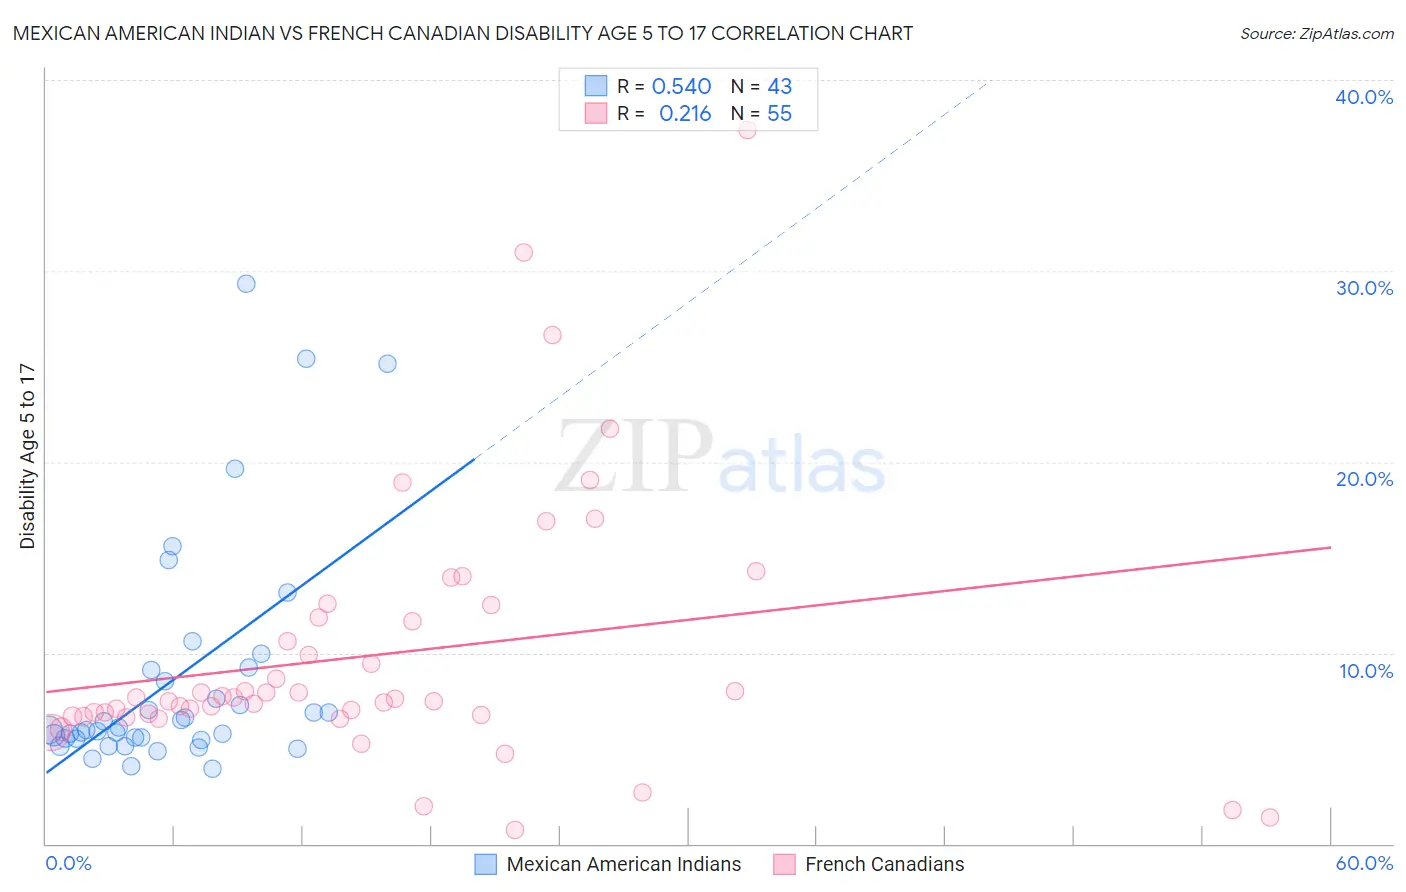
Mexican American Indian vs French Canadian Disability Age 5 to 17 Correlation Chart
The statistical analysis conducted on geographies consisting of 316,219,119 people shows a substantial positive correlation between the proportion of Mexican American Indians and percentage of population with a disability between the ages 5 and 17 in the United States with a correlation coefficient (R) of 0.540 and weighted average of 5.6%. Similarly, the statistical analysis conducted on geographies consisting of 494,798,155 people shows a weak positive correlation between the proportion of French Canadians and percentage of population with a disability between the ages 5 and 17 in the United States with a correlation coefficient (R) of 0.216 and weighted average of 6.7%, a difference of 19.0%.
Disability Age 5 to 17 Correlation Summary
| Measurement | Mexican American Indian | French Canadian |
| Minimum | 3.9% | 0.75% |
| Maximum | 29.3% | 37.4% |
| Range | 25.4% | 36.6% |
| Mean | 8.6% | 9.9% |
| Median | 6.0% | 7.6% |
| Interquartile 25% (IQ1) | 5.5% | 6.7% |
| Interquartile 75% (IQ3) | 9.1% | 11.8% |
| Interquartile Range (IQR) | 3.6% | 5.2% |
| Standard Deviation (Sample) | 6.0% | 6.9% |
| Standard Deviation (Population) | 5.9% | 6.8% |
Similar Demographics by Disability Age 5 to 17
Demographics Similar to Mexican American Indians by Disability Age 5 to 17
In terms of disability age 5 to 17, the demographic groups most similar to Mexican American Indians are Immigrants from Latin America (5.6%, a difference of 0.050%), Immigrants from England (5.6%, a difference of 0.060%), Syrian (5.6%, a difference of 0.080%), Immigrants from Mexico (5.6%, a difference of 0.080%), and Immigrants from Uruguay (5.6%, a difference of 0.13%).
| Demographics | Rating | Rank | Disability Age 5 to 17 |
| Shoshone | 49.4 /100 | #175 | Average 5.6% |
| Immigrants | Central America | 49.4 /100 | #176 | Average 5.6% |
| Immigrants | Western Europe | 47.8 /100 | #177 | Average 5.6% |
| Immigrants | Trinidad and Tobago | 47.6 /100 | #178 | Average 5.6% |
| Immigrants | Barbados | 40.5 /100 | #179 | Average 5.6% |
| Immigrants | Uruguay | 37.7 /100 | #180 | Fair 5.6% |
| Immigrants | England | 36.4 /100 | #181 | Fair 5.6% |
| Mexican American Indians | 35.2 /100 | #182 | Fair 5.6% |
| Immigrants | Latin America | 34.3 /100 | #183 | Fair 5.6% |
| Syrians | 33.8 /100 | #184 | Fair 5.6% |
| Immigrants | Mexico | 33.7 /100 | #185 | Fair 5.6% |
| Fijians | 31.7 /100 | #186 | Fair 5.7% |
| Immigrants | Thailand | 30.2 /100 | #187 | Fair 5.7% |
| Marshallese | 28.1 /100 | #188 | Fair 5.7% |
| Pueblo | 27.5 /100 | #189 | Fair 5.7% |
Demographics Similar to French Canadians by Disability Age 5 to 17
In terms of disability age 5 to 17, the demographic groups most similar to French Canadians are Immigrants from the Azores (6.7%, a difference of 0.020%), Dutch West Indian (6.7%, a difference of 0.080%), Black/African American (6.8%, a difference of 0.61%), Seminole (6.8%, a difference of 0.66%), and Ottawa (6.8%, a difference of 1.4%).
| Demographics | Rating | Rank | Disability Age 5 to 17 |
| Dominicans | 0.0 /100 | #324 | Tragic 6.5% |
| Americans | 0.0 /100 | #325 | Tragic 6.5% |
| Potawatomi | 0.0 /100 | #326 | Tragic 6.5% |
| French American Indians | 0.0 /100 | #327 | Tragic 6.6% |
| Pennsylvania Germans | 0.0 /100 | #328 | Tragic 6.6% |
| Blackfeet | 0.0 /100 | #329 | Tragic 6.6% |
| Dutch West Indians | 0.0 /100 | #330 | Tragic 6.7% |
| French Canadians | 0.0 /100 | #331 | Tragic 6.7% |
| Immigrants | Azores | 0.0 /100 | #332 | Tragic 6.7% |
| Blacks/African Americans | 0.0 /100 | #333 | Tragic 6.8% |
| Seminole | 0.0 /100 | #334 | Tragic 6.8% |
| Ottawa | 0.0 /100 | #335 | Tragic 6.8% |
| Chickasaw | 0.0 /100 | #336 | Tragic 6.8% |
| Creek | 0.0 /100 | #337 | Tragic 6.9% |
| Iroquois | 0.0 /100 | #338 | Tragic 6.9% |