Mexican American Indian vs Serbian Disability Age 5 to 17
COMPARE
Mexican American Indian
Serbian
Disability Age 5 to 17
Disability Age 5 to 17 Comparison
Mexican American Indians
Serbians
5.6%
DISABILITY AGE 5 TO 17
35.2/ 100
METRIC RATING
182nd/ 347
METRIC RANK
5.6%
DISABILITY AGE 5 TO 17
54.0/ 100
METRIC RATING
170th/ 347
METRIC RANK
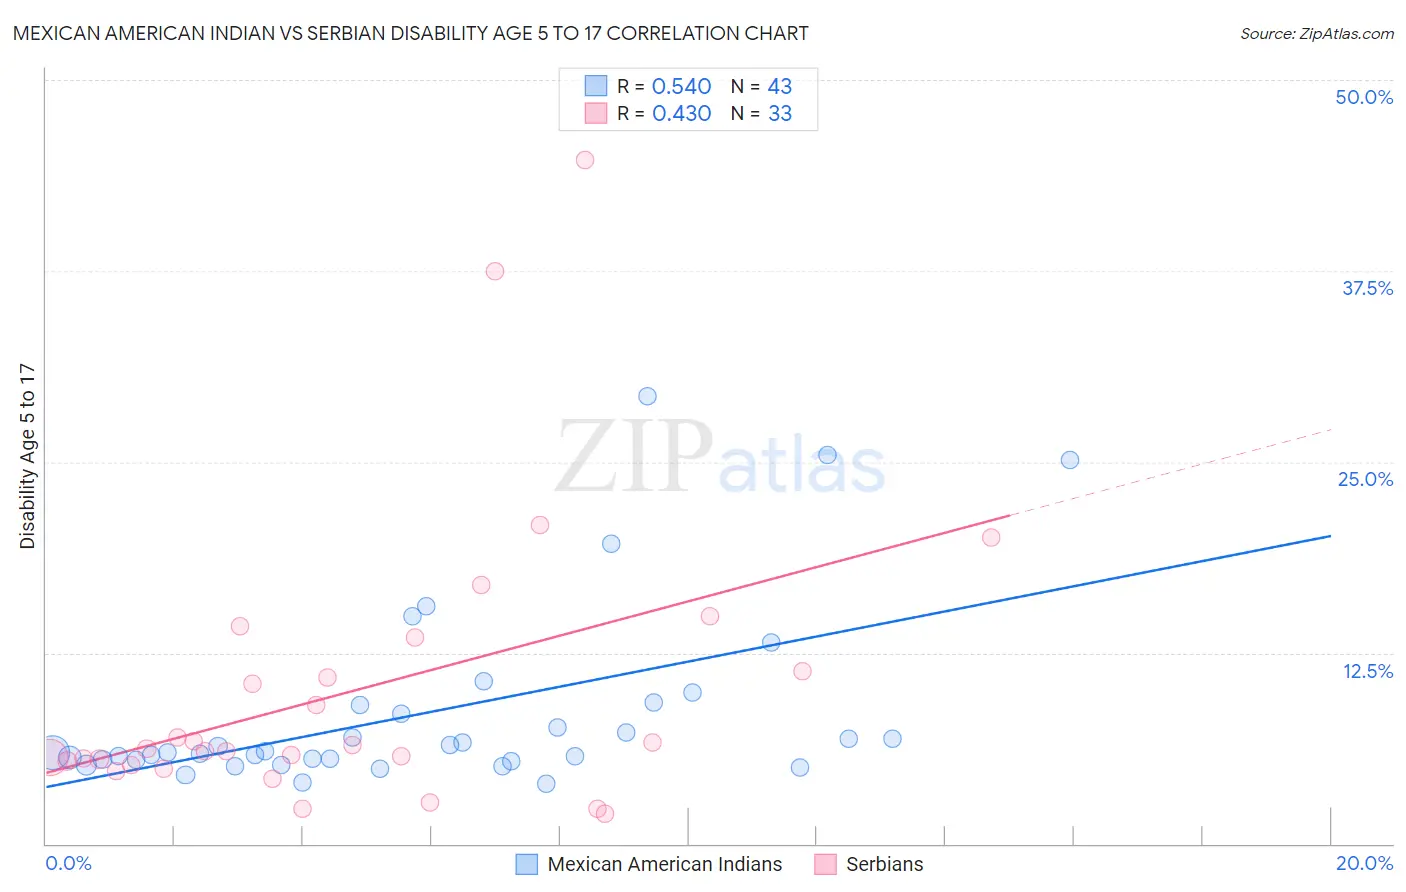
Mexican American Indian vs Serbian Disability Age 5 to 17 Correlation Chart
The statistical analysis conducted on geographies consisting of 316,219,119 people shows a substantial positive correlation between the proportion of Mexican American Indians and percentage of population with a disability between the ages 5 and 17 in the United States with a correlation coefficient (R) of 0.540 and weighted average of 5.6%. Similarly, the statistical analysis conducted on geographies consisting of 265,742,424 people shows a moderate positive correlation between the proportion of Serbians and percentage of population with a disability between the ages 5 and 17 in the United States with a correlation coefficient (R) of 0.430 and weighted average of 5.6%, a difference of 0.95%.
Disability Age 5 to 17 Correlation Summary
| Measurement | Mexican American Indian | Serbian |
| Minimum | 3.9% | 2.0% |
| Maximum | 29.3% | 44.7% |
| Range | 25.4% | 42.7% |
| Mean | 8.6% | 10.0% |
| Median | 6.0% | 6.2% |
| Interquartile 25% (IQ1) | 5.5% | 5.3% |
| Interquartile 75% (IQ3) | 9.1% | 12.4% |
| Interquartile Range (IQR) | 3.6% | 7.1% |
| Standard Deviation (Sample) | 6.0% | 9.4% |
| Standard Deviation (Population) | 5.9% | 9.3% |
Demographics Similar to Mexican American Indians and Serbians by Disability Age 5 to 17
In terms of disability age 5 to 17, the demographic groups most similar to Mexican American Indians are Immigrants from Latin America (5.6%, a difference of 0.050%), Immigrants from England (5.6%, a difference of 0.060%), Syrian (5.6%, a difference of 0.080%), Immigrants from Mexico (5.6%, a difference of 0.080%), and Immigrants from Uruguay (5.6%, a difference of 0.13%). Similarly, the demographic groups most similar to Serbians are Immigrants from Iraq (5.6%, a difference of 0.0%), Immigrants from Norway (5.6%, a difference of 0.080%), Iraqi (5.6%, a difference of 0.10%), Ukrainian (5.6%, a difference of 0.12%), and Uruguayan (5.6%, a difference of 0.15%).
| Demographics | Rating | Rank | Disability Age 5 to 17 |
| Greeks | 60.6 /100 | #166 | Good 5.6% |
| Immigrants | Burma/Myanmar | 59.3 /100 | #167 | Average 5.6% |
| Iraqis | 56.0 /100 | #168 | Average 5.6% |
| Immigrants | Norway | 55.7 /100 | #169 | Average 5.6% |
| Serbians | 54.0 /100 | #170 | Average 5.6% |
| Immigrants | Iraq | 53.9 /100 | #171 | Average 5.6% |
| Ukrainians | 51.5 /100 | #172 | Average 5.6% |
| Uruguayans | 51.0 /100 | #173 | Average 5.6% |
| Costa Ricans | 50.0 /100 | #174 | Average 5.6% |
| Shoshone | 49.4 /100 | #175 | Average 5.6% |
| Immigrants | Central America | 49.4 /100 | #176 | Average 5.6% |
| Immigrants | Western Europe | 47.8 /100 | #177 | Average 5.6% |
| Immigrants | Trinidad and Tobago | 47.6 /100 | #178 | Average 5.6% |
| Immigrants | Barbados | 40.5 /100 | #179 | Average 5.6% |
| Immigrants | Uruguay | 37.7 /100 | #180 | Fair 5.6% |
| Immigrants | England | 36.4 /100 | #181 | Fair 5.6% |
| Mexican American Indians | 35.2 /100 | #182 | Fair 5.6% |
| Immigrants | Latin America | 34.3 /100 | #183 | Fair 5.6% |
| Syrians | 33.8 /100 | #184 | Fair 5.6% |
| Immigrants | Mexico | 33.7 /100 | #185 | Fair 5.6% |
| Fijians | 31.7 /100 | #186 | Fair 5.7% |