Mexican American Indian vs Polish Disability Age 5 to 17
COMPARE
Mexican American Indian
Polish
Disability Age 5 to 17
Disability Age 5 to 17 Comparison
Mexican American Indians
Poles
5.6%
DISABILITY AGE 5 TO 17
35.2/ 100
METRIC RATING
182nd/ 347
METRIC RANK
5.9%
DISABILITY AGE 5 TO 17
1.5/ 100
METRIC RATING
250th/ 347
METRIC RANK
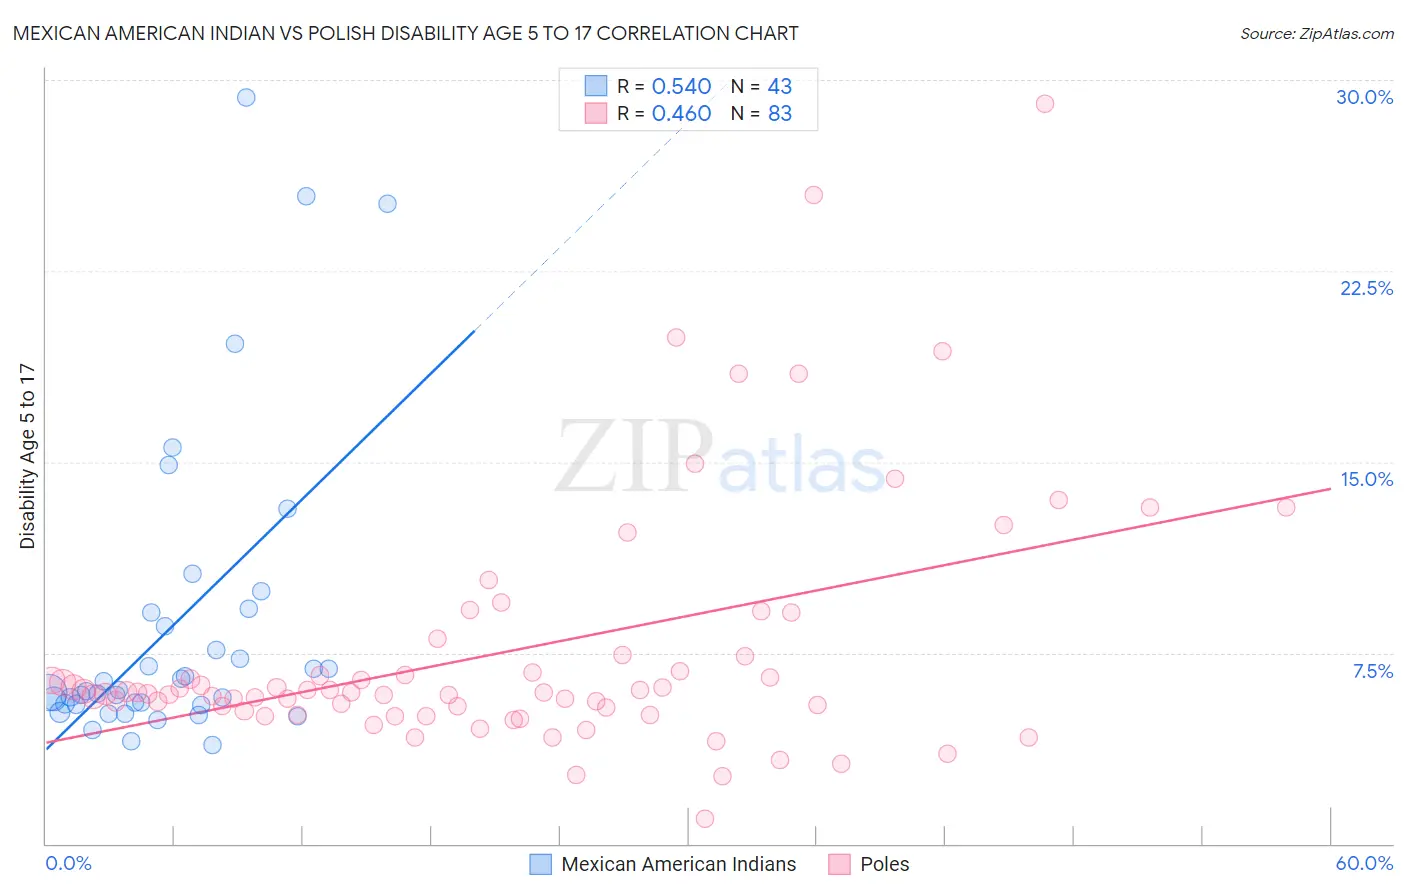
Mexican American Indian vs Polish Disability Age 5 to 17 Correlation Chart
The statistical analysis conducted on geographies consisting of 316,219,119 people shows a substantial positive correlation between the proportion of Mexican American Indians and percentage of population with a disability between the ages 5 and 17 in the United States with a correlation coefficient (R) of 0.540 and weighted average of 5.6%. Similarly, the statistical analysis conducted on geographies consisting of 547,751,801 people shows a moderate positive correlation between the proportion of Poles and percentage of population with a disability between the ages 5 and 17 in the United States with a correlation coefficient (R) of 0.460 and weighted average of 5.9%, a difference of 4.3%.
Disability Age 5 to 17 Correlation Summary
| Measurement | Mexican American Indian | Polish |
| Minimum | 3.9% | 0.99% |
| Maximum | 29.3% | 29.1% |
| Range | 25.4% | 28.1% |
| Mean | 8.6% | 7.5% |
| Median | 6.0% | 5.9% |
| Interquartile 25% (IQ1) | 5.5% | 5.2% |
| Interquartile 75% (IQ3) | 9.1% | 7.4% |
| Interquartile Range (IQR) | 3.6% | 2.2% |
| Standard Deviation (Sample) | 6.0% | 4.9% |
| Standard Deviation (Population) | 5.9% | 4.9% |
Similar Demographics by Disability Age 5 to 17
Demographics Similar to Mexican American Indians by Disability Age 5 to 17
In terms of disability age 5 to 17, the demographic groups most similar to Mexican American Indians are Immigrants from Latin America (5.6%, a difference of 0.050%), Immigrants from England (5.6%, a difference of 0.060%), Syrian (5.6%, a difference of 0.080%), Immigrants from Mexico (5.6%, a difference of 0.080%), and Immigrants from Uruguay (5.6%, a difference of 0.13%).
| Demographics | Rating | Rank | Disability Age 5 to 17 |
| Shoshone | 49.4 /100 | #175 | Average 5.6% |
| Immigrants | Central America | 49.4 /100 | #176 | Average 5.6% |
| Immigrants | Western Europe | 47.8 /100 | #177 | Average 5.6% |
| Immigrants | Trinidad and Tobago | 47.6 /100 | #178 | Average 5.6% |
| Immigrants | Barbados | 40.5 /100 | #179 | Average 5.6% |
| Immigrants | Uruguay | 37.7 /100 | #180 | Fair 5.6% |
| Immigrants | England | 36.4 /100 | #181 | Fair 5.6% |
| Mexican American Indians | 35.2 /100 | #182 | Fair 5.6% |
| Immigrants | Latin America | 34.3 /100 | #183 | Fair 5.6% |
| Syrians | 33.8 /100 | #184 | Fair 5.6% |
| Immigrants | Mexico | 33.7 /100 | #185 | Fair 5.6% |
| Fijians | 31.7 /100 | #186 | Fair 5.7% |
| Immigrants | Thailand | 30.2 /100 | #187 | Fair 5.7% |
| Marshallese | 28.1 /100 | #188 | Fair 5.7% |
| Pueblo | 27.5 /100 | #189 | Fair 5.7% |
Demographics Similar to Poles by Disability Age 5 to 17
In terms of disability age 5 to 17, the demographic groups most similar to Poles are Immigrants from Cambodia (5.9%, a difference of 0.020%), Honduran (5.9%, a difference of 0.040%), Scandinavian (5.9%, a difference of 0.11%), Immigrants from Ghana (5.9%, a difference of 0.12%), and British (5.9%, a difference of 0.13%).
| Demographics | Rating | Rank | Disability Age 5 to 17 |
| Indonesians | 2.0 /100 | #243 | Tragic 5.9% |
| Immigrants | Germany | 1.9 /100 | #244 | Tragic 5.9% |
| Immigrants | Micronesia | 1.9 /100 | #245 | Tragic 5.9% |
| Tlingit-Haida | 1.9 /100 | #246 | Tragic 5.9% |
| Immigrants | Honduras | 1.8 /100 | #247 | Tragic 5.9% |
| British | 1.7 /100 | #248 | Tragic 5.9% |
| Immigrants | Ghana | 1.7 /100 | #249 | Tragic 5.9% |
| Poles | 1.5 /100 | #250 | Tragic 5.9% |
| Immigrants | Cambodia | 1.5 /100 | #251 | Tragic 5.9% |
| Hondurans | 1.5 /100 | #252 | Tragic 5.9% |
| Scandinavians | 1.4 /100 | #253 | Tragic 5.9% |
| Barbadians | 1.3 /100 | #254 | Tragic 5.9% |
| Italians | 1.2 /100 | #255 | Tragic 5.9% |
| Hopi | 1.0 /100 | #256 | Tragic 5.9% |
| Hispanics or Latinos | 1.0 /100 | #257 | Tragic 5.9% |