Immigrants from Vietnam vs Immigrants from Kuwait Disability Age 5 to 17
COMPARE
Immigrants from Vietnam
Immigrants from Kuwait
Disability Age 5 to 17
Disability Age 5 to 17 Comparison
Immigrants from Vietnam
Immigrants from Kuwait
5.2%
DISABILITY AGE 5 TO 17
99.7/ 100
METRIC RATING
72nd/ 347
METRIC RANK
5.3%
DISABILITY AGE 5 TO 17
99.4/ 100
METRIC RATING
90th/ 347
METRIC RANK
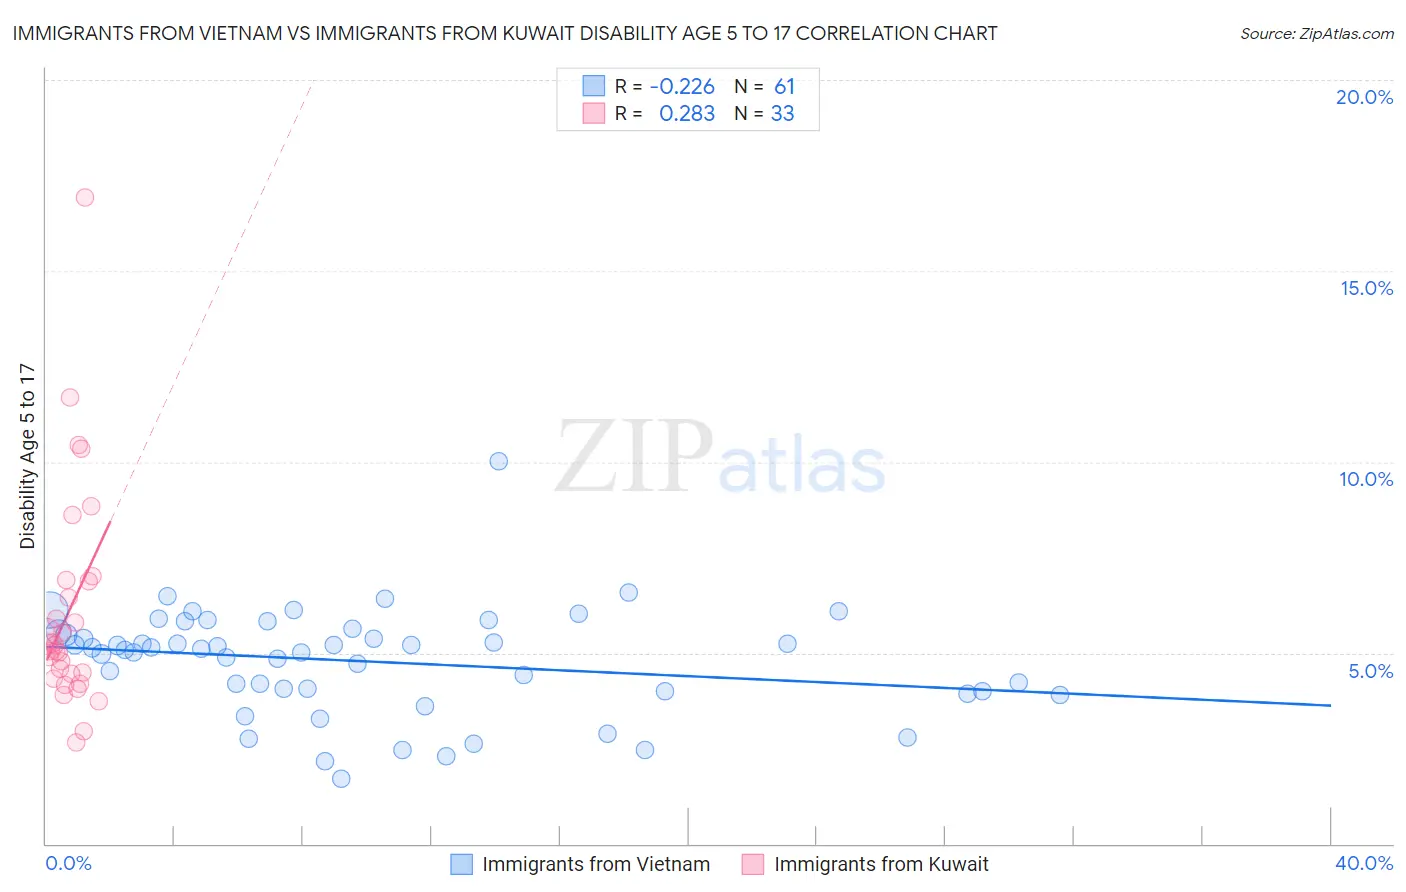
Immigrants from Vietnam vs Immigrants from Kuwait Disability Age 5 to 17 Correlation Chart
The statistical analysis conducted on geographies consisting of 402,102,659 people shows a weak negative correlation between the proportion of Immigrants from Vietnam and percentage of population with a disability between the ages 5 and 17 in the United States with a correlation coefficient (R) of -0.226 and weighted average of 5.2%. Similarly, the statistical analysis conducted on geographies consisting of 136,559,233 people shows a weak positive correlation between the proportion of Immigrants from Kuwait and percentage of population with a disability between the ages 5 and 17 in the United States with a correlation coefficient (R) of 0.283 and weighted average of 5.3%, a difference of 1.0%.
Disability Age 5 to 17 Correlation Summary
| Measurement | Immigrants from Vietnam | Immigrants from Kuwait |
| Minimum | 1.7% | 2.7% |
| Maximum | 10.0% | 16.9% |
| Range | 8.3% | 14.3% |
| Mean | 4.8% | 6.1% |
| Median | 5.1% | 5.2% |
| Interquartile 25% (IQ1) | 4.0% | 4.4% |
| Interquartile 75% (IQ3) | 5.6% | 6.9% |
| Interquartile Range (IQR) | 1.6% | 2.5% |
| Standard Deviation (Sample) | 1.4% | 2.9% |
| Standard Deviation (Population) | 1.4% | 2.8% |
Demographics Similar to Immigrants from Vietnam and Immigrants from Kuwait by Disability Age 5 to 17
In terms of disability age 5 to 17, the demographic groups most similar to Immigrants from Vietnam are Jordanian (5.2%, a difference of 0.020%), Immigrants from Czechoslovakia (5.2%, a difference of 0.020%), Immigrants from Romania (5.2%, a difference of 0.090%), Immigrants from Moldova (5.2%, a difference of 0.32%), and Immigrants from Guyana (5.2%, a difference of 0.35%). Similarly, the demographic groups most similar to Immigrants from Kuwait are Immigrants from Croatia (5.2%, a difference of 0.050%), Immigrants from Spain (5.2%, a difference of 0.050%), Eastern European (5.2%, a difference of 0.080%), Immigrants from St. Vincent and the Grenadines (5.2%, a difference of 0.13%), and Bulgarian (5.2%, a difference of 0.17%).
| Demographics | Rating | Rank | Disability Age 5 to 17 |
| Jordanians | 99.7 /100 | #71 | Exceptional 5.2% |
| Immigrants | Vietnam | 99.7 /100 | #72 | Exceptional 5.2% |
| Immigrants | Czechoslovakia | 99.7 /100 | #73 | Exceptional 5.2% |
| Immigrants | Romania | 99.7 /100 | #74 | Exceptional 5.2% |
| Immigrants | Moldova | 99.6 /100 | #75 | Exceptional 5.2% |
| Immigrants | Guyana | 99.6 /100 | #76 | Exceptional 5.2% |
| Immigrants | Kazakhstan | 99.6 /100 | #77 | Exceptional 5.2% |
| Immigrants | Cuba | 99.6 /100 | #78 | Exceptional 5.2% |
| Afghans | 99.6 /100 | #79 | Exceptional 5.2% |
| Sri Lankans | 99.6 /100 | #80 | Exceptional 5.2% |
| Native Hawaiians | 99.6 /100 | #81 | Exceptional 5.2% |
| Immigrants | Sweden | 99.5 /100 | #82 | Exceptional 5.2% |
| Immigrants | France | 99.5 /100 | #83 | Exceptional 5.2% |
| Immigrants | Nicaragua | 99.5 /100 | #84 | Exceptional 5.2% |
| Bulgarians | 99.4 /100 | #85 | Exceptional 5.2% |
| Immigrants | St. Vincent and the Grenadines | 99.4 /100 | #86 | Exceptional 5.2% |
| Eastern Europeans | 99.4 /100 | #87 | Exceptional 5.2% |
| Immigrants | Croatia | 99.4 /100 | #88 | Exceptional 5.2% |
| Immigrants | Spain | 99.4 /100 | #89 | Exceptional 5.2% |
| Immigrants | Kuwait | 99.4 /100 | #90 | Exceptional 5.3% |
| Mongolians | 99.2 /100 | #91 | Exceptional 5.3% |