Armenian vs Immigrants from Bahamas Disability Age 5 to 17
COMPARE
Armenian
Immigrants from Bahamas
Disability Age 5 to 17
Disability Age 5 to 17 Comparison
Armenians
Immigrants from Bahamas
4.6%
DISABILITY AGE 5 TO 17
100.0/ 100
METRIC RATING
11th/ 347
METRIC RANK
6.2%
DISABILITY AGE 5 TO 17
0.0/ 100
METRIC RATING
297th/ 347
METRIC RANK
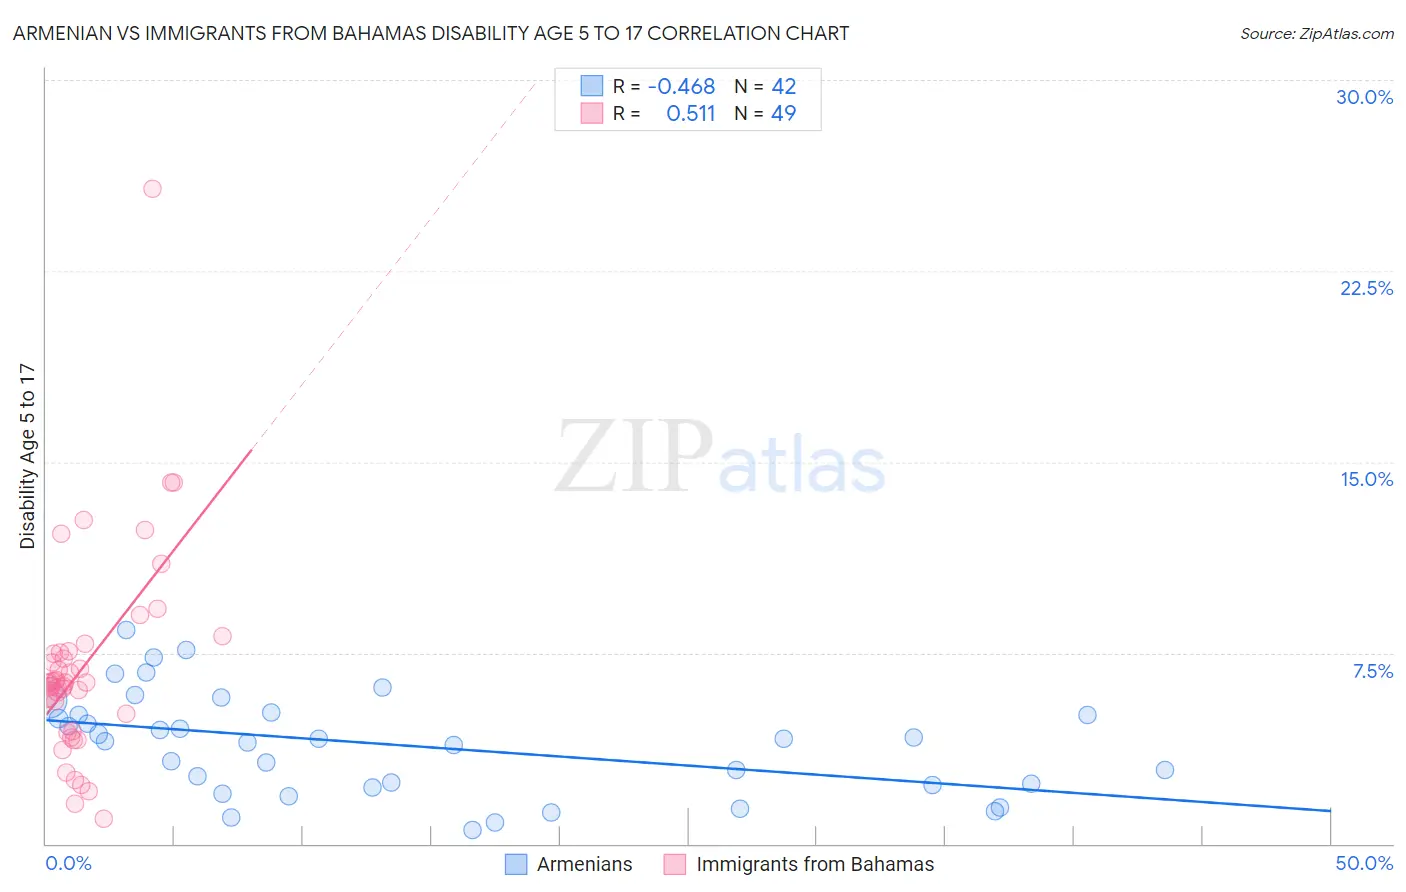
Armenian vs Immigrants from Bahamas Disability Age 5 to 17 Correlation Chart
The statistical analysis conducted on geographies consisting of 308,701,051 people shows a moderate negative correlation between the proportion of Armenians and percentage of population with a disability between the ages 5 and 17 in the United States with a correlation coefficient (R) of -0.468 and weighted average of 4.6%. Similarly, the statistical analysis conducted on geographies consisting of 104,453,975 people shows a substantial positive correlation between the proportion of Immigrants from Bahamas and percentage of population with a disability between the ages 5 and 17 in the United States with a correlation coefficient (R) of 0.511 and weighted average of 6.2%, a difference of 35.9%.
Disability Age 5 to 17 Correlation Summary
| Measurement | Armenian | Immigrants from Bahamas |
| Minimum | 0.52% | 0.96% |
| Maximum | 8.4% | 25.7% |
| Range | 7.9% | 24.8% |
| Mean | 3.9% | 6.9% |
| Median | 4.1% | 6.3% |
| Interquartile 25% (IQ1) | 2.3% | 4.7% |
| Interquartile 75% (IQ3) | 5.1% | 7.5% |
| Interquartile Range (IQR) | 2.8% | 2.8% |
| Standard Deviation (Sample) | 2.0% | 4.0% |
| Standard Deviation (Population) | 2.0% | 4.0% |
Similar Demographics by Disability Age 5 to 17
Demographics Similar to Armenians by Disability Age 5 to 17
In terms of disability age 5 to 17, the demographic groups most similar to Armenians are Immigrants from India (4.6%, a difference of 0.16%), Immigrants from Eastern Asia (4.6%, a difference of 0.23%), Iranian (4.6%, a difference of 0.24%), Indian (Asian) (4.6%, a difference of 0.56%), and Thai (4.7%, a difference of 1.3%).
| Demographics | Rating | Rank | Disability Age 5 to 17 |
| Filipinos | 100.0 /100 | #4 | Exceptional 4.3% |
| Immigrants | Iran | 100.0 /100 | #5 | Exceptional 4.4% |
| Immigrants | Israel | 100.0 /100 | #6 | Exceptional 4.5% |
| Immigrants | China | 100.0 /100 | #7 | Exceptional 4.5% |
| Indians (Asian) | 100.0 /100 | #8 | Exceptional 4.6% |
| Immigrants | Eastern Asia | 100.0 /100 | #9 | Exceptional 4.6% |
| Immigrants | India | 100.0 /100 | #10 | Exceptional 4.6% |
| Armenians | 100.0 /100 | #11 | Exceptional 4.6% |
| Iranians | 100.0 /100 | #12 | Exceptional 4.6% |
| Thais | 100.0 /100 | #13 | Exceptional 4.7% |
| Immigrants | Korea | 100.0 /100 | #14 | Exceptional 4.7% |
| Chinese | 100.0 /100 | #15 | Exceptional 4.7% |
| Immigrants | Singapore | 100.0 /100 | #16 | Exceptional 4.7% |
| Arapaho | 100.0 /100 | #17 | Exceptional 4.7% |
| Immigrants | South Central Asia | 100.0 /100 | #18 | Exceptional 4.7% |
Demographics Similar to Immigrants from Bahamas by Disability Age 5 to 17
In terms of disability age 5 to 17, the demographic groups most similar to Immigrants from Bahamas are Lumbee (6.2%, a difference of 0.070%), Spanish American (6.2%, a difference of 0.12%), Cree (6.2%, a difference of 0.15%), Welsh (6.3%, a difference of 0.22%), and Carpatho Rusyn (6.3%, a difference of 0.34%).
| Demographics | Rating | Rank | Disability Age 5 to 17 |
| Immigrants | Congo | 0.0 /100 | #290 | Tragic 6.2% |
| Whites/Caucasians | 0.0 /100 | #291 | Tragic 6.2% |
| Immigrants | Senegal | 0.0 /100 | #292 | Tragic 6.2% |
| Central American Indians | 0.0 /100 | #293 | Tragic 6.2% |
| Irish | 0.0 /100 | #294 | Tragic 6.2% |
| Cree | 0.0 /100 | #295 | Tragic 6.2% |
| Spanish Americans | 0.0 /100 | #296 | Tragic 6.2% |
| Immigrants | Bahamas | 0.0 /100 | #297 | Tragic 6.2% |
| Lumbee | 0.0 /100 | #298 | Tragic 6.2% |
| Welsh | 0.0 /100 | #299 | Tragic 6.3% |
| Carpatho Rusyns | 0.0 /100 | #300 | Tragic 6.3% |
| U.S. Virgin Islanders | 0.0 /100 | #301 | Tragic 6.3% |
| Celtics | 0.0 /100 | #302 | Tragic 6.3% |
| Yakama | 0.0 /100 | #303 | Tragic 6.3% |
| Senegalese | 0.0 /100 | #304 | Tragic 6.3% |