Armenian vs German Russian Disability Age 5 to 17
COMPARE
Armenian
German Russian
Disability Age 5 to 17
Disability Age 5 to 17 Comparison
Armenians
German Russians
4.6%
DISABILITY AGE 5 TO 17
100.0/ 100
METRIC RATING
11th/ 347
METRIC RANK
5.9%
DISABILITY AGE 5 TO 17
2.4/ 100
METRIC RATING
239th/ 347
METRIC RANK
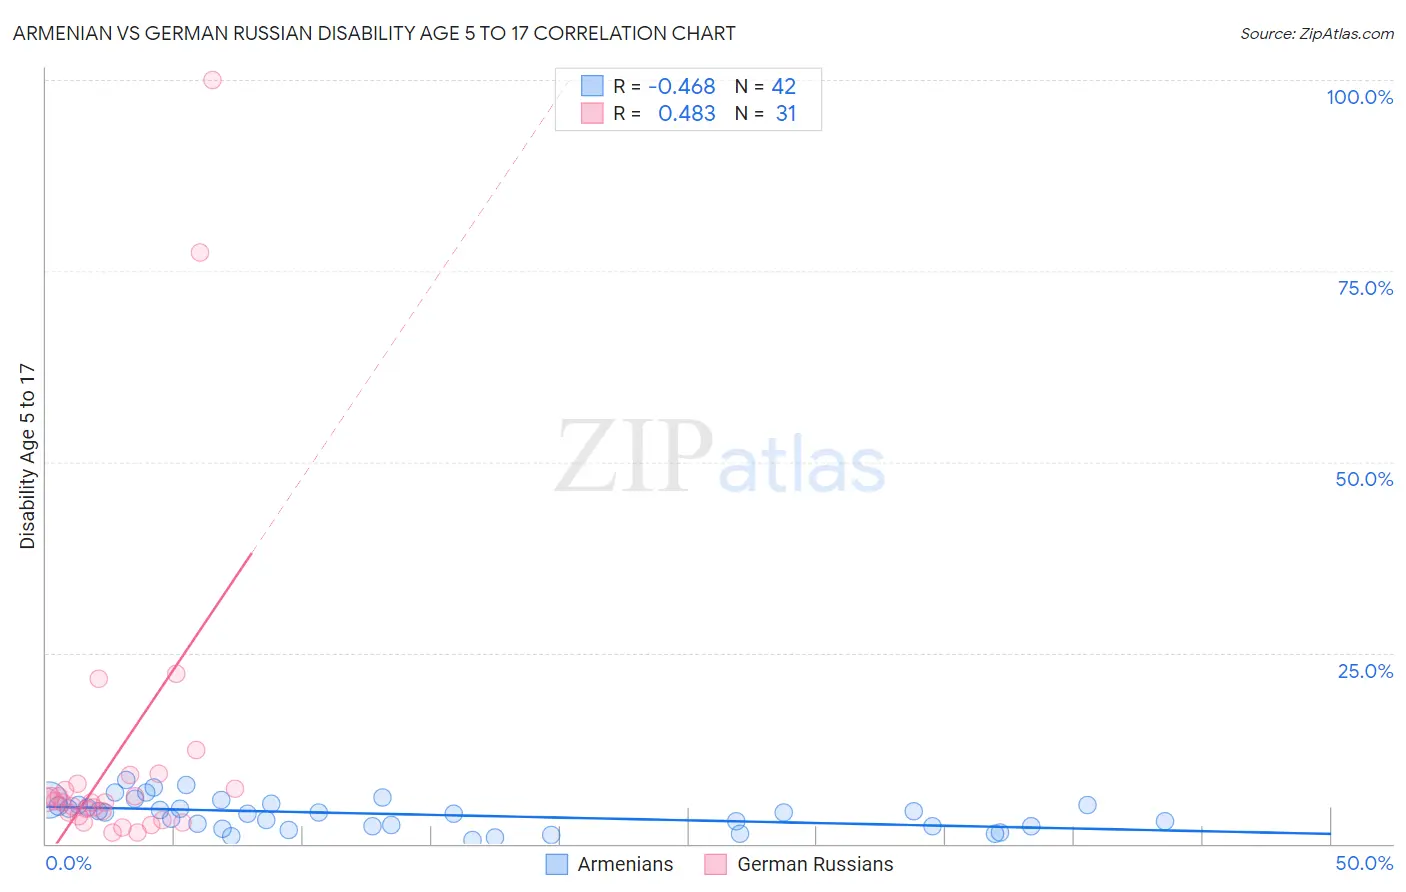
Armenian vs German Russian Disability Age 5 to 17 Correlation Chart
The statistical analysis conducted on geographies consisting of 308,701,051 people shows a moderate negative correlation between the proportion of Armenians and percentage of population with a disability between the ages 5 and 17 in the United States with a correlation coefficient (R) of -0.468 and weighted average of 4.6%. Similarly, the statistical analysis conducted on geographies consisting of 96,193,238 people shows a moderate positive correlation between the proportion of German Russians and percentage of population with a disability between the ages 5 and 17 in the United States with a correlation coefficient (R) of 0.483 and weighted average of 5.9%, a difference of 27.5%.
Disability Age 5 to 17 Correlation Summary
| Measurement | Armenian | German Russian |
| Minimum | 0.52% | 1.4% |
| Maximum | 8.4% | 100.0% |
| Range | 7.9% | 98.6% |
| Mean | 3.9% | 11.7% |
| Median | 4.1% | 5.4% |
| Interquartile 25% (IQ1) | 2.3% | 3.6% |
| Interquartile 75% (IQ3) | 5.1% | 7.9% |
| Interquartile Range (IQR) | 2.8% | 4.3% |
| Standard Deviation (Sample) | 2.0% | 21.3% |
| Standard Deviation (Population) | 2.0% | 21.0% |
Similar Demographics by Disability Age 5 to 17
Demographics Similar to Armenians by Disability Age 5 to 17
In terms of disability age 5 to 17, the demographic groups most similar to Armenians are Immigrants from India (4.6%, a difference of 0.16%), Immigrants from Eastern Asia (4.6%, a difference of 0.23%), Iranian (4.6%, a difference of 0.24%), Indian (Asian) (4.6%, a difference of 0.56%), and Thai (4.7%, a difference of 1.3%).
| Demographics | Rating | Rank | Disability Age 5 to 17 |
| Filipinos | 100.0 /100 | #4 | Exceptional 4.3% |
| Immigrants | Iran | 100.0 /100 | #5 | Exceptional 4.4% |
| Immigrants | Israel | 100.0 /100 | #6 | Exceptional 4.5% |
| Immigrants | China | 100.0 /100 | #7 | Exceptional 4.5% |
| Indians (Asian) | 100.0 /100 | #8 | Exceptional 4.6% |
| Immigrants | Eastern Asia | 100.0 /100 | #9 | Exceptional 4.6% |
| Immigrants | India | 100.0 /100 | #10 | Exceptional 4.6% |
| Armenians | 100.0 /100 | #11 | Exceptional 4.6% |
| Iranians | 100.0 /100 | #12 | Exceptional 4.6% |
| Thais | 100.0 /100 | #13 | Exceptional 4.7% |
| Immigrants | Korea | 100.0 /100 | #14 | Exceptional 4.7% |
| Chinese | 100.0 /100 | #15 | Exceptional 4.7% |
| Immigrants | Singapore | 100.0 /100 | #16 | Exceptional 4.7% |
| Arapaho | 100.0 /100 | #17 | Exceptional 4.7% |
| Immigrants | South Central Asia | 100.0 /100 | #18 | Exceptional 4.7% |
Demographics Similar to German Russians by Disability Age 5 to 17
In terms of disability age 5 to 17, the demographic groups most similar to German Russians are West Indian (5.9%, a difference of 0.020%), Hungarian (5.8%, a difference of 0.10%), Immigrants from Caribbean (5.9%, a difference of 0.15%), Sudanese (5.8%, a difference of 0.20%), and Spaniard (5.9%, a difference of 0.23%).
| Demographics | Rating | Rank | Disability Age 5 to 17 |
| Immigrants | Laos | 3.8 /100 | #232 | Tragic 5.8% |
| Immigrants | West Indies | 3.5 /100 | #233 | Tragic 5.8% |
| Immigrants | Kenya | 3.4 /100 | #234 | Tragic 5.8% |
| Malaysians | 3.4 /100 | #235 | Tragic 5.8% |
| Immigrants | Brazil | 3.2 /100 | #236 | Tragic 5.8% |
| Sudanese | 2.9 /100 | #237 | Tragic 5.8% |
| Hungarians | 2.6 /100 | #238 | Tragic 5.8% |
| German Russians | 2.4 /100 | #239 | Tragic 5.9% |
| West Indians | 2.4 /100 | #240 | Tragic 5.9% |
| Immigrants | Caribbean | 2.1 /100 | #241 | Tragic 5.9% |
| Spaniards | 2.0 /100 | #242 | Tragic 5.9% |
| Indonesians | 2.0 /100 | #243 | Tragic 5.9% |
| Immigrants | Germany | 1.9 /100 | #244 | Tragic 5.9% |
| Immigrants | Micronesia | 1.9 /100 | #245 | Tragic 5.9% |
| Tlingit-Haida | 1.9 /100 | #246 | Tragic 5.9% |