Aleut vs Immigrants from Scotland Disability Age 5 to 17

COMPARE

Aleut
Race
Ancestry
AfghanAfricanAlaska NativeAlaskan AthabascanAlbanianAleutAlsatianAmericanApacheArabArapahoArgentineanArmenianAssyrian/Chaldean/SyriacAustralianAustrianBahamianBangladeshiBarbadianBasqueBelgianBelizeanBermudanBhutaneseBlackfeetBolivianBrazilianBritishBritish West IndianBulgarianBurmeseCajunCambodianCanadianCape VerdeanCarpatho RusynCelticCentral AmericanCentral American IndianCherokeeCheyenneChickasawChileanChineseChippewaChoctawColombianColvilleComancheCosta RicanCreeCreekCroatianCrowCubanCypriotCzechCzechoslovakianDanishDelawareDominicanDutchDutch West IndianEastern EuropeanEcuadorianEgyptianEnglishEstonianEthiopianEuropeanFijianFilipinoFinnishFrenchFrench American IndianFrench CanadianGermanGerman RussianGhanaianGreekGuamanian/ChamorroGuatemalanGuyaneseHaitianHmongHonduranHopiHoumaHungarianIcelanderIndian (Asian)IndonesianInupiatIranianIraqiIrishIroquoisIsraeliItalianJamaicanJapaneseJordanianKenyanKiowaKoreanLaotianLatvianLebaneseLiberianLithuanianLumbeeLuxembourgerMacedonianMalaysianMalteseMarshalleseMenomineeMexicanMexican American IndianMongolianMoroccanNative HawaiianNavajoNepaleseNew ZealanderNicaraguanNigerianNorthern EuropeanNorwegianOkinawanOsageOttawaPaiutePakistaniPalestinianPanamanianParaguayanPennsylvania GermanPeruvianPimaPolishPortuguesePotawatomiPuebloPuerto RicanPuget Sound SalishRomanianRussianSalvadoranSamoanScandinavianScotch-IrishScottishSeminoleSenegaleseSerbianShoshoneSierra LeoneanSiouxSlavicSlovakSloveneSomaliSouth AfricanSouth AmericanSouth American IndianSoviet UnionSpaniardSpanishSpanish AmericanSpanish American IndianSri LankanSubsaharan AfricanSudaneseSwedishSwissSyrianTaiwaneseThaiTlingit-HaidaTohono O'OdhamTonganTrinidadian and TobagonianTsimshianTurkishU.S. Virgin IslanderUgandanUkrainianUruguayanUteVenezuelanVietnameseWelshWest IndianYakamaYaquiYugoslavianYumanYup'ikZimbabwean
Immigration
NonimmigrantsImmigrantsAfghanistanAfricaAlbaniaArgentinaArmeniaAsiaAustraliaAustriaBahamasBangladeshBarbadosBelarusBelgiumBelizeBoliviaBosnia and HerzegovinaBrazilBulgariaBurma/MyanmarCabo VerdeCambodiaCameroonCanadaCaribbeanCentral AmericaChileChinaColombiaCongoCosta RicaCroatiaCubaCzechoslovakiaDenmarkDominicaDominican RepublicEastern AfricaEastern AsiaEastern EuropeEcuadorEgyptEl SalvadorEnglandEritreaEthiopiaEuropeFijiFranceGermanyGhanaGreeceGrenadaGuatemalaGuyanaHaitiHondurasHong KongHungaryIndiaIndonesiaIranIraqIrelandIsraelItalyJamaicaJapanJordanKazakhstanKenyaKoreaKuwaitLaosLatin AmericaLatviaLebanonLiberiaLithuaniaMalaysiaMexicoMicronesiaMiddle AfricaMoldovaMoroccoNepalNetherlandsNicaraguaNigeriaNorth AmericaNorth MacedoniaNorthern AfricaNorthern EuropeNorwayOceaniaPakistanPanamaPeruPhilippinesPolandPortugalRomaniaRussiaSaudi ArabiaSenegalSerbiaSierra LeoneSingaporeSomaliaSouth AfricaSouth AmericaSouth Central AsiaSouth Eastern AsiaSouthern EuropeSpainSri LankaSt. Vincent and the GrenadinesSudanSwedenSwitzerlandSyriaTaiwanThailandTrinidad and TobagoTurkeyUgandaUkraineUruguayUzbekistanVenezuelaVietnamWest IndiesWestern AfricaWestern AsiaWestern EuropeYemenZaireZimbabweAzores
Immigrants from Scotland
Race
Ancestry
AfghanAfricanAlaska NativeAlaskan AthabascanAlbanianAlsatianAmericanApacheArabArapahoArgentineanArmenianAssyrian/Chaldean/SyriacAustralianAustrianBahamianBangladeshiBarbadianBasqueBelgianBelizeanBermudanBhutaneseBlackfeetBolivianBrazilianBritishBritish West IndianBulgarianBurmeseCajunCambodianCanadianCape VerdeanCarpatho RusynCelticCentral AmericanCentral American IndianCherokeeCheyenneChickasawChileanChineseChippewaChoctawColombianColvilleComancheCosta RicanCreeCreekCroatianCrowCubanCypriotCzechCzechoslovakianDanishDelawareDominicanDutchDutch West IndianEastern EuropeanEcuadorianEgyptianEnglishEstonianEthiopianEuropeanFijianFilipinoFinnishFrenchFrench American IndianFrench CanadianGermanGerman RussianGhanaianGreekGuamanian/ChamorroGuatemalanGuyaneseHaitianHmongHonduranHopiHoumaHungarianIcelanderIndian (Asian)IndonesianInupiatIranianIraqiIrishIroquoisIsraeliItalianJamaicanJapaneseJordanianKenyanKiowaKoreanLaotianLatvianLebaneseLiberianLithuanianLumbeeLuxembourgerMacedonianMalaysianMalteseMarshalleseMenomineeMexicanMexican American IndianMongolianMoroccanNative HawaiianNavajoNepaleseNew ZealanderNicaraguanNigerianNorthern EuropeanNorwegianOkinawanOsageOttawaPaiutePakistaniPalestinianPanamanianParaguayanPennsylvania GermanPeruvianPimaPolishPortuguesePotawatomiPuebloPuerto RicanPuget Sound SalishRomanianRussianSalvadoranSamoanScandinavianScotch-IrishScottishSeminoleSenegaleseSerbianShoshoneSierra LeoneanSiouxSlavicSlovakSloveneSomaliSouth AfricanSouth AmericanSouth American IndianSoviet UnionSpaniardSpanishSpanish AmericanSpanish American IndianSri LankanSubsaharan AfricanSudaneseSwedishSwissSyrianTaiwaneseThaiTlingit-HaidaTohono O'OdhamTonganTrinidadian and TobagonianTsimshianTurkishU.S. Virgin IslanderUgandanUkrainianUruguayanUteVenezuelanVietnameseWelshWest IndianYakamaYaquiYugoslavianYumanYup'ikZimbabwean
Immigration
NonimmigrantsImmigrantsAfghanistanAfricaAlbaniaArgentinaArmeniaAsiaAustraliaAustriaBahamasBangladeshBarbadosBelarusBelgiumBelizeBoliviaBosnia and HerzegovinaBrazilBulgariaBurma/MyanmarCabo VerdeCambodiaCameroonCanadaCaribbeanCentral AmericaChileChinaColombiaCongoCosta RicaCroatiaCubaCzechoslovakiaDenmarkDominicaDominican RepublicEastern AfricaEastern AsiaEastern EuropeEcuadorEgyptEl SalvadorEnglandEritreaEthiopiaEuropeFijiFranceGermanyGhanaGreeceGrenadaGuatemalaGuyanaHaitiHondurasHong KongHungaryIndiaIndonesiaIranIraqIrelandIsraelItalyJamaicaJapanJordanKazakhstanKenyaKoreaKuwaitLaosLatin AmericaLatviaLebanonLiberiaLithuaniaMalaysiaMexicoMicronesiaMiddle AfricaMoldovaMoroccoNepalNetherlandsNicaraguaNigeriaNorth AmericaNorth MacedoniaNorthern AfricaNorthern EuropeNorwayOceaniaPakistanPanamaPeruPhilippinesPolandPortugalRomaniaRussiaSaudi ArabiaScotlandSenegalSerbiaSierra LeoneSingaporeSomaliaSouth AfricaSouth AmericaSouth Central AsiaSouth Eastern AsiaSouthern EuropeSpainSri LankaSt. Vincent and the GrenadinesSudanSwedenSwitzerlandSyriaTaiwanThailandTrinidad and TobagoTurkeyUgandaUkraineUruguayUzbekistanVenezuelaVietnamWest IndiesWestern AfricaWestern AsiaWestern EuropeYemenZaireZimbabweAzores
Disability Age 5 to 17
Income
Poverty
Unemployment
Labor Participation
Family Structure
Vehicle Availability
Education Level
Disability

Disability Age 5 to 17 Comparison

Aleuts

Immigrants from Scotland

Exceptional
Good
5.3%
DISABILITY AGE 5 TO 17
97.8/ 100
METRIC RATING
113th/ 347
METRIC RANK
5.6%
DISABILITY AGE 5 TO 17
61.9/ 100
METRIC RATING
164th/ 347
METRIC RANK

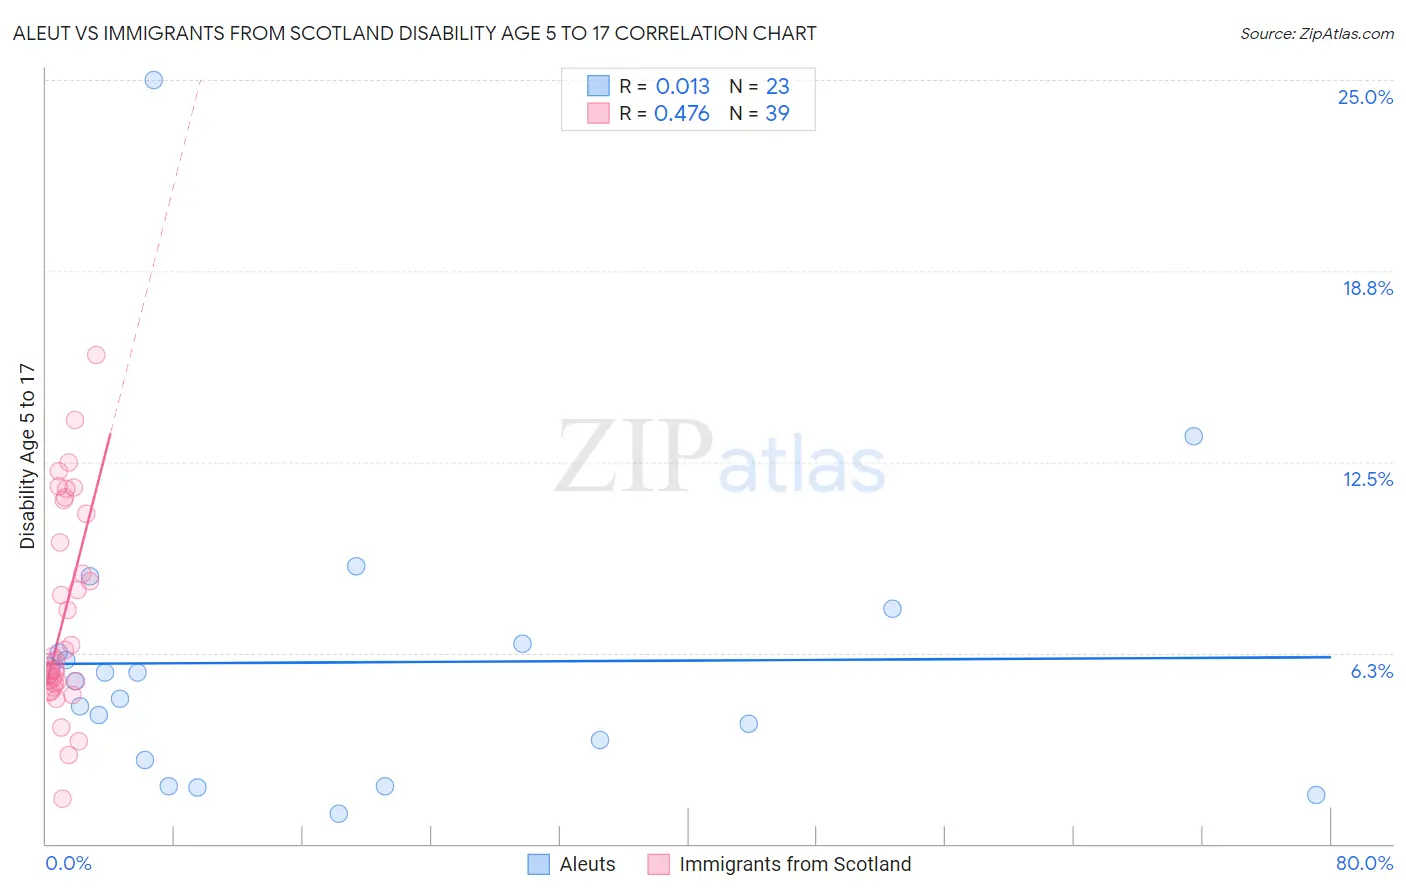
Aleut vs Immigrants from Scotland Disability Age 5 to 17 Correlation Chart

The statistical analysis conducted on geographies consisting of 61,654,039 people shows no correlation between the proportion of Aleuts and percentage of population with a disability between the ages 5 and 17 in the United States with a correlation coefficient (R) of 0.013 and weighted average of 5.3%. Similarly, the statistical analysis conducted on geographies consisting of 195,273,569 people shows a moderate positive correlation between the proportion of Immigrants from Scotland and percentage of population with a disability between the ages 5 and 17 in the United States with a correlation coefficient (R) of 0.476 and weighted average of 5.6%, a difference of 4.3%.
Aleut vs Immigrants from Scotland Disability Age 5 to 17

Disability Age 5 to 17 Correlation Summary

MeasurementAleutImmigrants from Scotland
Minimum0.99%1.5%
Maximum25.0%16.0%
Range24.0%14.5%
Mean5.9%7.4%
Median5.3%6.0%
Interquartile 25% (IQ1)2.7%5.2%
Interquartile 75% (IQ3)6.6%10.8%
Interquartile Range (IQR)3.8%5.6%
Standard Deviation (Sample)5.0%3.4%
Standard Deviation (Population)4.9%3.3%

Similar Demographics by Disability Age 5 to 17

Demographics Similar to Aleuts by Disability Age 5 to 17

In terms of disability age 5 to 17, the demographic groups most similar to Aleuts are Immigrants from Northern Europe (5.3%, a difference of 0.020%), Immigrants from Latvia (5.3%, a difference of 0.040%), Cuban (5.3%, a difference of 0.040%), Ethiopian (5.3%, a difference of 0.060%), and Immigrants from Eritrea (5.3%, a difference of 0.10%).
DemographicsRating | RankDisability Age 5 to 17
Immigrants | Yemen
98.2
/100
|
#106
Exceptional
5.3%
Russians
98.2
/100
|
#107
Exceptional
5.3%
Immigrants | South Africa
98.1
/100
|
#108
Exceptional
5.3%
Immigrants | Northern Africa
98.1
/100
|
#109
Exceptional
5.3%
Immigrants | Eritrea
98.0
/100
|
#110
Exceptional
5.3%
Ethiopians
97.9
/100
|
#111
Exceptional
5.3%
Immigrants | Latvia
97.9
/100
|
#112
Exceptional
5.3%
Aleuts
97.8
/100
|
#113
Exceptional
5.3%
Immigrants | Northern Europe
97.8
/100
|
#114
Exceptional
5.3%
Cubans
97.8
/100
|
#115
Exceptional
5.3%
Cypriots
97.7
/100
|
#116
Exceptional
5.3%
Immigrants | Afghanistan
97.4
/100
|
#117
Exceptional
5.3%
South Americans
97.1
/100
|
#118
Exceptional
5.4%
Immigrants | South America
97.1
/100
|
#119
Exceptional
5.4%
Immigrants | Immigrants
97.0
/100
|
#120
Exceptional
5.4%

Demographics Similar to Immigrants from Scotland by Disability Age 5 to 17

In terms of disability age 5 to 17, the demographic groups most similar to Immigrants from Scotland are Lebanese (5.6%, a difference of 0.030%), Greek (5.6%, a difference of 0.070%), Immigrants from Southern Europe (5.6%, a difference of 0.11%), Immigrants from Burma/Myanmar (5.6%, a difference of 0.13%), and Zimbabwean (5.5%, a difference of 0.29%).
DemographicsRating | RankDisability Age 5 to 17
Immigrants | Costa Rica
77.9
/100
|
#157
Good
5.5%
Immigrants | Nepal
77.1
/100
|
#158
Good
5.5%
Immigrants | Zimbabwe
75.3
/100
|
#159
Good
5.5%
South Africans
73.3
/100
|
#160
Good
5.5%
Immigrants | Saudi Arabia
69.1
/100
|
#161
Good
5.5%
Zimbabweans
67.2
/100
|
#162
Good
5.5%
Immigrants | Southern Europe
64.0
/100
|
#163
Good
5.6%
Immigrants | Scotland
61.9
/100
|
#164
Good
5.6%
Lebanese
61.4
/100
|
#165
Good
5.6%
Greeks
60.6
/100
|
#166
Good
5.6%
Immigrants | Burma/Myanmar
59.3
/100
|
#167
Average
5.6%
Iraqis
56.0
/100
|
#168
Average
5.6%
Immigrants | Norway
55.7
/100
|
#169
Average
5.6%
Serbians
54.0
/100
|
#170
Average
5.6%
Immigrants | Iraq
53.9
/100
|
#171
Average
5.6%