Zip Codes with the Highest Percentage of Population Employed in Firefighting & Prevention in Birmingham, AL
RELATED REPORTS & OPTIONS
Firefighting & Prevention
Birmingham
Compare Zip Codes
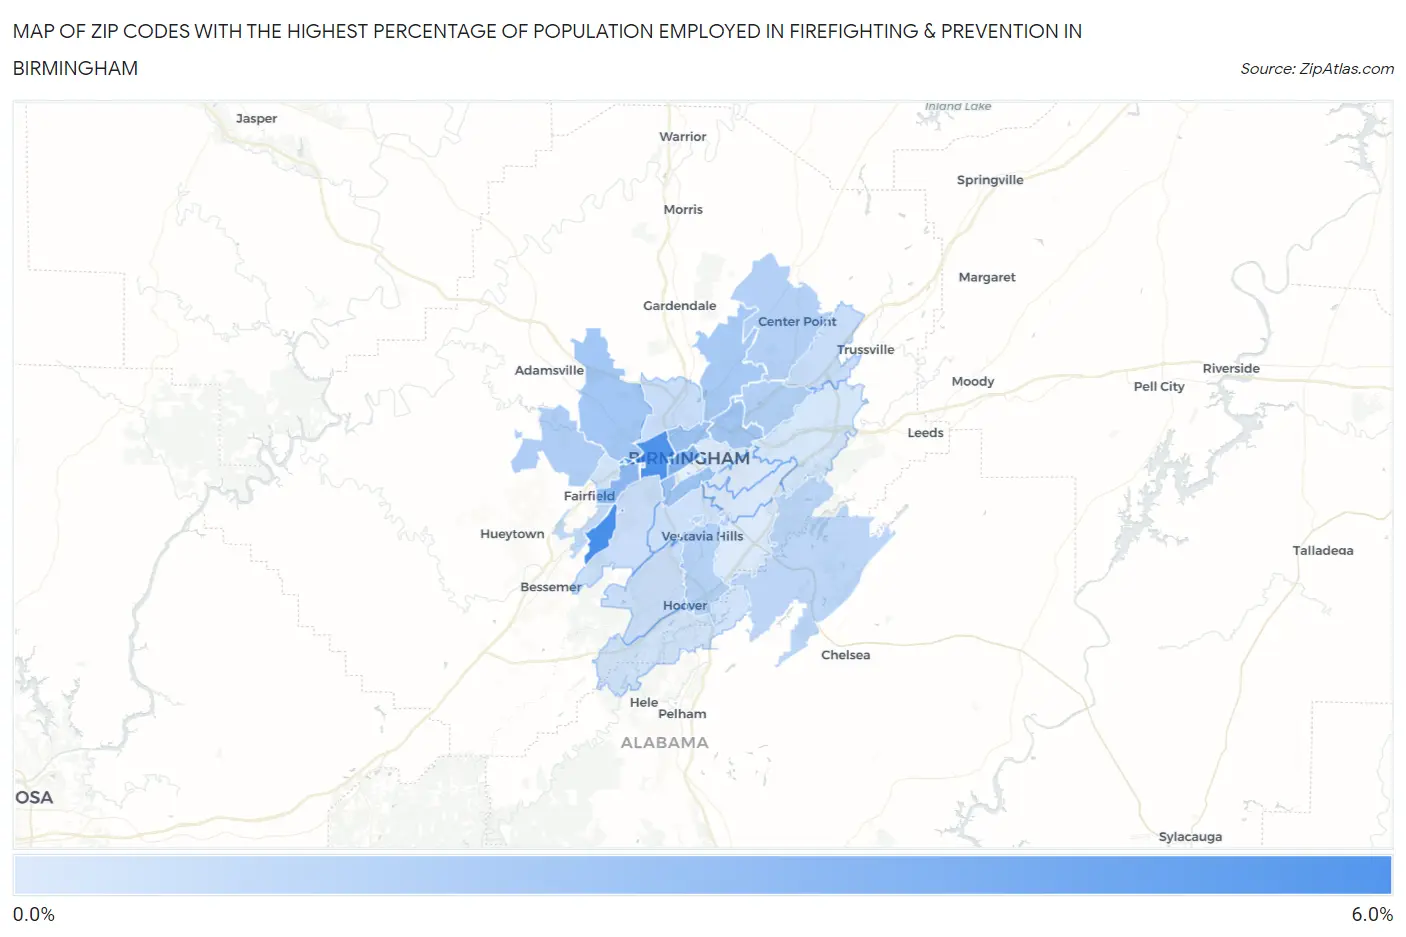
Map of Zip Codes with the Highest Percentage of Population Employed in Firefighting & Prevention in Birmingham
0.20%
5.6%
Zip Codes with the Highest Percentage of Population Employed in Firefighting & Prevention in Birmingham, AL
| Zip Code | % Employed | vs State | vs National | |
| 1. | 35221 | 5.6% | 1.2%(+4.33)#30 | 1.2%(+4.38)#756 |
| 2. | 35204 | 5.2% | 1.2%(+3.95)#31 | 1.2%(+4.00)#839 |
| 3. | 35203 | 3.4% | 1.2%(+2.19)#50 | 1.2%(+2.23)#1,795 |
| 4. | 35208 | 3.0% | 1.2%(+1.75)#59 | 1.2%(+1.79)#2,272 |
| 5. | 35234 | 2.4% | 1.2%(+1.20)#80 | 1.2%(+1.24)#3,262 |
| 6. | 35205 | 2.4% | 1.2%(+1.14)#82 | 1.2%(+1.19)#3,393 |
| 7. | 35214 | 2.3% | 1.2%(+1.04)#91 | 1.2%(+1.08)#3,654 |
| 8. | 35212 | 2.2% | 1.2%(+0.968)#98 | 1.2%(+1.02)#3,859 |
| 9. | 35217 | 2.0% | 1.2%(+0.808)#106 | 1.2%(+0.855)#4,363 |
| 10. | 35224 | 1.8% | 1.2%(+0.564)#131 | 1.2%(+0.611)#5,371 |
| 11. | 35215 | 1.6% | 1.2%(+0.413)#145 | 1.2%(+0.460)#6,127 |
| 12. | 35206 | 1.6% | 1.2%(+0.405)#147 | 1.2%(+0.452)#6,174 |
| 13. | 35216 | 1.5% | 1.2%(+0.308)#158 | 1.2%(+0.355)#6,709 |
| 14. | 35242 | 1.3% | 1.2%(+0.067)#196 | 1.2%(+0.114)#8,353 |
| 15. | 35254 | 1.3% | 1.2%(+0.022)#206 | 1.2%(+0.069)#8,704 |
| 16. | 35229 | 1.2% | 1.2%(-0.081)#229 | 1.2%(-0.033)#9,595 |
| 17. | 35228 | 1.1% | 1.2%(-0.123)#237 | 1.2%(-0.076)#10,017 |
| 18. | 35207 | 0.97% | 1.2%(-0.267)#259 | 1.2%(-0.220)#11,463 |
| 19. | 35235 | 0.94% | 1.2%(-0.289)#267 | 1.2%(-0.241)#11,700 |
| 20. | 35226 | 0.88% | 1.2%(-0.352)#281 | 1.2%(-0.304)#12,354 |
| 21. | 35211 | 0.85% | 1.2%(-0.383)#285 | 1.2%(-0.335)#12,665 |
| 22. | 35209 | 0.78% | 1.2%(-0.457)#302 | 1.2%(-0.410)#13,476 |
| 23. | 35244 | 0.63% | 1.2%(-0.605)#343 | 1.2%(-0.557)#15,117 |
| 24. | 35218 | 0.54% | 1.2%(-0.694)#358 | 1.2%(-0.647)#16,082 |
| 25. | 35210 | 0.44% | 1.2%(-0.797)#376 | 1.2%(-0.750)#17,262 |
| 26. | 35223 | 0.39% | 1.2%(-0.841)#382 | 1.2%(-0.794)#17,742 |
| 27. | 35213 | 0.28% | 1.2%(-0.949)#400 | 1.2%(-0.902)#18,920 |
| 28. | 35222 | 0.26% | 1.2%(-0.970)#402 | 1.2%(-0.923)#19,127 |
| 29. | 35243 | 0.20% | 1.2%(-1.03)#409 | 1.2%(-0.984)#19,667 |
1
Common Questions
What are the Top 10 Zip Codes with the Highest Percentage of Population Employed in Firefighting & Prevention in Birmingham, AL?
Top 10 Zip Codes with the Highest Percentage of Population Employed in Firefighting & Prevention in Birmingham, AL are:
What zip code has the Highest Percentage of Population Employed in Firefighting & Prevention in Birmingham, AL?
35221 has the Highest Percentage of Population Employed in Firefighting & Prevention in Birmingham, AL with 5.6%.
What is the Percentage of Population Employed in Firefighting & Prevention in Birmingham, AL?
Percentage of Population Employed in Firefighting & Prevention in Birmingham is 1.7%.
What is the Percentage of Population Employed in Firefighting & Prevention in Alabama?
Percentage of Population Employed in Firefighting & Prevention in Alabama is 1.2%.
What is the Percentage of Population Employed in Firefighting & Prevention in the United States?
Percentage of Population Employed in Firefighting & Prevention in the United States is 1.2%.