Zip Codes with the Highest Percentage of Population Employed in Life, Physical & Social Science in Washington
RELATED REPORTS & OPTIONS
Life, Physical & Social Science
Washington
Compare Zip Codes
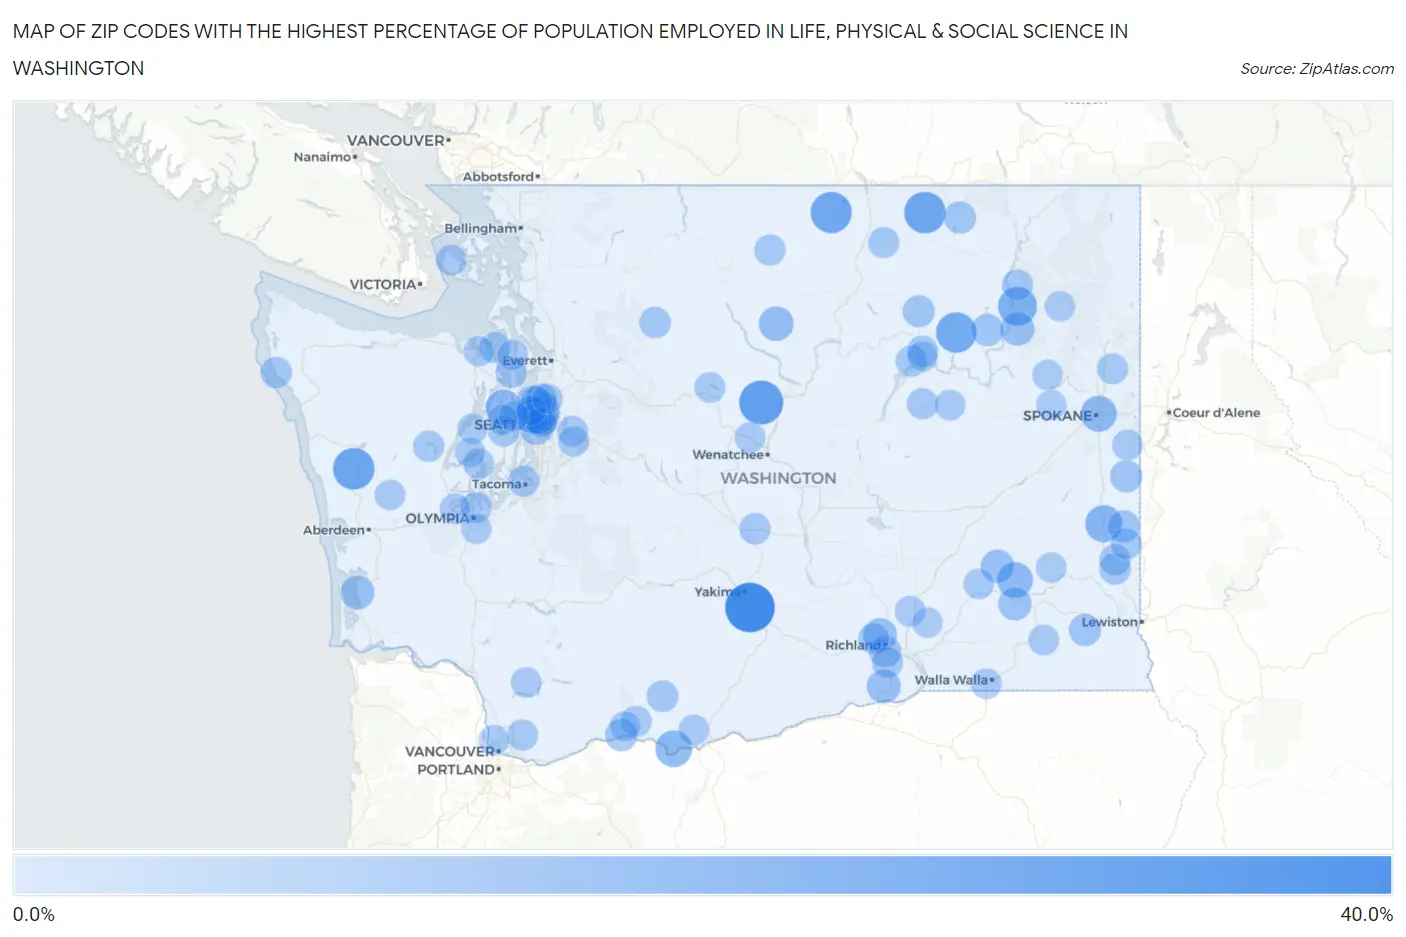
Map of Zip Codes with the Highest Percentage of Population Employed in Life, Physical & Social Science in Washington
0.0%
40.0%
Zip Codes with the Highest Percentage of Population Employed in Life, Physical & Social Science in Washington
| Zip Code | % Employed | vs State | vs National | |
| 1. | 98939 | 35.5% | 1.3%(+34.2)#1 | 1.1%(+34.4)#19 |
| 2. | 98811 | 25.6% | 1.3%(+24.3)#2 | 1.1%(+24.6)#40 |
| 3. | 98859 | 21.4% | 1.3%(+20.1)#3 | 1.1%(+20.3)#53 |
| 4. | 98552 | 21.4% | 1.3%(+20.1)#4 | 1.1%(+20.3)#54 |
| 5. | 98827 | 20.8% | 1.3%(+19.5)#5 | 1.1%(+19.7)#56 |
| 6. | 99140 | 19.4% | 1.3%(+18.1)#6 | 1.1%(+18.3)#68 |
| 7. | 99131 | 16.7% | 1.3%(+15.4)#7 | 1.1%(+15.6)#91 |
| 8. | 99174 | 13.3% | 1.3%(+12.0)#8 | 1.1%(+12.2)#128 |
| 9. | 98617 | 12.7% | 1.3%(+11.4)#9 | 1.1%(+11.6)#135 |
| 10. | 98345 | 11.7% | 1.3%(+10.4)#10 | 1.1%(+10.6)#149 |
| 11. | 99258 | 11.7% | 1.3%(+10.4)#11 | 1.1%(+10.6)#150 |
| 12. | 99333 | 11.3% | 1.3%(+10.0)#12 | 1.1%(+10.2)#160 |
| 13. | 98814 | 9.3% | 1.3%(+8.03)#13 | 1.1%(+8.25)#235 |
| 14. | 99137 | 8.2% | 1.3%(+6.92)#14 | 1.1%(+7.14)#309 |
| 15. | 99346 | 8.1% | 1.3%(+6.84)#15 | 1.1%(+7.06)#312 |
| 16. | 99354 | 8.1% | 1.3%(+6.78)#16 | 1.1%(+7.00)#316 |
| 17. | 98527 | 7.8% | 1.3%(+6.48)#17 | 1.1%(+6.70)#339 |
| 18. | 98195 | 7.8% | 1.3%(+6.47)#18 | 1.1%(+6.69)#341 |
| 19. | 99371 | 7.3% | 1.3%(+5.98)#19 | 1.1%(+6.20)#381 |
| 20. | 99359 | 7.0% | 1.3%(+5.71)#20 | 1.1%(+5.93)#404 |
| 21. | 99138 | 5.7% | 1.3%(+4.43)#21 | 1.1%(+4.65)#585 |
| 22. | 98134 | 5.6% | 1.3%(+4.32)#22 | 1.1%(+4.54)#606 |
| 23. | 99018 | 5.6% | 1.3%(+4.30)#23 | 1.1%(+4.52)#607 |
| 24. | 98651 | 5.6% | 1.3%(+4.26)#24 | 1.1%(+4.48)#612 |
| 25. | 98115 | 5.5% | 1.3%(+4.18)#25 | 1.1%(+4.40)#629 |
| 26. | 99130 | 5.4% | 1.3%(+4.08)#26 | 1.1%(+4.30)#656 |
| 27. | 99150 | 5.3% | 1.3%(+4.02)#27 | 1.1%(+4.24)#674 |
| 28. | 99347 | 5.3% | 1.3%(+3.98)#28 | 1.1%(+4.20)#688 |
| 29. | 99155 | 5.3% | 1.3%(+3.97)#29 | 1.1%(+4.19)#690 |
| 30. | 99352 | 4.9% | 1.3%(+3.64)#30 | 1.1%(+3.86)#775 |
| 31. | 98199 | 4.6% | 1.3%(+3.33)#31 | 1.1%(+3.55)#870 |
| 32. | 98619 | 4.4% | 1.3%(+3.12)#32 | 1.1%(+3.34)#955 |
| 33. | 99163 | 4.4% | 1.3%(+3.07)#33 | 1.1%(+3.29)#973 |
| 34. | 98241 | 4.4% | 1.3%(+3.06)#34 | 1.1%(+3.28)#977 |
| 35. | 98177 | 4.2% | 1.3%(+2.84)#35 | 1.1%(+3.06)#1,073 |
| 36. | 98350 | 4.0% | 1.3%(+2.73)#36 | 1.1%(+2.95)#1,129 |
| 37. | 99102 | 4.0% | 1.3%(+2.70)#37 | 1.1%(+2.92)#1,142 |
| 38. | 98105 | 4.0% | 1.3%(+2.69)#38 | 1.1%(+2.91)#1,149 |
| 39. | 98934 | 3.9% | 1.3%(+2.54)#39 | 1.1%(+2.76)#1,230 |
| 40. | 98403 | 3.8% | 1.3%(+2.51)#40 | 1.1%(+2.73)#1,250 |
| 41. | 98358 | 3.8% | 1.3%(+2.49)#41 | 1.1%(+2.71)#1,264 |
| 42. | 98862 | 3.8% | 1.3%(+2.44)#42 | 1.1%(+2.66)#1,290 |
| 43. | 98548 | 3.7% | 1.3%(+2.41)#43 | 1.1%(+2.63)#1,303 |
| 44. | 99133 | 3.6% | 1.3%(+2.34)#44 | 1.1%(+2.56)#1,347 |
| 45. | 99103 | 3.6% | 1.3%(+2.30)#45 | 1.1%(+2.52)#1,361 |
| 46. | 98103 | 3.6% | 1.3%(+2.26)#46 | 1.1%(+2.48)#1,384 |
| 47. | 98337 | 3.5% | 1.3%(+2.21)#47 | 1.1%(+2.43)#1,412 |
| 48. | 99116 | 3.5% | 1.3%(+2.19)#48 | 1.1%(+2.41)#1,424 |
| 49. | 99161 | 3.5% | 1.3%(+2.19)#49 | 1.1%(+2.41)#1,426 |
| 50. | 99003 | 3.4% | 1.3%(+2.12)#50 | 1.1%(+2.34)#1,471 |
| 51. | 99353 | 3.4% | 1.3%(+2.12)#51 | 1.1%(+2.34)#1,481 |
| 52. | 99167 | 3.4% | 1.3%(+2.11)#52 | 1.1%(+2.33)#1,489 |
| 53. | 98855 | 3.4% | 1.3%(+2.11)#53 | 1.1%(+2.33)#1,492 |
| 54. | 98340 | 3.4% | 1.3%(+2.07)#54 | 1.1%(+2.29)#1,512 |
| 55. | 99338 | 3.4% | 1.3%(+2.05)#55 | 1.1%(+2.27)#1,525 |
| 56. | 98102 | 3.4% | 1.3%(+2.05)#56 | 1.1%(+2.27)#1,528 |
| 57. | 98125 | 3.2% | 1.3%(+1.93)#57 | 1.1%(+2.15)#1,629 |
| 58. | 98109 | 3.2% | 1.3%(+1.90)#58 | 1.1%(+2.12)#1,662 |
| 59. | 98606 | 3.2% | 1.3%(+1.85)#59 | 1.1%(+2.07)#1,694 |
| 60. | 98506 | 3.1% | 1.3%(+1.79)#60 | 1.1%(+2.01)#1,759 |
| 61. | 98107 | 3.1% | 1.3%(+1.78)#61 | 1.1%(+2.00)#1,771 |
| 62. | 98672 | 3.1% | 1.3%(+1.76)#62 | 1.1%(+1.98)#1,794 |
| 63. | 99328 | 3.1% | 1.3%(+1.74)#63 | 1.1%(+1.96)#1,818 |
| 64. | 98112 | 3.0% | 1.3%(+1.67)#64 | 1.1%(+1.89)#1,901 |
| 65. | 98155 | 3.0% | 1.3%(+1.67)#65 | 1.1%(+1.89)#1,905 |
| 66. | 98826 | 3.0% | 1.3%(+1.66)#66 | 1.1%(+1.88)#1,913 |
| 67. | 98029 | 2.9% | 1.3%(+1.64)#67 | 1.1%(+1.86)#1,935 |
| 68. | 98027 | 2.9% | 1.3%(+1.61)#68 | 1.1%(+1.83)#1,967 |
| 69. | 99330 | 2.9% | 1.3%(+1.60)#69 | 1.1%(+1.82)#1,982 |
| 70. | 99324 | 2.9% | 1.3%(+1.58)#70 | 1.1%(+1.80)#2,001 |
| 71. | 98502 | 2.9% | 1.3%(+1.56)#71 | 1.1%(+1.78)#2,025 |
| 72. | 99185 | 2.8% | 1.3%(+1.51)#72 | 1.1%(+1.73)#2,095 |
| 73. | 99030 | 2.8% | 1.3%(+1.51)#73 | 1.1%(+1.73)#2,097 |
| 74. | 98250 | 2.8% | 1.3%(+1.49)#74 | 1.1%(+1.71)#2,118 |
| 75. | 98133 | 2.7% | 1.3%(+1.43)#75 | 1.1%(+1.65)#2,194 |
| 76. | 98119 | 2.7% | 1.3%(+1.40)#76 | 1.1%(+1.62)#2,239 |
| 77. | 98311 | 2.7% | 1.3%(+1.37)#77 | 1.1%(+1.59)#2,276 |
| 78. | 98524 | 2.7% | 1.3%(+1.34)#78 | 1.1%(+1.56)#2,314 |
| 79. | 98613 | 2.6% | 1.3%(+1.30)#79 | 1.1%(+1.52)#2,373 |
| 80. | 98815 | 2.6% | 1.3%(+1.29)#80 | 1.1%(+1.51)#2,389 |
| 81. | 98603 | 2.6% | 1.3%(+1.29)#81 | 1.1%(+1.51)#2,397 |
| 82. | 98249 | 2.6% | 1.3%(+1.28)#82 | 1.1%(+1.50)#2,400 |
| 83. | 98368 | 2.6% | 1.3%(+1.28)#83 | 1.1%(+1.50)#2,421 |
| 84. | 99335 | 2.6% | 1.3%(+1.25)#84 | 1.1%(+1.47)#2,458 |
| 85. | 98122 | 2.5% | 1.3%(+1.23)#85 | 1.1%(+1.45)#2,505 |
| 86. | 98563 | 2.5% | 1.3%(+1.17)#86 | 1.1%(+1.39)#2,606 |
| 87. | 98501 | 2.5% | 1.3%(+1.15)#87 | 1.1%(+1.37)#2,636 |
| 88. | 99143 | 2.4% | 1.3%(+1.11)#88 | 1.1%(+1.33)#2,710 |
| 89. | 98117 | 2.4% | 1.3%(+1.11)#89 | 1.1%(+1.33)#2,723 |
| 90. | 99109 | 2.4% | 1.3%(+1.08)#90 | 1.1%(+1.30)#2,774 |
| 91. | 99013 | 2.4% | 1.3%(+1.05)#91 | 1.1%(+1.27)#2,815 |
| 92. | 98028 | 2.3% | 1.3%(+1.02)#92 | 1.1%(+1.24)#2,880 |
| 93. | 98660 | 2.3% | 1.3%(+0.968)#93 | 1.1%(+1.19)#2,997 |
| 94. | 99029 | 2.3% | 1.3%(+0.951)#94 | 1.1%(+1.17)#3,030 |
| 95. | 99301 | 2.3% | 1.3%(+0.949)#95 | 1.1%(+1.17)#3,035 |
| 96. | 98380 | 2.2% | 1.3%(+0.937)#96 | 1.1%(+1.16)#3,068 |
| 97. | 99124 | 2.2% | 1.3%(+0.863)#97 | 1.1%(+1.08)#3,241 |
| 98. | 98605 | 2.2% | 1.3%(+0.856)#98 | 1.1%(+1.08)#3,258 |
| 99. | 98528 | 2.1% | 1.3%(+0.815)#99 | 1.1%(+1.04)#3,357 |
| 100. | 98110 | 2.1% | 1.3%(+0.783)#100 | 1.1%(+1.00)#3,438 |
Common Questions
What are the Top 10 Zip Codes with the Highest Percentage of Population Employed in Life, Physical & Social Science in Washington?
Top 10 Zip Codes with the Highest Percentage of Population Employed in Life, Physical & Social Science in Washington are:
What zip code has the Highest Percentage of Population Employed in Life, Physical & Social Science in Washington?
98939 has the Highest Percentage of Population Employed in Life, Physical & Social Science in Washington with 35.5%.
What is the Percentage of Population Employed in Life, Physical & Social Science in the State of Washington?
Percentage of Population Employed in Life, Physical & Social Science in Washington is 1.3%.
What is the Percentage of Population Employed in Life, Physical & Social Science in the United States?
Percentage of Population Employed in Life, Physical & Social Science in the United States is 1.1%.