Zip Codes with the Highest Percentage of Population Employed in Life, Physical & Social Science in Wyoming

RELATED REPORTS & OPTIONS

Life, Physical & Social Science
Population
Families and Households
Female Fertility
Female Fertility (Unmarried)
Race (Community Size)
Race (Percentage)
Ancestry (Community Size)
AfghanAfricanAlaska NativeAlaskan AthabascanAlbanianAleutAlsatianAmericanApacheArabArapahoArgentineanArmenianAssyrian / Chaldean / SyriacAustralianAustrianBahamianBangladeshiBarbadianBasqueBelgianBelizeanBermudanBhutaneseBlackfeetBolivianBrazilianBritishBritish West IndianBulgarianBurmeseCajunCambodianCanadianCape VerdeanCarpatho RusynCelticCentral AmericanCentral American IndianCherokeeCheyenneChickasawChileanChineseChippewaChoctawColombianColvilleComancheCosta RicanCreeCreekCroatianCrowCubanCypriotCzechCzechoslovakianDanishDelawareDominicanDutchDutch West IndianEastern EuropeanEcuadorianEgyptianEnglishEstonianEthiopianEuropeanFijianFilipinoFinnishFrenchFrench American IndianFrench CanadianGermanGerman RussianGhanaianGreekGuamanian / ChamorroGuatemalanGuyaneseHaitianHmongHonduranHopiHoumaHungarianIcelanderIndian (Asian)IndonesianInupiatIranianIraqiIrishIroquoisIsraeliItalianJamaicanJapaneseJordanianKenyanKiowaKoreanLaotianLatvianLebaneseLiberianLithuanianLumbeeLuxembourgerMacedonianMalaysianMalteseMarshalleseMenomineeMexicanMexican American IndianMongolianMoroccanNative HawaiianNavajoNepaleseNew ZealanderNicaraguanNigerianNorthern EuropeanNorwegianOkinawanOsageOttawaPaiutePakistaniPalestinianPanamanianParaguayanPennsylvania GermanPeruvianPimaPolishPortuguesePotawatomiPuebloPuerto RicanPuget Sound SalishRomanianRussianSalvadoranSamoanScandinavianScotch-IrishScottishSeminoleSenegaleseSerbianShoshoneSierra LeoneanSiouxSlavicSlovakSloveneSomaliSouth AfricanSouth AmericanSouth American IndianSoviet UnionSpaniardSpanishSpanish AmericanSpanish American IndianSri LankanSubsaharan AfricanSudaneseSwedishSwissSyrianTaiwaneseThaiTlingit-HaidaTohono O'OdhamTonganTrinidadian and TobagonianTsimshianTurkishU.S. Virgin IslanderUgandanUkrainianUruguayanUteVenezuelanVietnameseWelshWest IndianYakamaYaquiYugoslavianYumanYup'ikZimbabwean
Ancestry (Percentage)
AfghanAfricanAlaska NativeAlaskan AthabascanAlbanianAleutAlsatianAmericanApacheArabArapahoArgentineanArmenianAssyrian / Chaldean / SyriacAustralianAustrianBahamianBangladeshiBarbadianBasqueBelgianBelizeanBermudanBhutaneseBlackfeetBolivianBrazilianBritishBritish West IndianBulgarianBurmeseCajunCambodianCanadianCape VerdeanCarpatho RusynCelticCentral AmericanCentral American IndianCherokeeCheyenneChickasawChileanChineseChippewaChoctawColombianColvilleComancheCosta RicanCreeCreekCroatianCrowCubanCypriotCzechCzechoslovakianDanishDelawareDominicanDutchDutch West IndianEastern EuropeanEcuadorianEgyptianEnglishEstonianEthiopianEuropeanFijianFilipinoFinnishFrenchFrench American IndianFrench CanadianGermanGerman RussianGhanaianGreekGuamanian / ChamorroGuatemalanGuyaneseHaitianHmongHonduranHopiHoumaHungarianIcelanderIndian (Asian)IndonesianInupiatIranianIraqiIrishIroquoisIsraeliItalianJamaicanJapaneseJordanianKenyanKiowaKoreanLaotianLatvianLebaneseLiberianLithuanianLumbeeLuxembourgerMacedonianMalaysianMalteseMarshalleseMenomineeMexicanMexican American IndianMongolianMoroccanNative HawaiianNavajoNepaleseNew ZealanderNicaraguanNigerianNorthern EuropeanNorwegianOkinawanOsageOttawaPaiutePakistaniPalestinianPanamanianParaguayanPennsylvania GermanPeruvianPimaPolishPortuguesePotawatomiPuebloPuerto RicanPuget Sound SalishRomanianRussianSalvadoranSamoanScandinavianScotch-IrishScottishSeminoleSenegaleseSerbianShoshoneSierra LeoneanSiouxSlavicSlovakSloveneSomaliSouth AfricanSouth AmericanSouth American IndianSoviet UnionSpaniardSpanishSpanish AmericanSpanish American IndianSri LankanSubsaharan AfricanSudaneseSwedishSwissSyrianTaiwaneseThaiTlingit-HaidaTohono O'OdhamTonganTrinidadian and TobagonianTsimshianTurkishU.S. Virgin IslanderUgandanUkrainianUruguayanUteVenezuelanVietnameseWelshWest IndianYakamaYaquiYugoslavianYumanYup'ikZimbabwean
Immigrant Origin (Total)
AfghanistanAfricaAlbaniaArgentinaArmeniaAsiaAustraliaAustriaAzoresBahamasBangladeshBarbadosBelarusBelgiumBelizeBoliviaBosnia and HerzegovinaBrazilBulgariaBurma / MyanmarCabo VerdeCambodiaCameroonCanadaCaribbeanCentral AmericaChileChinaColombiaCongoCosta RicaCroatiaCubaCzechoslovakiaDenmarkDominicaDominican RepublicEastern AfricaEastern AsiaEastern EuropeEcuadorEgyptEl SalvadorEnglandEritreaEthiopiaEuropeFijiFranceGermanyGhanaGreeceGrenadaGuatemalaGuyanaHaitiHondurasHong KongHungaryIndiaIndonesiaIranIraqIrelandIsraelItalyJamaicaJapanJordanKazakhstanKenyaKoreaKuwaitLaosLatin AmericaLatviaLebanonLiberiaLithuaniaMalaysiaMexicoMicronesiaMiddle AfricaMoldovaMoroccoNepalNetherlandsNicaraguaNigeriaNorth MacedoniaNorthern AfricaNorthern EuropeNorwayOceaniaPakistanPanamaPeruPhilippinesPolandPortugalRomaniaRussiaSaudi ArabiaScotlandSenegalSerbiaSierra LeoneSingaporeSomaliaSouth AfricaSouth AmericaSouth Central AsiaSouth Eastern AsiaSouthern EuropeSpainSri LankaSt. Vincent and the GrenadinesSudanSwedenSwitzerlandSyriaTaiwanThailandTrinidad and TobagoTurkeyUgandaUkraineUruguayUzbekistanVenezuelaVietnamWest IndiesWestern AfricaWestern AsiaWestern EuropeYemenZaireZimbabwe
Immigrant Origin (Percentage)
AfghanistanAfricaAlbaniaArgentinaArmeniaAsiaAustraliaAustriaAzoresBahamasBangladeshBarbadosBelarusBelgiumBelizeBoliviaBosnia and HerzegovinaBrazilBulgariaBurma / MyanmarCabo VerdeCambodiaCameroonCanadaCaribbeanCentral AmericaChileChinaColombiaCongoCosta RicaCroatiaCubaCzechoslovakiaDenmarkDominicaDominican RepublicEastern AfricaEastern AsiaEastern EuropeEcuadorEgyptEl SalvadorEnglandEritreaEthiopiaEuropeFijiFranceGermanyGhanaGreeceGrenadaGuatemalaGuyanaHaitiHondurasHong KongHungaryIndiaIndonesiaIranIraqIrelandIsraelItalyJamaicaJapanJordanKazakhstanKenyaKoreaKuwaitLaosLatin AmericaLatviaLebanonLiberiaLithuaniaMalaysiaMexicoMicronesiaMiddle AfricaMoldovaMoroccoNepalNetherlandsNicaraguaNigeriaNorth MacedoniaNorthern AfricaNorthern EuropeNorwayOceaniaPakistanPanamaPeruPhilippinesPolandPortugalRomaniaRussiaSaudi ArabiaScotlandSenegalSerbiaSierra LeoneSingaporeSomaliaSouth AfricaSouth AmericaSouth Central AsiaSouth Eastern AsiaSouthern EuropeSpainSri LankaSt. Vincent and the GrenadinesSudanSwedenSwitzerlandSyriaTaiwanThailandTrinidad and TobagoTurkeyUgandaUkraineUruguayUzbekistanVenezuelaVietnamWest IndiesWestern AfricaWestern AsiaWestern EuropeYemenZaireZimbabwe
Income
Income (Families)
Income (Households)
Poverty
Poverty (Families)
Unemployment
Employment Occupations
Employment Industries
Employer Class
Commute Time
Commute Means
School Enrollment
Education by Degree Field
Occupancy
Finances
Physical Characteristics
Wyoming
Compare Zip Codes
Comparison Subject

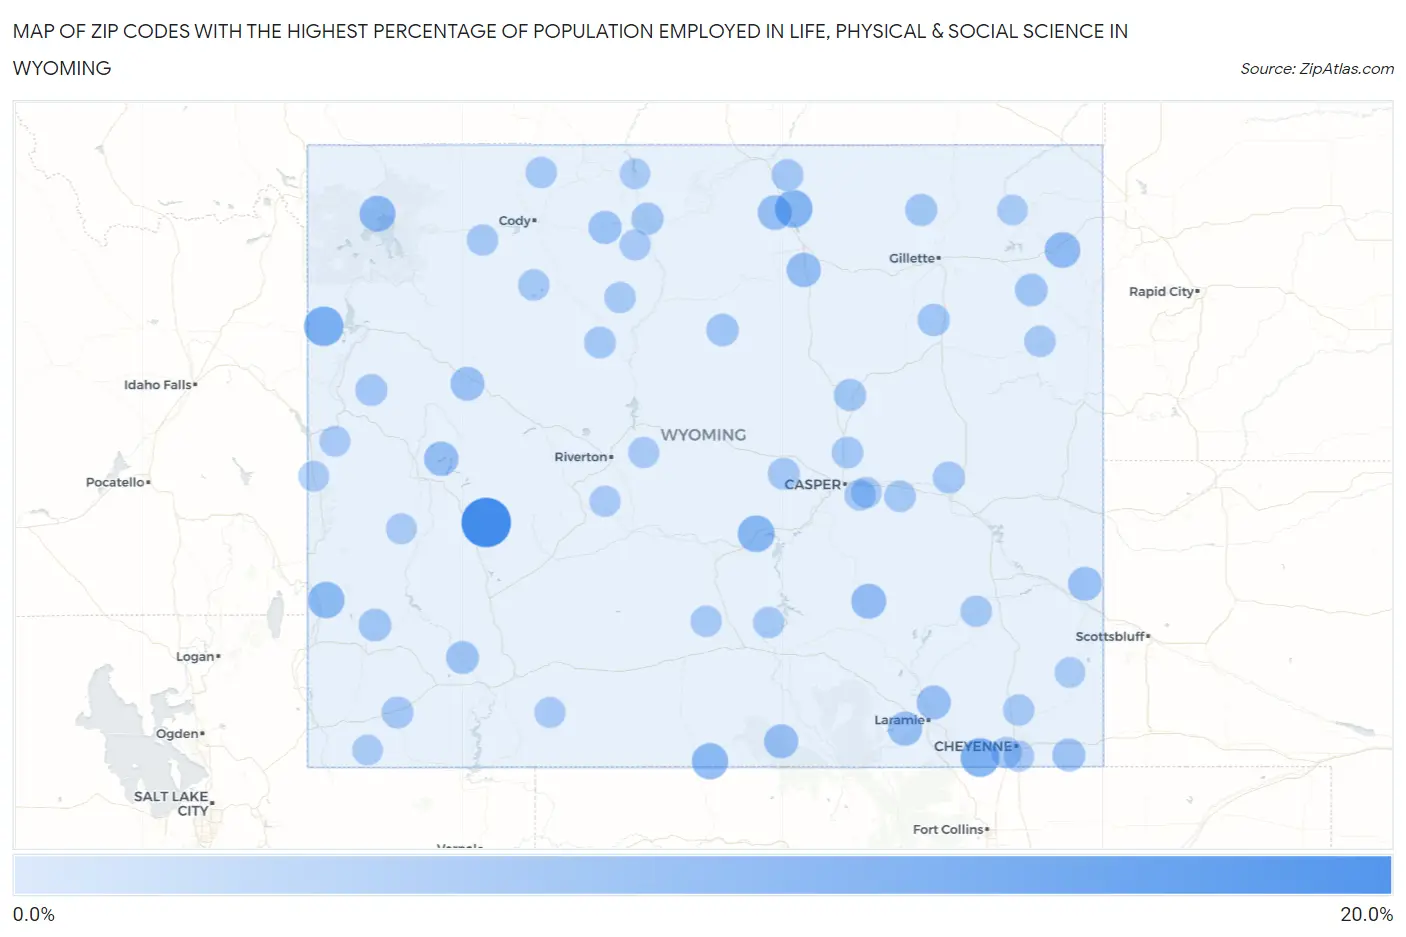
Map of Zip Codes with the Highest Percentage of Population Employed in Life, Physical & Social Science in Wyoming

0.0%
20.0%
Zip Codes with the Highest Percentage of Population Employed in Life, Physical & Social Science in Wyoming Map

Zip Codes with the Highest Percentage of Population Employed in Life, Physical & Social Science in Wyoming

Zip Code % Employed vs State vs National
1.8292318.4%1.4%(+17.0)#11.1%(+17.3)#73
2.834148.5%1.4%(+7.18)#21.1%(+7.45)#280
3.820598.0%1.4%(+6.64)#31.1%(+6.91)#321
4.828326.8%1.4%(+5.43)#41.1%(+5.70)#430
5.826206.1%1.4%(+4.72)#51.1%(+4.99)#536
6.831145.7%1.4%(+4.30)#61.1%(+4.56)#599
7.823235.6%1.4%(+4.20)#71.1%(+4.46)#613
8.821905.3%1.4%(+3.98)#81.1%(+4.25)#671
9.827295.0%1.4%(+3.65)#91.1%(+3.92)#757
10.823294.4%1.4%(+3.02)#101.1%(+3.28)#975
11.828424.0%1.4%(+2.67)#111.1%(+2.93)#1,137
12.828343.8%1.4%(+2.39)#121.1%(+2.66)#1,291
13.829413.7%1.4%(+2.39)#131.1%(+2.66)#1,293
14.820723.6%1.4%(+2.20)#141.1%(+2.47)#1,387
15.823253.5%1.4%(+2.17)#151.1%(+2.44)#1,405
16.820703.5%1.4%(+2.15)#161.1%(+2.42)#1,419
17.825133.3%1.4%(+1.93)#171.1%(+2.20)#1,590
18.822403.3%1.4%(+1.93)#181.1%(+2.19)#1,595
19.824112.6%1.4%(+1.26)#191.1%(+1.53)#2,358
20.820542.5%1.4%(+1.17)#201.1%(+1.44)#2,511
21.829352.3%1.4%(+0.958)#211.1%(+1.23)#2,918
22.827302.2%1.4%(+0.821)#221.1%(+1.09)#3,226
23.831012.1%1.4%(+0.769)#231.1%(+1.04)#3,348
24.824421.9%1.4%(+0.564)#241.1%(+0.832)#3,905
25.827181.9%1.4%(+0.526)#251.1%(+0.794)#4,027
26.824261.8%1.4%(+0.406)#261.1%(+0.674)#4,457
27.826431.7%1.4%(+0.365)#271.1%(+0.633)#4,621
28.827161.6%1.4%(+0.260)#281.1%(+0.527)#5,080
29.826331.5%1.4%(+0.136)#291.1%(+0.404)#5,681
30.830011.5%1.4%(+0.119)#301.1%(+0.387)#5,782
31.826041.5%1.4%(+0.109)#311.1%(+0.377)#5,830
32.828011.4%1.4%(+0.074)#321.1%(+0.341)#6,012
33.824431.4%1.4%(+0.035)#331.1%(+0.303)#6,235
34.829371.4%1.4%(+0.023)#341.1%(+0.291)#6,295
35.826011.3%1.4%(-0.076)#351.1%(+0.191)#6,912
36.826371.2%1.4%(-0.194)#361.1%(+0.074)#7,765
37.824011.1%1.4%(-0.282)#371.1%(-0.014)#8,418
38.822011.1%1.4%(-0.303)#381.1%(-0.035)#8,578
39.827011.0%1.4%(-0.325)#391.1%(-0.057)#8,762
40.824140.99%1.4%(-0.370)#401.1%(-0.102)#9,148
41.824330.98%1.4%(-0.383)#411.1%(-0.115)#9,264
42.820090.94%1.4%(-0.420)#421.1%(-0.152)#9,581
43.823340.93%1.4%(-0.433)#431.1%(-0.165)#9,709
44.824350.91%1.4%(-0.446)#441.1%(-0.178)#9,846
45.826090.84%1.4%(-0.517)#451.1%(-0.249)#10,558
46.823010.81%1.4%(-0.545)#461.1%(-0.277)#10,859
47.825200.78%1.4%(-0.583)#471.1%(-0.315)#11,240
48.825010.75%1.4%(-0.605)#481.1%(-0.337)#11,462
49.820010.73%1.4%(-0.627)#491.1%(-0.359)#11,690
50.826360.73%1.4%(-0.628)#501.1%(-0.360)#11,706
51.829010.68%1.4%(-0.678)#511.1%(-0.410)#12,285
52.820070.60%1.4%(-0.760)#521.1%(-0.492)#13,313
53.831130.56%1.4%(-0.800)#531.1%(-0.532)#13,790
54.831280.52%1.4%(-0.843)#541.1%(-0.575)#14,306
55.824100.46%1.4%(-0.896)#551.1%(-0.628)#14,981
56.822210.39%1.4%(-0.968)#561.1%(-0.700)#15,881
57.831270.33%1.4%(-1.03)#571.1%(-0.757)#16,625
58.824310.29%1.4%(-1.07)#581.1%(-0.800)#17,180
59.829300.26%1.4%(-1.10)#591.1%(-0.830)#17,529
60.827210.25%1.4%(-1.11)#601.1%(-0.845)#17,671

Common Questions

What are the Top 10 Zip Codes with the Highest Percentage of Population Employed in Life, Physical & Social Science in Wyoming?
Top 10 Zip Codes with the Highest Percentage of Population Employed in Life, Physical & Social Science in Wyoming are:
#1
18.4%
#2
8.5%
#3
8.0%
#4
6.8%
#5
6.1%
#6
5.7%
#7
5.6%
#8
5.3%
#9
5.0%
#10
4.4%
What zip code has the Highest Percentage of Population Employed in Life, Physical & Social Science in Wyoming?
82923 has the Highest Percentage of Population Employed in Life, Physical & Social Science in Wyoming with 18.4%.
What is the Percentage of Population Employed in Life, Physical & Social Science in the State of Wyoming?
Percentage of Population Employed in Life, Physical & Social Science in Wyoming is 1.4%.
What is the Percentage of Population Employed in Life, Physical & Social Science in the United States?
Percentage of Population Employed in Life, Physical & Social Science in the United States is 1.1%.