Zip Codes with the Highest Percentage of Population Employed in Life, Physical & Social Science in Rhode Island

RELATED REPORTS & OPTIONS

Life, Physical & Social Science
Population
Families and Households
Female Fertility
Female Fertility (Unmarried)
Race (Community Size)
Race (Percentage)
Ancestry (Community Size)
AfghanAfricanAlaska NativeAlaskan AthabascanAlbanianAleutAlsatianAmericanApacheArabArapahoArgentineanArmenianAssyrian / Chaldean / SyriacAustralianAustrianBahamianBangladeshiBarbadianBasqueBelgianBelizeanBermudanBhutaneseBlackfeetBolivianBrazilianBritishBritish West IndianBulgarianBurmeseCajunCambodianCanadianCape VerdeanCarpatho RusynCelticCentral AmericanCentral American IndianCherokeeCheyenneChickasawChileanChineseChippewaChoctawColombianColvilleComancheCosta RicanCreeCreekCroatianCrowCubanCypriotCzechCzechoslovakianDanishDelawareDominicanDutchDutch West IndianEastern EuropeanEcuadorianEgyptianEnglishEstonianEthiopianEuropeanFijianFilipinoFinnishFrenchFrench American IndianFrench CanadianGermanGerman RussianGhanaianGreekGuamanian / ChamorroGuatemalanGuyaneseHaitianHmongHonduranHopiHoumaHungarianIcelanderIndian (Asian)IndonesianInupiatIranianIraqiIrishIroquoisIsraeliItalianJamaicanJapaneseJordanianKenyanKiowaKoreanLaotianLatvianLebaneseLiberianLithuanianLumbeeLuxembourgerMacedonianMalaysianMalteseMarshalleseMenomineeMexicanMexican American IndianMongolianMoroccanNative HawaiianNavajoNepaleseNew ZealanderNicaraguanNigerianNorthern EuropeanNorwegianOkinawanOsageOttawaPaiutePakistaniPalestinianPanamanianParaguayanPennsylvania GermanPeruvianPimaPolishPortuguesePotawatomiPuebloPuerto RicanPuget Sound SalishRomanianRussianSalvadoranSamoanScandinavianScotch-IrishScottishSeminoleSenegaleseSerbianShoshoneSierra LeoneanSiouxSlavicSlovakSloveneSomaliSouth AfricanSouth AmericanSouth American IndianSoviet UnionSpaniardSpanishSpanish AmericanSpanish American IndianSri LankanSubsaharan AfricanSudaneseSwedishSwissSyrianTaiwaneseThaiTlingit-HaidaTohono O'OdhamTonganTrinidadian and TobagonianTsimshianTurkishU.S. Virgin IslanderUgandanUkrainianUruguayanUteVenezuelanVietnameseWelshWest IndianYakamaYaquiYugoslavianYumanYup'ikZimbabwean
Ancestry (Percentage)
AfghanAfricanAlaska NativeAlaskan AthabascanAlbanianAleutAlsatianAmericanApacheArabArapahoArgentineanArmenianAssyrian / Chaldean / SyriacAustralianAustrianBahamianBangladeshiBarbadianBasqueBelgianBelizeanBermudanBhutaneseBlackfeetBolivianBrazilianBritishBritish West IndianBulgarianBurmeseCajunCambodianCanadianCape VerdeanCarpatho RusynCelticCentral AmericanCentral American IndianCherokeeCheyenneChickasawChileanChineseChippewaChoctawColombianColvilleComancheCosta RicanCreeCreekCroatianCrowCubanCypriotCzechCzechoslovakianDanishDelawareDominicanDutchDutch West IndianEastern EuropeanEcuadorianEgyptianEnglishEstonianEthiopianEuropeanFijianFilipinoFinnishFrenchFrench American IndianFrench CanadianGermanGerman RussianGhanaianGreekGuamanian / ChamorroGuatemalanGuyaneseHaitianHmongHonduranHopiHoumaHungarianIcelanderIndian (Asian)IndonesianInupiatIranianIraqiIrishIroquoisIsraeliItalianJamaicanJapaneseJordanianKenyanKiowaKoreanLaotianLatvianLebaneseLiberianLithuanianLumbeeLuxembourgerMacedonianMalaysianMalteseMarshalleseMenomineeMexicanMexican American IndianMongolianMoroccanNative HawaiianNavajoNepaleseNew ZealanderNicaraguanNigerianNorthern EuropeanNorwegianOkinawanOsageOttawaPaiutePakistaniPalestinianPanamanianParaguayanPennsylvania GermanPeruvianPimaPolishPortuguesePotawatomiPuebloPuerto RicanPuget Sound SalishRomanianRussianSalvadoranSamoanScandinavianScotch-IrishScottishSeminoleSenegaleseSerbianShoshoneSierra LeoneanSiouxSlavicSlovakSloveneSomaliSouth AfricanSouth AmericanSouth American IndianSoviet UnionSpaniardSpanishSpanish AmericanSpanish American IndianSri LankanSubsaharan AfricanSudaneseSwedishSwissSyrianTaiwaneseThaiTlingit-HaidaTohono O'OdhamTonganTrinidadian and TobagonianTsimshianTurkishU.S. Virgin IslanderUgandanUkrainianUruguayanUteVenezuelanVietnameseWelshWest IndianYakamaYaquiYugoslavianYumanYup'ikZimbabwean
Immigrant Origin (Total)
AfghanistanAfricaAlbaniaArgentinaArmeniaAsiaAustraliaAustriaAzoresBahamasBangladeshBarbadosBelarusBelgiumBelizeBoliviaBosnia and HerzegovinaBrazilBulgariaBurma / MyanmarCabo VerdeCambodiaCameroonCanadaCaribbeanCentral AmericaChileChinaColombiaCongoCosta RicaCroatiaCubaCzechoslovakiaDenmarkDominicaDominican RepublicEastern AfricaEastern AsiaEastern EuropeEcuadorEgyptEl SalvadorEnglandEritreaEthiopiaEuropeFijiFranceGermanyGhanaGreeceGrenadaGuatemalaGuyanaHaitiHondurasHong KongHungaryIndiaIndonesiaIranIraqIrelandIsraelItalyJamaicaJapanJordanKazakhstanKenyaKoreaKuwaitLaosLatin AmericaLatviaLebanonLiberiaLithuaniaMalaysiaMexicoMicronesiaMiddle AfricaMoldovaMoroccoNepalNetherlandsNicaraguaNigeriaNorth MacedoniaNorthern AfricaNorthern EuropeNorwayOceaniaPakistanPanamaPeruPhilippinesPolandPortugalRomaniaRussiaSaudi ArabiaScotlandSenegalSerbiaSierra LeoneSingaporeSomaliaSouth AfricaSouth AmericaSouth Central AsiaSouth Eastern AsiaSouthern EuropeSpainSri LankaSt. Vincent and the GrenadinesSudanSwedenSwitzerlandSyriaTaiwanThailandTrinidad and TobagoTurkeyUgandaUkraineUruguayUzbekistanVenezuelaVietnamWest IndiesWestern AfricaWestern AsiaWestern EuropeYemenZaireZimbabwe
Immigrant Origin (Percentage)
AfghanistanAfricaAlbaniaArgentinaArmeniaAsiaAustraliaAustriaAzoresBahamasBangladeshBarbadosBelarusBelgiumBelizeBoliviaBosnia and HerzegovinaBrazilBulgariaBurma / MyanmarCabo VerdeCambodiaCameroonCanadaCaribbeanCentral AmericaChileChinaColombiaCongoCosta RicaCroatiaCubaCzechoslovakiaDenmarkDominicaDominican RepublicEastern AfricaEastern AsiaEastern EuropeEcuadorEgyptEl SalvadorEnglandEritreaEthiopiaEuropeFijiFranceGermanyGhanaGreeceGrenadaGuatemalaGuyanaHaitiHondurasHong KongHungaryIndiaIndonesiaIranIraqIrelandIsraelItalyJamaicaJapanJordanKazakhstanKenyaKoreaKuwaitLaosLatin AmericaLatviaLebanonLiberiaLithuaniaMalaysiaMexicoMicronesiaMiddle AfricaMoldovaMoroccoNepalNetherlandsNicaraguaNigeriaNorth MacedoniaNorthern AfricaNorthern EuropeNorwayOceaniaPakistanPanamaPeruPhilippinesPolandPortugalRomaniaRussiaSaudi ArabiaScotlandSenegalSerbiaSierra LeoneSingaporeSomaliaSouth AfricaSouth AmericaSouth Central AsiaSouth Eastern AsiaSouthern EuropeSpainSri LankaSt. Vincent and the GrenadinesSudanSwedenSwitzerlandSyriaTaiwanThailandTrinidad and TobagoTurkeyUgandaUkraineUruguayUzbekistanVenezuelaVietnamWest IndiesWestern AfricaWestern AsiaWestern EuropeYemenZaireZimbabwe
Income
Income (Families)
Income (Households)
Poverty
Poverty (Families)
Unemployment
Employment Occupations
Employment Industries
Employer Class
Commute Time
Commute Means
School Enrollment
Education by Degree Field
Occupancy
Finances
Physical Characteristics
Rhode Island
Compare Zip Codes
Comparison Subject

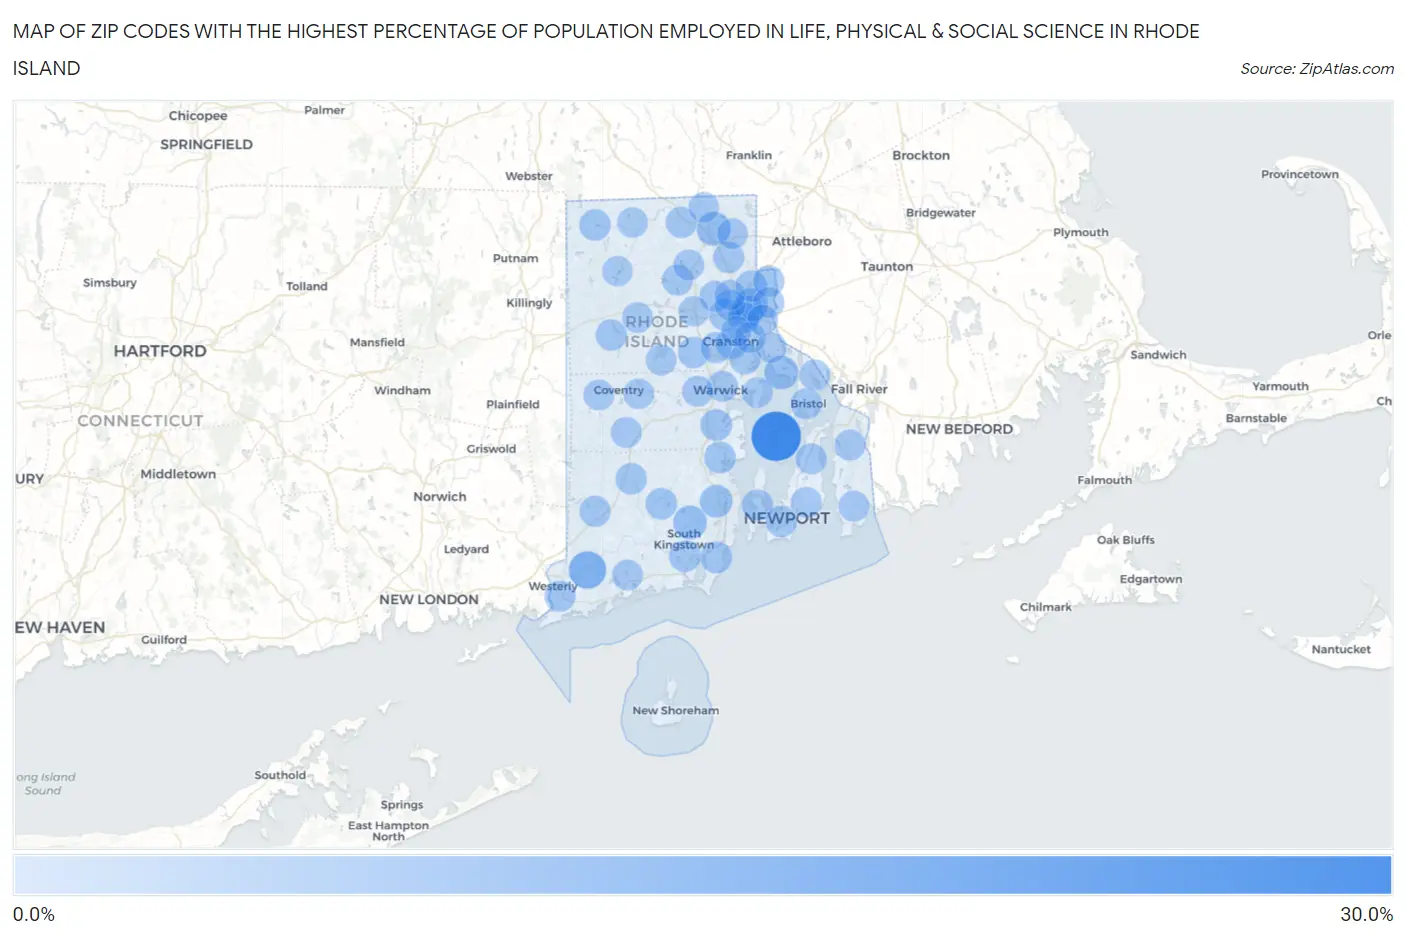
Map of Zip Codes with the Highest Percentage of Population Employed in Life, Physical & Social Science in Rhode Island

0.0%
30.0%
Zip Codes with the Highest Percentage of Population Employed in Life, Physical & Social Science in Rhode Island Map

Zip Codes with the Highest Percentage of Population Employed in Life, Physical & Social Science in Rhode Island

Zip Code % Employed vs State vs National
1.0287227.8%1.3%(+26.5)#11.1%(+26.7)#36
2.0280810.0%1.3%(+8.73)#21.1%(+8.91)#208
3.028385.2%1.3%(+3.93)#31.1%(+4.11)#713
4.028814.8%1.3%(+3.54)#41.1%(+3.72)#816
5.028064.8%1.3%(+3.50)#51.1%(+3.68)#824
6.029064.4%1.3%(+3.09)#61.1%(+3.27)#981
7.028743.3%1.3%(+2.07)#71.1%(+2.25)#1,537
8.028182.2%1.3%(+0.962)#81.1%(+1.14)#3,106
9.029122.2%1.3%(+0.931)#91.1%(+1.11)#3,177
10.028602.2%1.3%(+0.910)#101.1%(+1.09)#3,224
11.028822.0%1.3%(+0.766)#111.1%(+0.946)#3,579
12.029092.0%1.3%(+0.760)#121.1%(+0.939)#3,598
13.028792.0%1.3%(+0.745)#131.1%(+0.924)#3,643
14.028521.9%1.3%(+0.642)#141.1%(+0.821)#3,937
15.028921.9%1.3%(+0.624)#151.1%(+0.803)#3,997
16.028591.8%1.3%(+0.553)#161.1%(+0.733)#4,243
17.029031.8%1.3%(+0.518)#171.1%(+0.698)#4,364
18.029211.8%1.3%(+0.481)#181.1%(+0.660)#4,507
19.028251.5%1.3%(+0.254)#191.1%(+0.434)#5,521
20.029101.5%1.3%(+0.248)#201.1%(+0.427)#5,551
21.028221.5%1.3%(+0.191)#211.1%(+0.371)#5,860
22.029201.4%1.3%(+0.131)#221.1%(+0.310)#6,182
23.028961.4%1.3%(+0.091)#231.1%(+0.271)#6,411
24.028321.3%1.3%(-0.005)#241.1%(+0.174)#7,028
25.028651.2%1.3%(-0.023)#251.1%(+0.156)#7,153
26.028351.2%1.3%(-0.056)#261.1%(+0.123)#7,390
27.029111.2%1.3%(-0.058)#271.1%(+0.121)#7,402
28.028401.2%1.3%(-0.066)#281.1%(+0.114)#7,464
29.028281.2%1.3%(-0.086)#291.1%(+0.094)#7,602
30.028881.2%1.3%(-0.100)#301.1%(+0.079)#7,728
31.028091.2%1.3%(-0.114)#311.1%(+0.065)#7,819
32.028711.2%1.3%(-0.115)#321.1%(+0.065)#7,823
33.028911.2%1.3%(-0.116)#331.1%(+0.063)#7,839
34.028611.1%1.3%(-0.181)#341.1%(-0.002)#8,309
35.028861.1%1.3%(-0.191)#351.1%(-0.012)#8,398
36.029161.0%1.3%(-0.267)#361.1%(-0.088)#9,024
37.029050.96%1.3%(-0.315)#371.1%(-0.135)#9,446
38.028420.94%1.3%(-0.327)#381.1%(-0.147)#9,547
39.028170.87%1.3%(-0.397)#391.1%(-0.218)#10,221
40.028850.84%1.3%(-0.430)#401.1%(-0.250)#10,567
41.028780.84%1.3%(-0.432)#411.1%(-0.253)#10,601
42.028310.79%1.3%(-0.477)#421.1%(-0.298)#11,069
43.028370.79%1.3%(-0.485)#431.1%(-0.305)#11,141
44.028930.78%1.3%(-0.489)#441.1%(-0.310)#11,177
45.029170.75%1.3%(-0.519)#451.1%(-0.340)#11,500
46.029140.74%1.3%(-0.528)#461.1%(-0.349)#11,597
47.029080.74%1.3%(-0.528)#471.1%(-0.349)#11,598
48.029040.63%1.3%(-0.639)#481.1%(-0.460)#12,898
49.028570.59%1.3%(-0.681)#491.1%(-0.501)#13,422
50.028890.59%1.3%(-0.684)#501.1%(-0.505)#13,471
51.028270.57%1.3%(-0.697)#511.1%(-0.517)#13,611
52.028640.56%1.3%(-0.710)#521.1%(-0.531)#13,773
53.028130.49%1.3%(-0.781)#531.1%(-0.602)#14,645
54.028160.48%1.3%(-0.795)#541.1%(-0.615)#14,833
55.028950.43%1.3%(-0.845)#551.1%(-0.665)#15,429
56.028300.35%1.3%(-0.920)#561.1%(-0.740)#16,393
57.028140.35%1.3%(-0.924)#571.1%(-0.745)#16,454
58.029150.30%1.3%(-0.974)#581.1%(-0.795)#17,110
59.029070.25%1.3%(-1.02)#591.1%(-0.840)#17,625
60.029190.20%1.3%(-1.07)#601.1%(-0.889)#18,174

Common Questions

What are the Top 10 Zip Codes with the Highest Percentage of Population Employed in Life, Physical & Social Science in Rhode Island?
Top 10 Zip Codes with the Highest Percentage of Population Employed in Life, Physical & Social Science in Rhode Island are:
#1
27.8%
#2
10.0%
#3
5.2%
#4
4.8%
#5
4.8%
#6
4.4%
#7
3.3%
#8
2.2%
#9
2.2%
#10
2.2%
What zip code has the Highest Percentage of Population Employed in Life, Physical & Social Science in Rhode Island?
02872 has the Highest Percentage of Population Employed in Life, Physical & Social Science in Rhode Island with 27.8%.
What is the Percentage of Population Employed in Life, Physical & Social Science in the State of Rhode Island?
Percentage of Population Employed in Life, Physical & Social Science in Rhode Island is 1.3%.
What is the Percentage of Population Employed in Life, Physical & Social Science in the United States?
Percentage of Population Employed in Life, Physical & Social Science in the United States is 1.1%.