Zip Codes with the Highest Percentage of Population Employed in Life, Physical & Social Science in Alabama
RELATED REPORTS & OPTIONS
Life, Physical & Social Science
Alabama
Compare Zip Codes
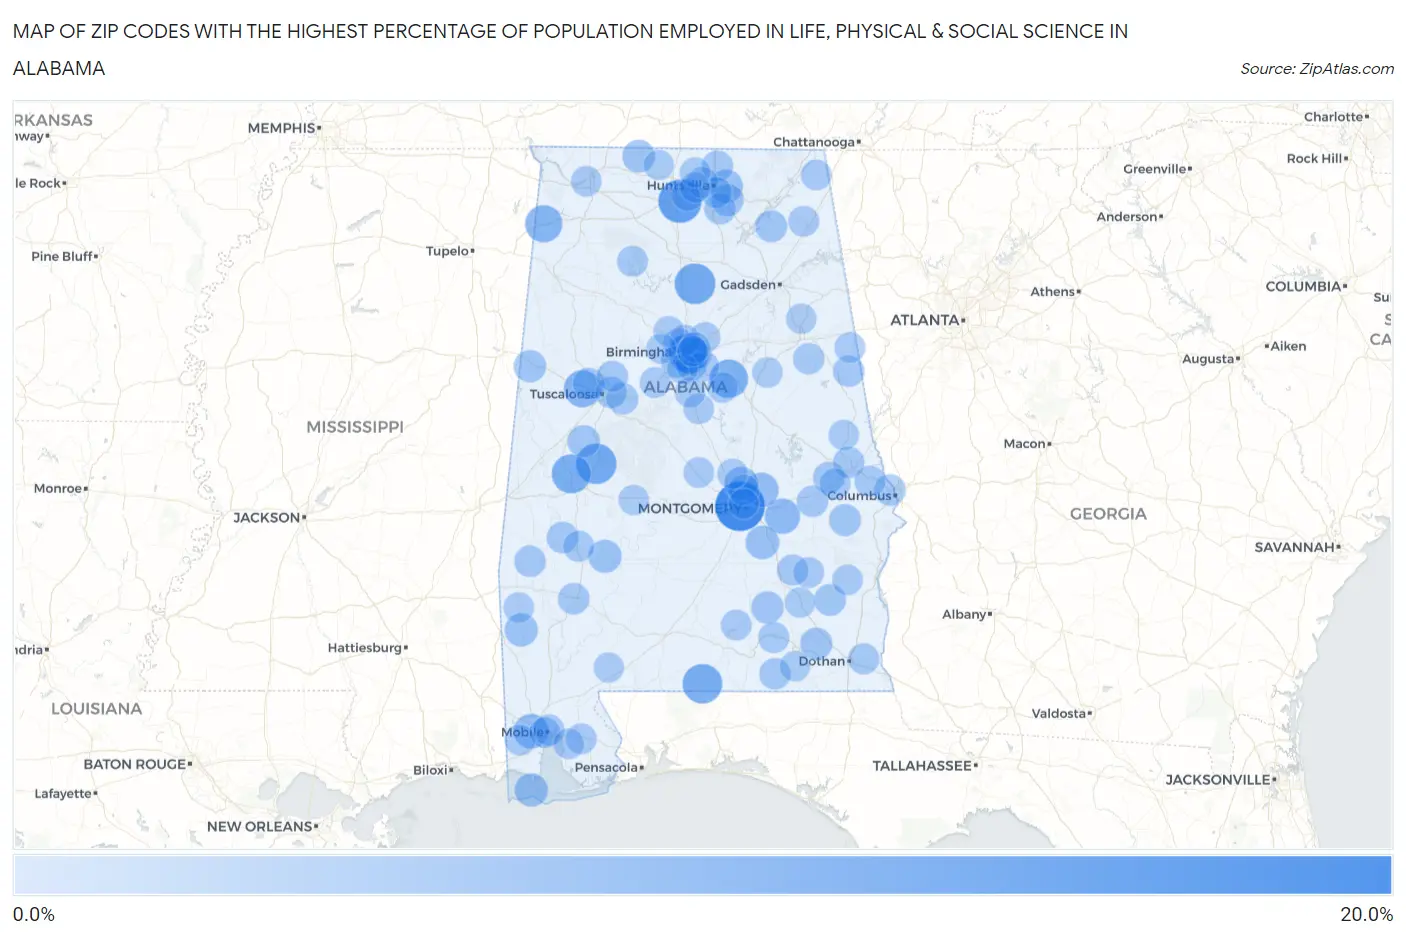
Map of Zip Codes with the Highest Percentage of Population Employed in Life, Physical & Social Science in Alabama
0.0%
20.0%
Zip Codes with the Highest Percentage of Population Employed in Life, Physical & Social Science in Alabama
| Zip Code | % Employed | vs State | vs National | |
| 1. | 36112 | 16.7% | 0.74%(+15.9)#1 | 1.1%(+15.6)#89 |
| 2. | 35649 | 11.4% | 0.74%(+10.7)#2 | 1.1%(+10.3)#158 |
| 3. | 35070 | 9.4% | 0.74%(+8.63)#3 | 1.1%(+8.28)#234 |
| 4. | 36744 | 9.3% | 0.74%(+8.52)#4 | 1.1%(+8.18)#238 |
| 5. | 36483 | 8.5% | 0.74%(+7.79)#5 | 1.1%(+7.45)#281 |
| 6. | 35233 | 8.5% | 0.74%(+7.74)#6 | 1.1%(+7.39)#285 |
| 7. | 36740 | 8.1% | 0.74%(+7.35)#7 | 1.1%(+7.00)#315 |
| 8. | 35078 | 7.7% | 0.74%(+6.97)#8 | 1.1%(+6.62)#349 |
| 9. | 35203 | 7.0% | 0.74%(+6.26)#9 | 1.1%(+5.91)#406 |
| 10. | 35582 | 6.5% | 0.74%(+5.79)#10 | 1.1%(+5.44)#465 |
| 11. | 35446 | 6.5% | 0.74%(+5.77)#11 | 1.1%(+5.42)#469 |
| 12. | 36013 | 5.0% | 0.74%(+4.26)#12 | 1.1%(+3.91)#760 |
| 13. | 36688 | 4.7% | 0.74%(+3.91)#13 | 1.1%(+3.56)#865 |
| 14. | 36093 | 4.5% | 0.74%(+3.76)#14 | 1.1%(+3.42)#924 |
| 15. | 35205 | 3.9% | 0.74%(+3.18)#15 | 1.1%(+2.83)#1,205 |
| 16. | 36025 | 3.9% | 0.74%(+3.15)#16 | 1.1%(+2.80)#1,223 |
| 17. | 36069 | 3.7% | 0.74%(+2.93)#17 | 1.1%(+2.58)#1,329 |
| 18. | 36528 | 3.5% | 0.74%(+2.76)#18 | 1.1%(+2.42)#1,420 |
| 19. | 35741 | 3.5% | 0.74%(+2.74)#19 | 1.1%(+2.39)#1,437 |
| 20. | 36518 | 3.4% | 0.74%(+2.62)#20 | 1.1%(+2.27)#1,526 |
| 21. | 36769 | 3.3% | 0.74%(+2.57)#21 | 1.1%(+2.22)#1,563 |
| 22. | 35221 | 3.2% | 0.74%(+2.47)#22 | 1.1%(+2.12)#1,660 |
| 23. | 35610 | 2.9% | 0.74%(+2.18)#23 | 1.1%(+1.83)#1,974 |
| 24. | 36034 | 2.7% | 0.74%(+1.97)#24 | 1.1%(+1.62)#2,236 |
| 25. | 35441 | 2.7% | 0.74%(+1.96)#25 | 1.1%(+1.61)#2,244 |
| 26. | 35461 | 2.7% | 0.74%(+1.94)#26 | 1.1%(+1.59)#2,269 |
| 27. | 35763 | 2.6% | 0.74%(+1.88)#27 | 1.1%(+1.53)#2,357 |
| 28. | 36362 | 2.6% | 0.74%(+1.85)#28 | 1.1%(+1.50)#2,413 |
| 29. | 35756 | 2.4% | 0.74%(+1.64)#29 | 1.1%(+1.29)#2,793 |
| 30. | 36860 | 2.4% | 0.74%(+1.64)#30 | 1.1%(+1.29)#2,797 |
| 31. | 35975 | 2.4% | 0.74%(+1.62)#31 | 1.1%(+1.27)#2,818 |
| 32. | 35452 | 2.2% | 0.74%(+1.48)#32 | 1.1%(+1.13)#3,136 |
| 33. | 36017 | 2.2% | 0.74%(+1.45)#33 | 1.1%(+1.10)#3,200 |
| 34. | 36451 | 2.1% | 0.74%(+1.37)#34 | 1.1%(+1.02)#3,397 |
| 35. | 35453 | 2.1% | 0.74%(+1.32)#35 | 1.1%(+0.972)#3,507 |
| 36. | 36782 | 2.0% | 0.74%(+1.29)#36 | 1.1%(+0.941)#3,590 |
| 37. | 35803 | 2.0% | 0.74%(+1.29)#37 | 1.1%(+0.938)#3,599 |
| 38. | 36921 | 2.0% | 0.74%(+1.28)#38 | 1.1%(+0.929)#3,627 |
| 39. | 36832 | 2.0% | 0.74%(+1.21)#39 | 1.1%(+0.865)#3,808 |
| 40. | 35404 | 2.0% | 0.74%(+1.21)#40 | 1.1%(+0.863)#3,815 |
| 41. | 36088 | 1.9% | 0.74%(+1.19)#41 | 1.1%(+0.844)#3,875 |
| 42. | 35759 | 1.9% | 0.74%(+1.15)#42 | 1.1%(+0.803)#4,001 |
| 43. | 36477 | 1.9% | 0.74%(+1.15)#43 | 1.1%(+0.800)#4,006 |
| 44. | 36801 | 1.9% | 0.74%(+1.15)#44 | 1.1%(+0.798)#4,012 |
| 45. | 36280 | 1.9% | 0.74%(+1.13)#45 | 1.1%(+0.782)#4,061 |
| 46. | 36867 | 1.9% | 0.74%(+1.13)#46 | 1.1%(+0.776)#4,081 |
| 47. | 36258 | 1.8% | 0.74%(+1.05)#47 | 1.1%(+0.704)#4,342 |
| 48. | 36602 | 1.8% | 0.74%(+1.03)#48 | 1.1%(+0.677)#4,452 |
| 49. | 35806 | 1.7% | 0.74%(+0.988)#49 | 1.1%(+0.640)#4,586 |
| 50. | 35406 | 1.7% | 0.74%(+0.979)#50 | 1.1%(+0.630)#4,629 |
| 51. | 36081 | 1.7% | 0.74%(+0.972)#51 | 1.1%(+0.624)#4,657 |
| 52. | 35802 | 1.7% | 0.74%(+0.954)#52 | 1.1%(+0.606)#4,742 |
| 53. | 36736 | 1.7% | 0.74%(+0.953)#53 | 1.1%(+0.604)#4,751 |
| 54. | 36376 | 1.7% | 0.74%(+0.941)#54 | 1.1%(+0.593)#4,803 |
| 55. | 35209 | 1.7% | 0.74%(+0.937)#55 | 1.1%(+0.588)#4,822 |
| 56. | 36830 | 1.6% | 0.74%(+0.885)#56 | 1.1%(+0.537)#5,041 |
| 57. | 36874 | 1.6% | 0.74%(+0.883)#57 | 1.1%(+0.535)#5,056 |
| 58. | 35216 | 1.6% | 0.74%(+0.861)#58 | 1.1%(+0.512)#5,144 |
| 59. | 36020 | 1.6% | 0.74%(+0.860)#59 | 1.1%(+0.511)#5,148 |
| 60. | 35572 | 1.6% | 0.74%(+0.850)#60 | 1.1%(+0.501)#5,194 |
| 61. | 36323 | 1.6% | 0.74%(+0.839)#61 | 1.1%(+0.490)#5,245 |
| 62. | 36604 | 1.5% | 0.74%(+0.790)#62 | 1.1%(+0.441)#5,484 |
| 63. | 35111 | 1.5% | 0.74%(+0.787)#63 | 1.1%(+0.438)#5,502 |
| 64. | 35214 | 1.5% | 0.74%(+0.746)#64 | 1.1%(+0.397)#5,718 |
| 65. | 36005 | 1.5% | 0.74%(+0.724)#65 | 1.1%(+0.375)#5,837 |
| 66. | 35968 | 1.5% | 0.74%(+0.711)#66 | 1.1%(+0.362)#5,907 |
| 67. | 36695 | 1.4% | 0.74%(+0.692)#67 | 1.1%(+0.343)#6,002 |
| 68. | 35966 | 1.4% | 0.74%(+0.686)#68 | 1.1%(+0.338)#6,034 |
| 69. | 35186 | 1.4% | 0.74%(+0.685)#69 | 1.1%(+0.336)#6,042 |
| 70. | 36551 | 1.4% | 0.74%(+0.665)#70 | 1.1%(+0.316)#6,153 |
| 71. | 36028 | 1.4% | 0.74%(+0.659)#71 | 1.1%(+0.310)#6,183 |
| 72. | 35213 | 1.4% | 0.74%(+0.653)#72 | 1.1%(+0.305)#6,223 |
| 73. | 36526 | 1.4% | 0.74%(+0.626)#73 | 1.1%(+0.278)#6,363 |
| 74. | 35235 | 1.4% | 0.74%(+0.625)#74 | 1.1%(+0.276)#6,377 |
| 75. | 35068 | 1.4% | 0.74%(+0.617)#75 | 1.1%(+0.268)#6,425 |
| 76. | 36006 | 1.4% | 0.74%(+0.613)#76 | 1.1%(+0.264)#6,447 |
| 77. | 35242 | 1.3% | 0.74%(+0.594)#77 | 1.1%(+0.245)#6,558 |
| 78. | 35040 | 1.3% | 0.74%(+0.554)#78 | 1.1%(+0.205)#6,831 |
| 79. | 35660 | 1.3% | 0.74%(+0.553)#79 | 1.1%(+0.204)#6,838 |
| 80. | 36273 | 1.3% | 0.74%(+0.535)#80 | 1.1%(+0.186)#6,947 |
| 81. | 36016 | 1.3% | 0.74%(+0.531)#81 | 1.1%(+0.182)#6,972 |
| 82. | 35226 | 1.3% | 0.74%(+0.511)#82 | 1.1%(+0.162)#7,110 |
| 83. | 35758 | 1.3% | 0.74%(+0.509)#83 | 1.1%(+0.161)#7,122 |
| 84. | 35749 | 1.2% | 0.74%(+0.491)#84 | 1.1%(+0.143)#7,241 |
| 85. | 36558 | 1.2% | 0.74%(+0.483)#85 | 1.1%(+0.134)#7,302 |
| 86. | 35073 | 1.2% | 0.74%(+0.474)#86 | 1.1%(+0.125)#7,377 |
| 87. | 35160 | 1.2% | 0.74%(+0.467)#87 | 1.1%(+0.118)#7,421 |
| 88. | 35212 | 1.2% | 0.74%(+0.459)#88 | 1.1%(+0.110)#7,488 |
| 89. | 36862 | 1.2% | 0.74%(+0.447)#89 | 1.1%(+0.098)#7,571 |
| 90. | 36759 | 1.2% | 0.74%(+0.425)#90 | 1.1%(+0.076)#7,753 |
| 91. | 35222 | 1.2% | 0.74%(+0.421)#91 | 1.1%(+0.072)#7,780 |
| 92. | 36010 | 1.2% | 0.74%(+0.412)#92 | 1.1%(+0.063)#7,831 |
| 93. | 35118 | 1.2% | 0.74%(+0.410)#93 | 1.1%(+0.062)#7,847 |
| 94. | 36316 | 1.1% | 0.74%(+0.400)#94 | 1.1%(+0.051)#7,917 |
| 95. | 35007 | 1.1% | 0.74%(+0.386)#95 | 1.1%(+0.037)#8,021 |
| 96. | 36104 | 1.1% | 0.74%(+0.375)#96 | 1.1%(+0.027)#8,089 |
| 97. | 36502 | 1.1% | 0.74%(+0.347)#97 | 1.1%(-0.002)#8,313 |
| 98. | 36277 | 1.1% | 0.74%(+0.340)#98 | 1.1%(-0.009)#8,370 |
| 99. | 35614 | 1.1% | 0.74%(+0.337)#99 | 1.1%(-0.012)#8,394 |
| 100. | 36022 | 1.1% | 0.74%(+0.336)#100 | 1.1%(-0.013)#8,405 |
Common Questions
What are the Top 10 Zip Codes with the Highest Percentage of Population Employed in Life, Physical & Social Science in Alabama?
Top 10 Zip Codes with the Highest Percentage of Population Employed in Life, Physical & Social Science in Alabama are:
What zip code has the Highest Percentage of Population Employed in Life, Physical & Social Science in Alabama?
36112 has the Highest Percentage of Population Employed in Life, Physical & Social Science in Alabama with 16.7%.
What is the Percentage of Population Employed in Life, Physical & Social Science in the State of Alabama?
Percentage of Population Employed in Life, Physical & Social Science in Alabama is 0.74%.
What is the Percentage of Population Employed in Life, Physical & Social Science in the United States?
Percentage of Population Employed in Life, Physical & Social Science in the United States is 1.1%.