Zip Codes with the Highest Percentage of Population Employed in Life, Physical & Social Science in Alaska
RELATED REPORTS & OPTIONS
Life, Physical & Social Science
Alaska
Compare Zip Codes
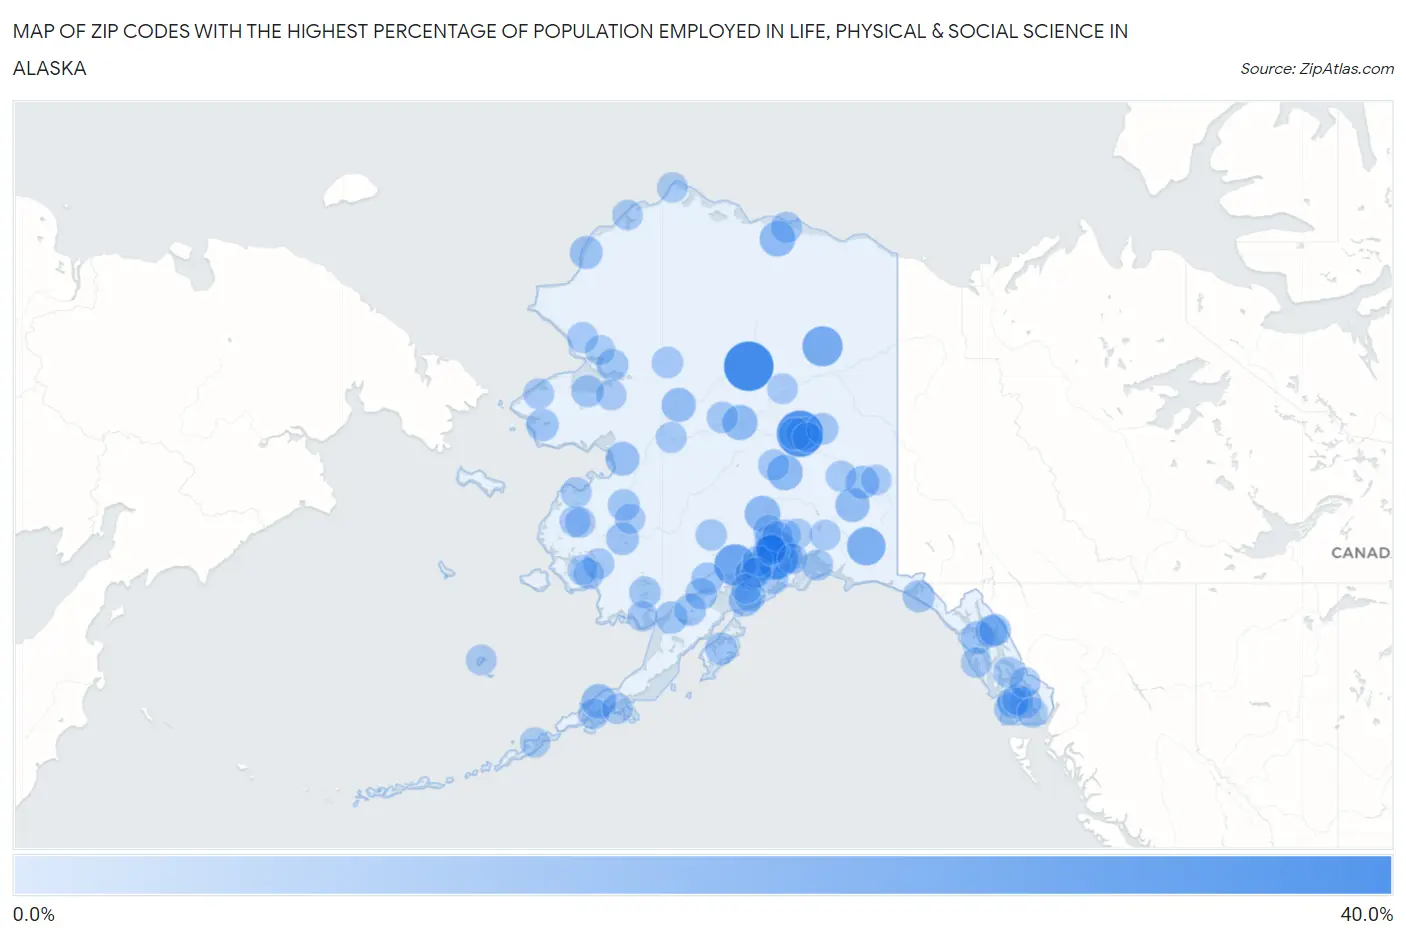
Map of Zip Codes with the Highest Percentage of Population Employed in Life, Physical & Social Science in Alaska
0.0%
40.0%
Zip Codes with the Highest Percentage of Population Employed in Life, Physical & Social Science in Alaska
| Zip Code | % Employed | vs State | vs National | |
| 1. | 99726 | 33.3% | 2.0%(+31.3)#1 | 1.1%(+32.2)#22 |
| 2. | 99775 | 27.9% | 2.0%(+25.9)#2 | 1.1%(+26.8)#33 |
| 3. | 99635 | 19.4% | 2.0%(+17.4)#3 | 1.1%(+18.4)#66 |
| 4. | 99605 | 17.7% | 2.0%(+15.7)#4 | 1.1%(+16.7)#78 |
| 5. | 99781 | 17.1% | 2.0%(+15.0)#5 | 1.1%(+16.0)#84 |
| 6. | 99566 | 14.3% | 2.0%(+12.2)#6 | 1.1%(+13.2)#114 |
| 7. | 99683 | 9.7% | 2.0%(+7.68)#7 | 1.1%(+8.62)#219 |
| 8. | 99519 | 9.3% | 2.0%(+7.26)#8 | 1.1%(+8.21)#237 |
| 9. | 99755 | 9.1% | 2.0%(+7.02)#9 | 1.1%(+7.97)#254 |
| 10. | 99777 | 8.6% | 2.0%(+6.56)#10 | 1.1%(+7.51)#277 |
| 11. | 99571 | 7.4% | 2.0%(+5.39)#11 | 1.1%(+6.34)#370 |
| 12. | 99586 | 7.3% | 2.0%(+5.28)#12 | 1.1%(+6.23)#379 |
| 13. | 99746 | 6.9% | 2.0%(+4.86)#13 | 1.1%(+5.81)#422 |
| 14. | 99684 | 6.5% | 2.0%(+4.51)#14 | 1.1%(+5.46)#463 |
| 15. | 99703 | 5.8% | 2.0%(+3.72)#15 | 1.1%(+4.67)#580 |
| 16. | 99776 | 5.7% | 2.0%(+3.68)#16 | 1.1%(+4.62)#589 |
| 17. | 99505 | 5.1% | 2.0%(+3.05)#17 | 1.1%(+3.99)#740 |
| 18. | 99829 | 5.1% | 2.0%(+3.03)#18 | 1.1%(+3.98)#743 |
| 19. | 99759 | 4.8% | 2.0%(+2.80)#19 | 1.1%(+3.75)#811 |
| 20. | 99663 | 4.6% | 2.0%(+2.59)#20 | 1.1%(+3.53)#874 |
| 21. | 99626 | 4.6% | 2.0%(+2.58)#21 | 1.1%(+3.52)#876 |
| 22. | 99587 | 4.3% | 2.0%(+2.25)#22 | 1.1%(+3.20)#1,010 |
| 23. | 99709 | 4.2% | 2.0%(+2.20)#23 | 1.1%(+3.15)#1,032 |
| 24. | 99762 | 4.1% | 2.0%(+2.08)#24 | 1.1%(+3.03)#1,090 |
| 25. | 99615 | 4.1% | 2.0%(+2.04)#25 | 1.1%(+2.99)#1,106 |
| 26. | 99610 | 4.0% | 2.0%(+2.00)#26 | 1.1%(+2.95)#1,128 |
| 27. | 99633 | 4.0% | 2.0%(+1.98)#27 | 1.1%(+2.93)#1,138 |
| 28. | 99516 | 3.9% | 2.0%(+1.86)#28 | 1.1%(+2.81)#1,215 |
| 29. | 99653 | 3.8% | 2.0%(+1.81)#29 | 1.1%(+2.76)#1,236 |
| 30. | 99736 | 3.8% | 2.0%(+1.73)#30 | 1.1%(+2.68)#1,278 |
| 31. | 99689 | 3.7% | 2.0%(+1.69)#31 | 1.1%(+2.64)#1,300 |
| 32. | 99824 | 3.5% | 2.0%(+1.48)#32 | 1.1%(+2.43)#1,410 |
| 33. | 99613 | 3.3% | 2.0%(+1.27)#33 | 1.1%(+2.21)#1,571 |
| 34. | 99763 | 3.2% | 2.0%(+1.14)#34 | 1.1%(+2.08)#1,686 |
| 35. | 99606 | 3.2% | 2.0%(+1.12)#35 | 1.1%(+2.07)#1,700 |
| 36. | 99801 | 3.1% | 2.0%(+1.10)#36 | 1.1%(+2.05)#1,712 |
| 37. | 99517 | 3.1% | 2.0%(+1.06)#37 | 1.1%(+2.01)#1,763 |
| 38. | 99712 | 3.0% | 2.0%(+0.966)#38 | 1.1%(+1.91)#1,869 |
| 39. | 99576 | 3.0% | 2.0%(+0.956)#39 | 1.1%(+1.90)#1,881 |
| 40. | 99922 | 3.0% | 2.0%(+0.924)#40 | 1.1%(+1.87)#1,921 |
| 41. | 99558 | 2.9% | 2.0%(+0.902)#41 | 1.1%(+1.85)#1,947 |
| 42. | 99734 | 2.6% | 2.0%(+0.591)#42 | 1.1%(+1.54)#2,352 |
| 43. | 99503 | 2.6% | 2.0%(+0.526)#43 | 1.1%(+1.47)#2,452 |
| 44. | 99773 | 2.5% | 2.0%(+0.493)#44 | 1.1%(+1.44)#2,512 |
| 45. | 99768 | 2.5% | 2.0%(+0.493)#45 | 1.1%(+1.44)#2,513 |
| 46. | 99664 | 2.5% | 2.0%(+0.448)#46 | 1.1%(+1.40)#2,596 |
| 47. | 99603 | 2.4% | 2.0%(+0.317)#47 | 1.1%(+1.27)#2,831 |
| 48. | 99901 | 2.3% | 2.0%(+0.257)#48 | 1.1%(+1.20)#2,971 |
| 49. | 99577 | 2.3% | 2.0%(+0.237)#49 | 1.1%(+1.19)#3,008 |
| 50. | 99921 | 2.3% | 2.0%(+0.217)#50 | 1.1%(+1.17)#3,049 |
| 51. | 99645 | 2.2% | 2.0%(+0.200)#51 | 1.1%(+1.15)#3,086 |
| 52. | 99743 | 2.2% | 2.0%(+0.167)#52 | 1.1%(+1.11)#3,168 |
| 53. | 99574 | 1.9% | 2.0%(-0.111)#53 | 1.1%(+0.837)#3,896 |
| 54. | 99515 | 1.9% | 2.0%(-0.117)#54 | 1.1%(+0.831)#3,910 |
| 55. | 99501 | 1.9% | 2.0%(-0.122)#55 | 1.1%(+0.826)#3,920 |
| 56. | 99919 | 1.9% | 2.0%(-0.145)#56 | 1.1%(+0.803)#4,000 |
| 57. | 99634 | 1.8% | 2.0%(-0.221)#57 | 1.1%(+0.727)#4,264 |
| 58. | 99737 | 1.8% | 2.0%(-0.223)#58 | 1.1%(+0.725)#4,274 |
| 59. | 99833 | 1.8% | 2.0%(-0.243)#59 | 1.1%(+0.705)#4,336 |
| 60. | 99741 | 1.8% | 2.0%(-0.253)#60 | 1.1%(+0.695)#4,376 |
| 61. | 99502 | 1.8% | 2.0%(-0.279)#61 | 1.1%(+0.669)#4,476 |
| 62. | 99507 | 1.7% | 2.0%(-0.377)#62 | 1.1%(+0.571)#4,891 |
| 63. | 99631 | 1.6% | 2.0%(-0.435)#63 | 1.1%(+0.513)#5,134 |
| 64. | 99623 | 1.6% | 2.0%(-0.436)#64 | 1.1%(+0.513)#5,141 |
| 65. | 99504 | 1.6% | 2.0%(-0.464)#65 | 1.1%(+0.485)#5,267 |
| 66. | 99761 | 1.6% | 2.0%(-0.464)#66 | 1.1%(+0.484)#5,274 |
| 67. | 99620 | 1.6% | 2.0%(-0.486)#67 | 1.1%(+0.462)#5,366 |
| 68. | 99612 | 1.5% | 2.0%(-0.529)#68 | 1.1%(+0.420)#5,606 |
| 69. | 99660 | 1.5% | 2.0%(-0.535)#69 | 1.1%(+0.413)#5,641 |
| 70. | 99506 | 1.5% | 2.0%(-0.556)#70 | 1.1%(+0.393)#5,743 |
| 71. | 99929 | 1.5% | 2.0%(-0.567)#71 | 1.1%(+0.381)#5,816 |
| 72. | 99772 | 1.4% | 2.0%(-0.600)#72 | 1.1%(+0.348)#5,974 |
| 73. | 99632 | 1.4% | 2.0%(-0.604)#73 | 1.1%(+0.344)#5,992 |
| 74. | 99672 | 1.4% | 2.0%(-0.676)#74 | 1.1%(+0.272)#6,400 |
| 75. | 99727 | 1.4% | 2.0%(-0.688)#75 | 1.1%(+0.260)#6,468 |
| 76. | 99701 | 1.3% | 2.0%(-0.721)#76 | 1.1%(+0.227)#6,684 |
| 77. | 99688 | 1.3% | 2.0%(-0.723)#77 | 1.1%(+0.225)#6,697 |
| 78. | 99658 | 1.3% | 2.0%(-0.747)#78 | 1.1%(+0.201)#6,851 |
| 79. | 99661 | 1.2% | 2.0%(-0.823)#79 | 1.1%(+0.125)#7,378 |
| 80. | 99723 | 1.2% | 2.0%(-0.845)#80 | 1.1%(+0.104)#7,539 |
| 81. | 99926 | 1.1% | 2.0%(-0.903)#81 | 1.1%(+0.045)#7,965 |
| 82. | 99573 | 1.1% | 2.0%(-0.903)#82 | 1.1%(+0.045)#7,967 |
| 83. | 99508 | 1.1% | 2.0%(-0.905)#83 | 1.1%(+0.043)#7,980 |
| 84. | 99835 | 1.1% | 2.0%(-0.922)#84 | 1.1%(+0.026)#8,095 |
| 85. | 99654 | 1.1% | 2.0%(-0.943)#85 | 1.1%(+0.005)#8,257 |
| 86. | 99628 | 1.0% | 2.0%(-1.01)#86 | 1.1%(-0.065)#8,832 |
| 87. | 99611 | 1.0% | 2.0%(-1.02)#87 | 1.1%(-0.067)#8,850 |
| 88. | 99669 | 1.0% | 2.0%(-1.02)#88 | 1.1%(-0.067)#8,851 |
| 89. | 99782 | 1.0% | 2.0%(-1.03)#89 | 1.1%(-0.081)#8,976 |
| 90. | 99680 | 0.98% | 2.0%(-1.06)#90 | 1.1%(-0.107)#9,197 |
| 91. | 99518 | 0.96% | 2.0%(-1.08)#91 | 1.1%(-0.127)#9,374 |
| 92. | 99780 | 0.95% | 2.0%(-1.09)#92 | 1.1%(-0.143)#9,509 |
| 93. | 99602 | 0.93% | 2.0%(-1.11)#93 | 1.1%(-0.165)#9,710 |
| 94. | 99556 | 0.91% | 2.0%(-1.13)#94 | 1.1%(-0.178)#9,844 |
| 95. | 99705 | 0.82% | 2.0%(-1.22)#95 | 1.1%(-0.275)#10,840 |
| 96. | 99674 | 0.81% | 2.0%(-1.23)#96 | 1.1%(-0.281)#10,898 |
| 97. | 99685 | 0.70% | 2.0%(-1.34)#97 | 1.1%(-0.395)#12,087 |
| 98. | 99559 | 0.66% | 2.0%(-1.38)#98 | 1.1%(-0.435)#12,573 |
| 99. | 99752 | 0.63% | 2.0%(-1.41)#99 | 1.1%(-0.466)#12,974 |
| 100. | 99693 | 0.55% | 2.0%(-1.49)#100 | 1.1%(-0.538)#13,870 |
Common Questions
What are the Top 10 Zip Codes with the Highest Percentage of Population Employed in Life, Physical & Social Science in Alaska?
Top 10 Zip Codes with the Highest Percentage of Population Employed in Life, Physical & Social Science in Alaska are:
What zip code has the Highest Percentage of Population Employed in Life, Physical & Social Science in Alaska?
99726 has the Highest Percentage of Population Employed in Life, Physical & Social Science in Alaska with 33.3%.
What is the Percentage of Population Employed in Life, Physical & Social Science in the State of Alaska?
Percentage of Population Employed in Life, Physical & Social Science in Alaska is 2.0%.
What is the Percentage of Population Employed in Life, Physical & Social Science in the United States?
Percentage of Population Employed in Life, Physical & Social Science in the United States is 1.1%.