Zip Codes with the Highest Percentage of Population Employed in Life, Physical & Social Science in Hawaii

RELATED REPORTS & OPTIONS

Life, Physical & Social Science
Population
Families and Households
Female Fertility
Female Fertility (Unmarried)
Race (Community Size)
Race (Percentage)
Ancestry (Community Size)
AfghanAfricanAlaska NativeAlaskan AthabascanAlbanianAleutAlsatianAmericanApacheArabArapahoArgentineanArmenianAssyrian / Chaldean / SyriacAustralianAustrianBahamianBangladeshiBarbadianBasqueBelgianBelizeanBermudanBhutaneseBlackfeetBolivianBrazilianBritishBritish West IndianBulgarianBurmeseCajunCambodianCanadianCape VerdeanCarpatho RusynCelticCentral AmericanCentral American IndianCherokeeCheyenneChickasawChileanChineseChippewaChoctawColombianColvilleComancheCosta RicanCreeCreekCroatianCrowCubanCypriotCzechCzechoslovakianDanishDelawareDominicanDutchDutch West IndianEastern EuropeanEcuadorianEgyptianEnglishEstonianEthiopianEuropeanFijianFilipinoFinnishFrenchFrench American IndianFrench CanadianGermanGerman RussianGhanaianGreekGuamanian / ChamorroGuatemalanGuyaneseHaitianHmongHonduranHopiHoumaHungarianIcelanderIndian (Asian)IndonesianInupiatIranianIraqiIrishIroquoisIsraeliItalianJamaicanJapaneseJordanianKenyanKiowaKoreanLaotianLatvianLebaneseLiberianLithuanianLumbeeLuxembourgerMacedonianMalaysianMalteseMarshalleseMenomineeMexicanMexican American IndianMongolianMoroccanNative HawaiianNavajoNepaleseNew ZealanderNicaraguanNigerianNorthern EuropeanNorwegianOkinawanOsageOttawaPaiutePakistaniPalestinianPanamanianParaguayanPennsylvania GermanPeruvianPimaPolishPortuguesePotawatomiPuebloPuerto RicanPuget Sound SalishRomanianRussianSalvadoranSamoanScandinavianScotch-IrishScottishSeminoleSenegaleseSerbianShoshoneSierra LeoneanSiouxSlavicSlovakSloveneSomaliSouth AfricanSouth AmericanSouth American IndianSoviet UnionSpaniardSpanishSpanish AmericanSpanish American IndianSri LankanSubsaharan AfricanSudaneseSwedishSwissSyrianTaiwaneseThaiTlingit-HaidaTohono O'OdhamTonganTrinidadian and TobagonianTsimshianTurkishU.S. Virgin IslanderUgandanUkrainianUruguayanUteVenezuelanVietnameseWelshWest IndianYakamaYaquiYugoslavianYumanYup'ikZimbabwean
Ancestry (Percentage)
AfghanAfricanAlaska NativeAlaskan AthabascanAlbanianAleutAlsatianAmericanApacheArabArapahoArgentineanArmenianAssyrian / Chaldean / SyriacAustralianAustrianBahamianBangladeshiBarbadianBasqueBelgianBelizeanBermudanBhutaneseBlackfeetBolivianBrazilianBritishBritish West IndianBulgarianBurmeseCajunCambodianCanadianCape VerdeanCarpatho RusynCelticCentral AmericanCentral American IndianCherokeeCheyenneChickasawChileanChineseChippewaChoctawColombianColvilleComancheCosta RicanCreeCreekCroatianCrowCubanCypriotCzechCzechoslovakianDanishDelawareDominicanDutchDutch West IndianEastern EuropeanEcuadorianEgyptianEnglishEstonianEthiopianEuropeanFijianFilipinoFinnishFrenchFrench American IndianFrench CanadianGermanGerman RussianGhanaianGreekGuamanian / ChamorroGuatemalanGuyaneseHaitianHmongHonduranHopiHoumaHungarianIcelanderIndian (Asian)IndonesianInupiatIranianIraqiIrishIroquoisIsraeliItalianJamaicanJapaneseJordanianKenyanKiowaKoreanLaotianLatvianLebaneseLiberianLithuanianLumbeeLuxembourgerMacedonianMalaysianMalteseMarshalleseMenomineeMexicanMexican American IndianMongolianMoroccanNative HawaiianNavajoNepaleseNew ZealanderNicaraguanNigerianNorthern EuropeanNorwegianOkinawanOsageOttawaPaiutePakistaniPalestinianPanamanianParaguayanPennsylvania GermanPeruvianPimaPolishPortuguesePotawatomiPuebloPuerto RicanPuget Sound SalishRomanianRussianSalvadoranSamoanScandinavianScotch-IrishScottishSeminoleSenegaleseSerbianShoshoneSierra LeoneanSiouxSlavicSlovakSloveneSomaliSouth AfricanSouth AmericanSouth American IndianSoviet UnionSpaniardSpanishSpanish AmericanSpanish American IndianSri LankanSubsaharan AfricanSudaneseSwedishSwissSyrianTaiwaneseThaiTlingit-HaidaTohono O'OdhamTonganTrinidadian and TobagonianTsimshianTurkishU.S. Virgin IslanderUgandanUkrainianUruguayanUteVenezuelanVietnameseWelshWest IndianYakamaYaquiYugoslavianYumanYup'ikZimbabwean
Immigrant Origin (Total)
AfghanistanAfricaAlbaniaArgentinaArmeniaAsiaAustraliaAustriaAzoresBahamasBangladeshBarbadosBelarusBelgiumBelizeBoliviaBosnia and HerzegovinaBrazilBulgariaBurma / MyanmarCabo VerdeCambodiaCameroonCanadaCaribbeanCentral AmericaChileChinaColombiaCongoCosta RicaCroatiaCubaCzechoslovakiaDenmarkDominicaDominican RepublicEastern AfricaEastern AsiaEastern EuropeEcuadorEgyptEl SalvadorEnglandEritreaEthiopiaEuropeFijiFranceGermanyGhanaGreeceGrenadaGuatemalaGuyanaHaitiHondurasHong KongHungaryIndiaIndonesiaIranIraqIrelandIsraelItalyJamaicaJapanJordanKazakhstanKenyaKoreaKuwaitLaosLatin AmericaLatviaLebanonLiberiaLithuaniaMalaysiaMexicoMicronesiaMiddle AfricaMoldovaMoroccoNepalNetherlandsNicaraguaNigeriaNorth MacedoniaNorthern AfricaNorthern EuropeNorwayOceaniaPakistanPanamaPeruPhilippinesPolandPortugalRomaniaRussiaSaudi ArabiaScotlandSenegalSerbiaSierra LeoneSingaporeSomaliaSouth AfricaSouth AmericaSouth Central AsiaSouth Eastern AsiaSouthern EuropeSpainSri LankaSt. Vincent and the GrenadinesSudanSwedenSwitzerlandSyriaTaiwanThailandTrinidad and TobagoTurkeyUgandaUkraineUruguayUzbekistanVenezuelaVietnamWest IndiesWestern AfricaWestern AsiaWestern EuropeYemenZaireZimbabwe
Immigrant Origin (Percentage)
AfghanistanAfricaAlbaniaArgentinaArmeniaAsiaAustraliaAustriaAzoresBahamasBangladeshBarbadosBelarusBelgiumBelizeBoliviaBosnia and HerzegovinaBrazilBulgariaBurma / MyanmarCabo VerdeCambodiaCameroonCanadaCaribbeanCentral AmericaChileChinaColombiaCongoCosta RicaCroatiaCubaCzechoslovakiaDenmarkDominicaDominican RepublicEastern AfricaEastern AsiaEastern EuropeEcuadorEgyptEl SalvadorEnglandEritreaEthiopiaEuropeFijiFranceGermanyGhanaGreeceGrenadaGuatemalaGuyanaHaitiHondurasHong KongHungaryIndiaIndonesiaIranIraqIrelandIsraelItalyJamaicaJapanJordanKazakhstanKenyaKoreaKuwaitLaosLatin AmericaLatviaLebanonLiberiaLithuaniaMalaysiaMexicoMicronesiaMiddle AfricaMoldovaMoroccoNepalNetherlandsNicaraguaNigeriaNorth MacedoniaNorthern AfricaNorthern EuropeNorwayOceaniaPakistanPanamaPeruPhilippinesPolandPortugalRomaniaRussiaSaudi ArabiaScotlandSenegalSerbiaSierra LeoneSingaporeSomaliaSouth AfricaSouth AmericaSouth Central AsiaSouth Eastern AsiaSouthern EuropeSpainSri LankaSt. Vincent and the GrenadinesSudanSwedenSwitzerlandSyriaTaiwanThailandTrinidad and TobagoTurkeyUgandaUkraineUruguayUzbekistanVenezuelaVietnamWest IndiesWestern AfricaWestern AsiaWestern EuropeYemenZaireZimbabwe
Income
Income (Families)
Income (Households)
Poverty
Poverty (Families)
Unemployment
Employment Occupations
Employment Industries
Employer Class
Commute Time
Commute Means
School Enrollment
Education by Degree Field
Occupancy
Finances
Physical Characteristics
Hawaii
Compare Zip Codes
Comparison Subject

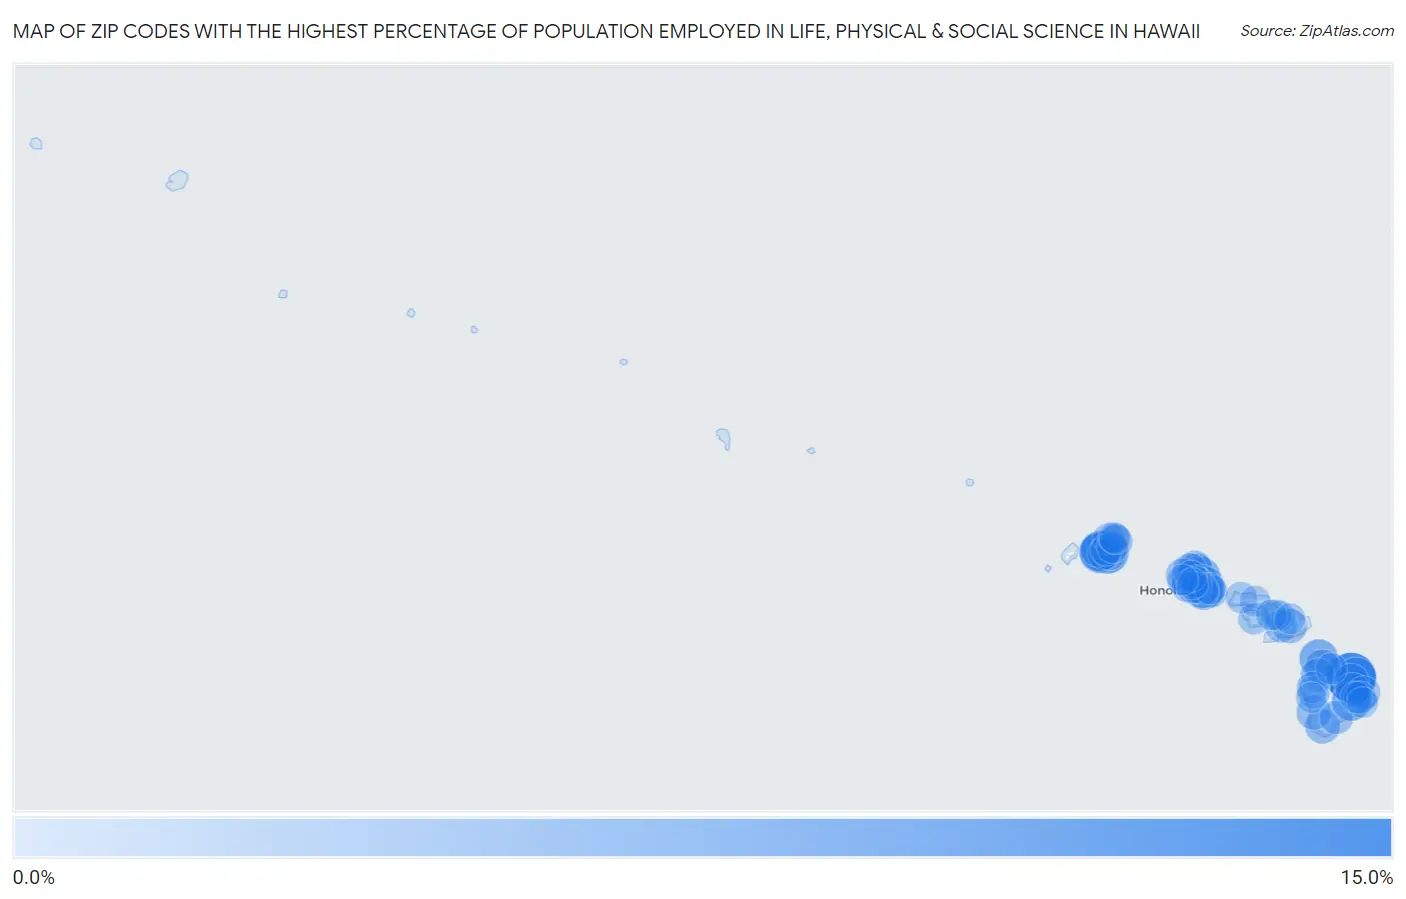
Map of Zip Codes with the Highest Percentage of Population Employed in Life, Physical & Social Science in Hawaii

0.0%
15.0%
Zip Codes with the Highest Percentage of Population Employed in Life, Physical & Social Science in Hawaii Map

Zip Codes with the Highest Percentage of Population Employed in Life, Physical & Social Science in Hawaii

Zip Code % Employed vs State vs National
1.9671011.5%1.1%(+10.4)#11.1%(+10.4)#154
2.967657.1%1.1%(+5.98)#21.1%(+6.00)#397
3.967476.3%1.1%(+5.21)#31.1%(+5.23)#498
4.967696.2%1.1%(+5.04)#41.1%(+5.06)#526
5.967285.7%1.1%(+4.63)#51.1%(+4.65)#587
6.968485.5%1.1%(+4.42)#61.1%(+4.44)#621
7.967855.1%1.1%(+3.99)#71.1%(+4.01)#736
8.967555.0%1.1%(+3.85)#81.1%(+3.87)#772
9.967304.6%1.1%(+3.49)#91.1%(+3.52)#882
10.968574.2%1.1%(+3.07)#101.1%(+3.10)#1,052
11.967433.2%1.1%(+2.05)#111.1%(+2.07)#1,695
12.967623.1%1.1%(+1.95)#121.1%(+1.97)#1,803
13.967812.7%1.1%(+1.61)#131.1%(+1.64)#2,206
14.967722.6%1.1%(+1.46)#141.1%(+1.48)#2,437
15.967042.5%1.1%(+1.41)#151.1%(+1.44)#2,521
16.967202.4%1.1%(+1.27)#161.1%(+1.30)#2,780
17.967902.2%1.1%(+1.10)#171.1%(+1.12)#3,146
18.968161.9%1.1%(+0.820)#181.1%(+0.845)#3,868
19.967311.9%1.1%(+0.787)#191.1%(+0.813)#3,965
20.967381.9%1.1%(+0.749)#201.1%(+0.774)#4,090
21.967961.9%1.1%(+0.741)#211.1%(+0.766)#4,119
22.967121.9%1.1%(+0.734)#221.1%(+0.760)#4,136
23.967771.8%1.1%(+0.705)#231.1%(+0.730)#4,255
24.968141.7%1.1%(+0.594)#241.1%(+0.619)#4,676
25.967911.7%1.1%(+0.591)#251.1%(+0.617)#4,690
26.968211.6%1.1%(+0.510)#261.1%(+0.536)#5,051
27.968221.5%1.1%(+0.413)#271.1%(+0.439)#5,499
28.967441.5%1.1%(+0.402)#281.1%(+0.427)#5,554
29.967491.5%1.1%(+0.381)#291.1%(+0.407)#5,672
30.967461.5%1.1%(+0.362)#301.1%(+0.388)#5,778
31.967341.4%1.1%(+0.316)#311.1%(+0.341)#6,013
32.967531.4%1.1%(+0.288)#321.1%(+0.314)#6,164
33.968251.3%1.1%(+0.164)#331.1%(+0.190)#6,925
34.967011.2%1.1%(+0.095)#341.1%(+0.120)#7,407
35.968261.2%1.1%(+0.086)#351.1%(+0.111)#7,482
36.967561.2%1.1%(+0.085)#361.1%(+0.111)#7,483
37.968131.2%1.1%(+0.060)#371.1%(+0.085)#7,673
38.967601.2%1.1%(+0.038)#381.1%(+0.063)#7,833
39.967251.1%1.1%(-0.038)#391.1%(-0.012)#8,401
40.968151.0%1.1%(-0.076)#401.1%(-0.050)#8,702
41.967071.0%1.1%(-0.082)#411.1%(-0.057)#8,760
42.968191.0%1.1%(-0.089)#421.1%(-0.064)#8,823
43.967820.93%1.1%(-0.182)#431.1%(-0.156)#9,615
44.967050.91%1.1%(-0.203)#441.1%(-0.177)#9,835
45.968170.88%1.1%(-0.233)#451.1%(-0.207)#10,109
46.967890.88%1.1%(-0.241)#461.1%(-0.215)#10,192
47.967060.86%1.1%(-0.253)#471.1%(-0.227)#10,327
48.967710.81%1.1%(-0.307)#481.1%(-0.282)#10,901
49.967220.76%1.1%(-0.353)#491.1%(-0.328)#11,364
50.967400.71%1.1%(-0.404)#501.1%(-0.378)#11,883
51.967270.70%1.1%(-0.419)#511.1%(-0.394)#12,072
52.967410.69%1.1%(-0.427)#521.1%(-0.402)#12,167
53.967290.60%1.1%(-0.513)#531.1%(-0.487)#13,246
54.968180.59%1.1%(-0.525)#541.1%(-0.499)#13,396
55.967630.59%1.1%(-0.525)#551.1%(-0.500)#13,398
56.967950.56%1.1%(-0.560)#561.1%(-0.534)#13,810
57.967860.54%1.1%(-0.578)#571.1%(-0.552)#14,040
58.967660.53%1.1%(-0.584)#581.1%(-0.558)#14,121
59.967970.48%1.1%(-0.637)#591.1%(-0.611)#14,772
60.967920.44%1.1%(-0.680)#601.1%(-0.655)#15,318
61.967480.41%1.1%(-0.703)#611.1%(-0.677)#15,578
62.967540.41%1.1%(-0.709)#621.1%(-0.684)#15,660
63.967030.40%1.1%(-0.712)#631.1%(-0.687)#15,696
64.967320.33%1.1%(-0.790)#641.1%(-0.764)#16,712
65.967930.30%1.1%(-0.813)#651.1%(-0.788)#17,025
66.967780.27%1.1%(-0.842)#661.1%(-0.816)#17,355
67.967500.25%1.1%(-0.862)#671.1%(-0.837)#17,593
68.967610.25%1.1%(-0.863)#681.1%(-0.838)#17,603
69.967680.23%1.1%(-0.884)#691.1%(-0.858)#17,831

Common Questions

What are the Top 10 Zip Codes with the Highest Percentage of Population Employed in Life, Physical & Social Science in Hawaii?
Top 10 Zip Codes with the Highest Percentage of Population Employed in Life, Physical & Social Science in Hawaii are:
#1
11.5%
#2
7.1%
#3
6.3%
#4
6.2%
#5
5.7%
#6
5.5%
#7
5.1%
#8
5.0%
#9
4.6%
#10
4.2%
What zip code has the Highest Percentage of Population Employed in Life, Physical & Social Science in Hawaii?
96710 has the Highest Percentage of Population Employed in Life, Physical & Social Science in Hawaii with 11.5%.
What is the Percentage of Population Employed in Life, Physical & Social Science in the State of Hawaii?
Percentage of Population Employed in Life, Physical & Social Science in Hawaii is 1.1%.
What is the Percentage of Population Employed in Life, Physical & Social Science in the United States?
Percentage of Population Employed in Life, Physical & Social Science in the United States is 1.1%.