Zip Codes with the Highest Percentage of Population Employed in Life, Physical & Social Science in Arkansas
RELATED REPORTS & OPTIONS
Life, Physical & Social Science
Arkansas
Compare Zip Codes
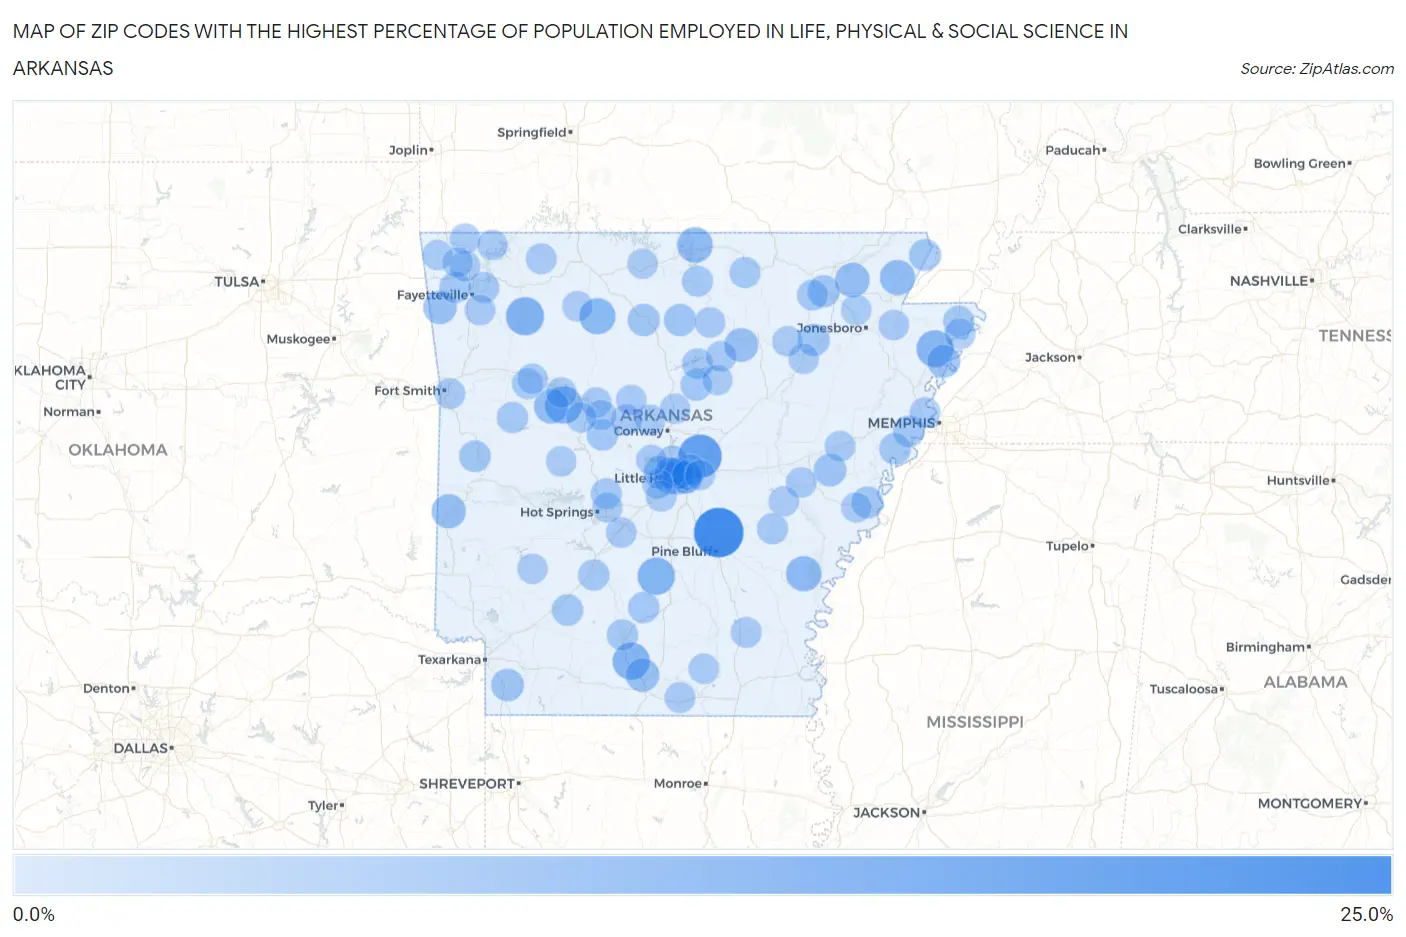
Map of Zip Codes with the Highest Percentage of Population Employed in Life, Physical & Social Science in Arkansas
0.0%
25.0%
Zip Codes with the Highest Percentage of Population Employed in Life, Physical & Social Science in Arkansas
| Zip Code | % Employed | vs State | vs National | |
| 1. | 72152 | 20.1% | 0.65%(+19.5)#1 | 1.1%(+19.1)#62 |
| 2. | 72099 | 13.8% | 0.65%(+13.2)#2 | 1.1%(+12.8)#120 |
| 3. | 72776 | 8.4% | 0.65%(+7.79)#3 | 1.1%(+7.35)#291 |
| 4. | 72835 | 7.8% | 0.65%(+7.18)#4 | 1.1%(+6.74)#335 |
| 5. | 71725 | 7.8% | 0.65%(+7.14)#5 | 1.1%(+6.70)#340 |
| 6. | 71751 | 7.6% | 0.65%(+6.95)#6 | 1.1%(+6.51)#356 |
| 7. | 72351 | 7.4% | 0.65%(+6.78)#7 | 1.1%(+6.34)#368 |
| 8. | 72655 | 6.4% | 0.65%(+5.75)#8 | 1.1%(+5.31)#488 |
| 9. | 72544 | 5.9% | 0.65%(+5.28)#9 | 1.1%(+4.84)#554 |
| 10. | 72166 | 5.7% | 0.65%(+5.03)#10 | 1.1%(+4.59)#592 |
| 11. | 72443 | 5.6% | 0.65%(+4.90)#11 | 1.1%(+4.46)#616 |
| 12. | 72851 | 5.0% | 0.65%(+4.32)#12 | 1.1%(+3.89)#768 |
| 13. | 72449 | 4.8% | 0.65%(+4.11)#13 | 1.1%(+3.67)#831 |
| 14. | 71945 | 4.6% | 0.65%(+3.90)#14 | 1.1%(+3.47)#902 |
| 15. | 72550 | 4.3% | 0.65%(+3.63)#15 | 1.1%(+3.19)#1,014 |
| 16. | 71759 | 3.8% | 0.65%(+3.19)#16 | 1.1%(+2.76)#1,234 |
| 17. | 72744 | 3.7% | 0.65%(+3.01)#17 | 1.1%(+2.57)#1,340 |
| 18. | 72395 | 3.3% | 0.65%(+2.70)#18 | 1.1%(+2.26)#1,535 |
| 19. | 72223 | 3.3% | 0.65%(+2.62)#19 | 1.1%(+2.19)#1,605 |
| 20. | 72368 | 3.2% | 0.65%(+2.54)#20 | 1.1%(+2.10)#1,670 |
| 21. | 71837 | 3.1% | 0.65%(+2.40)#21 | 1.1%(+1.97)#1,811 |
| 22. | 72211 | 3.1% | 0.65%(+2.40)#22 | 1.1%(+1.96)#1,813 |
| 23. | 72201 | 2.9% | 0.65%(+2.27)#23 | 1.1%(+1.83)#1,968 |
| 24. | 72650 | 2.6% | 0.65%(+1.99)#24 | 1.1%(+1.55)#2,324 |
| 25. | 72680 | 2.6% | 0.65%(+1.98)#25 | 1.1%(+1.55)#2,334 |
| 26. | 72473 | 2.6% | 0.65%(+1.98)#26 | 1.1%(+1.54)#2,353 |
| 27. | 72227 | 2.6% | 0.65%(+1.92)#27 | 1.1%(+1.48)#2,435 |
| 28. | 72457 | 2.6% | 0.65%(+1.91)#28 | 1.1%(+1.47)#2,456 |
| 29. | 72430 | 2.3% | 0.65%(+1.67)#29 | 1.1%(+1.23)#2,893 |
| 30. | 72390 | 2.3% | 0.65%(+1.67)#30 | 1.1%(+1.23)#2,902 |
| 31. | 72205 | 2.3% | 0.65%(+1.63)#31 | 1.1%(+1.19)#2,989 |
| 32. | 72958 | 2.2% | 0.65%(+1.50)#32 | 1.1%(+1.07)#3,284 |
| 33. | 72376 | 2.1% | 0.65%(+1.42)#33 | 1.1%(+0.982)#3,485 |
| 34. | 72202 | 2.0% | 0.65%(+1.39)#34 | 1.1%(+0.958)#3,545 |
| 35. | 72348 | 2.0% | 0.65%(+1.38)#35 | 1.1%(+0.946)#3,576 |
| 36. | 72131 | 1.9% | 0.65%(+1.26)#36 | 1.1%(+0.819)#3,942 |
| 37. | 71857 | 1.9% | 0.65%(+1.24)#37 | 1.1%(+0.805)#3,990 |
| 38. | 71720 | 1.9% | 0.65%(+1.21)#38 | 1.1%(+0.775)#4,087 |
| 39. | 72116 | 1.9% | 0.65%(+1.20)#39 | 1.1%(+0.764)#4,123 |
| 40. | 72025 | 1.8% | 0.65%(+1.13)#40 | 1.1%(+0.695)#4,375 |
| 41. | 72704 | 1.8% | 0.65%(+1.12)#41 | 1.1%(+0.680)#4,436 |
| 42. | 71923 | 1.7% | 0.65%(+1.04)#42 | 1.1%(+0.601)#4,771 |
| 43. | 71701 | 1.7% | 0.65%(+1.03)#43 | 1.1%(+0.592)#4,805 |
| 44. | 72207 | 1.7% | 0.65%(+1.03)#44 | 1.1%(+0.588)#4,823 |
| 45. | 72113 | 1.6% | 0.65%(+0.976)#45 | 1.1%(+0.538)#5,035 |
| 46. | 72160 | 1.6% | 0.65%(+0.946)#46 | 1.1%(+0.509)#5,162 |
| 47. | 72943 | 1.5% | 0.65%(+0.884)#47 | 1.1%(+0.446)#5,465 |
| 48. | 72315 | 1.5% | 0.65%(+0.870)#48 | 1.1%(+0.433)#5,526 |
| 49. | 71909 | 1.5% | 0.65%(+0.841)#49 | 1.1%(+0.403)#5,685 |
| 50. | 72512 | 1.5% | 0.65%(+0.839)#50 | 1.1%(+0.402)#5,694 |
| 51. | 72519 | 1.5% | 0.65%(+0.812)#51 | 1.1%(+0.375)#5,840 |
| 52. | 72703 | 1.4% | 0.65%(+0.782)#52 | 1.1%(+0.345)#5,990 |
| 53. | 72458 | 1.4% | 0.65%(+0.704)#53 | 1.1%(+0.267)#6,438 |
| 54. | 72212 | 1.3% | 0.65%(+0.686)#54 | 1.1%(+0.248)#6,541 |
| 55. | 72358 | 1.3% | 0.65%(+0.677)#55 | 1.1%(+0.240)#6,598 |
| 56. | 72067 | 1.3% | 0.65%(+0.661)#56 | 1.1%(+0.223)#6,713 |
| 57. | 72022 | 1.3% | 0.65%(+0.634)#57 | 1.1%(+0.196)#6,887 |
| 58. | 71655 | 1.3% | 0.65%(+0.619)#58 | 1.1%(+0.182)#6,979 |
| 59. | 71765 | 1.3% | 0.65%(+0.608)#59 | 1.1%(+0.171)#7,043 |
| 60. | 72110 | 1.2% | 0.65%(+0.591)#60 | 1.1%(+0.153)#7,179 |
| 61. | 72616 | 1.2% | 0.65%(+0.536)#61 | 1.1%(+0.099)#7,564 |
| 62. | 72832 | 1.2% | 0.65%(+0.509)#62 | 1.1%(+0.072)#7,782 |
| 63. | 72127 | 1.1% | 0.65%(+0.493)#63 | 1.1%(+0.056)#7,882 |
| 64. | 72701 | 1.1% | 0.65%(+0.492)#64 | 1.1%(+0.055)#7,888 |
| 65. | 72029 | 1.1% | 0.65%(+0.438)#65 | 1.1%(+0.001)#8,292 |
| 66. | 72364 | 1.1% | 0.65%(+0.436)#66 | 1.1%(-0.001)#8,306 |
| 67. | 72104 | 1.1% | 0.65%(+0.409)#67 | 1.1%(-0.028)#8,536 |
| 68. | 72372 | 1.1% | 0.65%(+0.409)#68 | 1.1%(-0.029)#8,539 |
| 69. | 72718 | 1.0% | 0.65%(+0.370)#69 | 1.1%(-0.068)#8,856 |
| 70. | 72530 | 1.0% | 0.65%(+0.362)#70 | 1.1%(-0.076)#8,925 |
| 71. | 72437 | 1.00% | 0.65%(+0.342)#71 | 1.1%(-0.095)#9,075 |
| 72. | 72802 | 0.99% | 0.65%(+0.337)#72 | 1.1%(-0.101)#9,122 |
| 73. | 71647 | 0.97% | 0.65%(+0.319)#73 | 1.1%(-0.118)#9,293 |
| 74. | 72560 | 0.97% | 0.65%(+0.316)#74 | 1.1%(-0.122)#9,336 |
| 75. | 72903 | 0.97% | 0.65%(+0.314)#75 | 1.1%(-0.124)#9,350 |
| 76. | 72714 | 0.96% | 0.65%(+0.302)#76 | 1.1%(-0.136)#9,451 |
| 77. | 72063 | 0.94% | 0.65%(+0.285)#77 | 1.1%(-0.153)#9,588 |
| 78. | 72210 | 0.91% | 0.65%(+0.255)#78 | 1.1%(-0.183)#9,882 |
| 79. | 72858 | 0.91% | 0.65%(+0.252)#79 | 1.1%(-0.185)#9,905 |
| 80. | 72114 | 0.90% | 0.65%(+0.250)#80 | 1.1%(-0.187)#9,924 |
| 81. | 72845 | 0.89% | 0.65%(+0.239)#81 | 1.1%(-0.198)#10,025 |
| 82. | 72722 | 0.88% | 0.65%(+0.231)#82 | 1.1%(-0.206)#10,101 |
| 83. | 72857 | 0.88% | 0.65%(+0.231)#83 | 1.1%(-0.206)#10,102 |
| 84. | 72641 | 0.88% | 0.65%(+0.225)#84 | 1.1%(-0.213)#10,161 |
| 85. | 72112 | 0.88% | 0.65%(+0.223)#85 | 1.1%(-0.215)#10,183 |
| 86. | 72416 | 0.87% | 0.65%(+0.218)#86 | 1.1%(-0.219)#10,235 |
| 87. | 71958 | 0.87% | 0.65%(+0.215)#87 | 1.1%(-0.222)#10,276 |
| 88. | 72562 | 0.86% | 0.65%(+0.209)#88 | 1.1%(-0.228)#10,333 |
| 89. | 72058 | 0.86% | 0.65%(+0.202)#89 | 1.1%(-0.235)#10,429 |
| 90. | 72840 | 0.83% | 0.65%(+0.176)#90 | 1.1%(-0.262)#10,698 |
| 91. | 72117 | 0.80% | 0.65%(+0.151)#91 | 1.1%(-0.287)#10,959 |
| 92. | 72355 | 0.80% | 0.65%(+0.149)#92 | 1.1%(-0.288)#10,970 |
| 93. | 72135 | 0.78% | 0.65%(+0.130)#93 | 1.1%(-0.308)#11,164 |
| 94. | 72834 | 0.78% | 0.65%(+0.124)#94 | 1.1%(-0.314)#11,223 |
| 95. | 72170 | 0.78% | 0.65%(+0.122)#95 | 1.1%(-0.316)#11,247 |
| 96. | 72713 | 0.76% | 0.65%(+0.109)#96 | 1.1%(-0.328)#11,369 |
| 97. | 72687 | 0.76% | 0.65%(+0.105)#97 | 1.1%(-0.332)#11,405 |
| 98. | 72732 | 0.75% | 0.65%(+0.099)#98 | 1.1%(-0.339)#11,487 |
| 99. | 72543 | 0.75% | 0.65%(+0.093)#99 | 1.1%(-0.344)#11,551 |
| 100. | 71901 | 0.73% | 0.65%(+0.075)#100 | 1.1%(-0.362)#11,735 |
Common Questions
What are the Top 10 Zip Codes with the Highest Percentage of Population Employed in Life, Physical & Social Science in Arkansas?
Top 10 Zip Codes with the Highest Percentage of Population Employed in Life, Physical & Social Science in Arkansas are:
What zip code has the Highest Percentage of Population Employed in Life, Physical & Social Science in Arkansas?
72152 has the Highest Percentage of Population Employed in Life, Physical & Social Science in Arkansas with 20.1%.
What is the Percentage of Population Employed in Life, Physical & Social Science in the State of Arkansas?
Percentage of Population Employed in Life, Physical & Social Science in Arkansas is 0.65%.
What is the Percentage of Population Employed in Life, Physical & Social Science in the United States?
Percentage of Population Employed in Life, Physical & Social Science in the United States is 1.1%.