Zip Codes with the Highest Percentage of Population Employed in Life, Physical & Social Science in Idaho
RELATED REPORTS & OPTIONS
Life, Physical & Social Science
Idaho
Compare Zip Codes
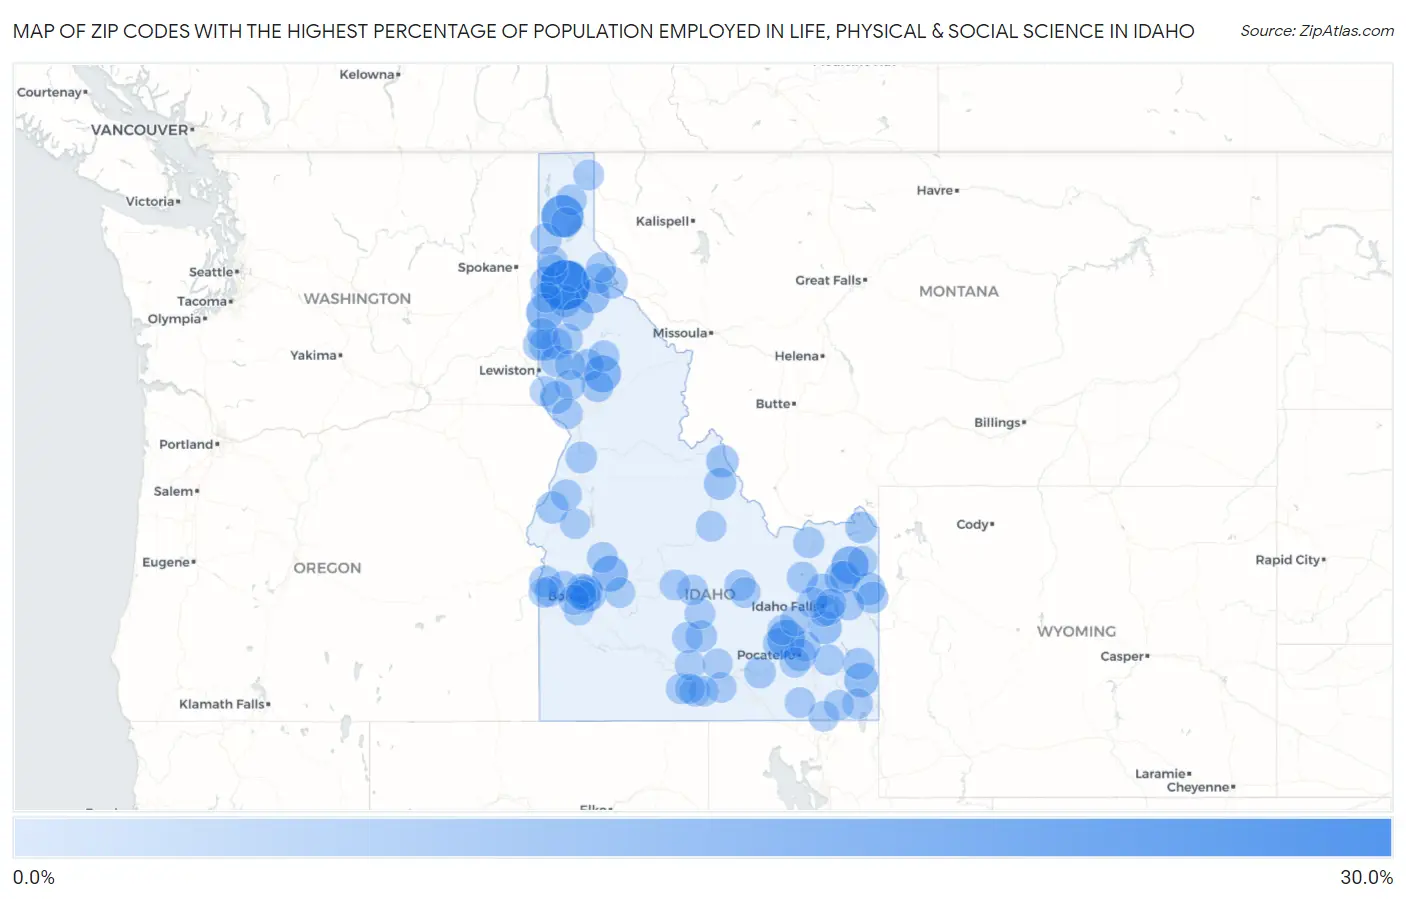
Map of Zip Codes with the Highest Percentage of Population Employed in Life, Physical & Social Science in Idaho
0.0%
30.0%
Zip Codes with the Highest Percentage of Population Employed in Life, Physical & Social Science in Idaho
| Zip Code | % Employed | vs State | vs National | |
| 1. | 83842 | 28.6% | 1.2%(+27.4)#1 | 1.1%(+27.5)#31 |
| 2. | 83825 | 17.9% | 1.2%(+16.8)#2 | 1.1%(+16.9)#76 |
| 3. | 83277 | 11.4% | 1.2%(+10.2)#3 | 1.1%(+10.3)#159 |
| 4. | 83824 | 11.3% | 1.2%(+10.1)#4 | 1.1%(+10.2)#162 |
| 5. | 83421 | 10.8% | 1.2%(+9.63)#5 | 1.1%(+9.69)#179 |
| 6. | 83553 | 10.3% | 1.2%(+9.11)#6 | 1.1%(+9.17)#204 |
| 7. | 83631 | 8.8% | 1.2%(+7.60)#7 | 1.1%(+7.66)#270 |
| 8. | 83239 | 6.8% | 1.2%(+5.62)#8 | 1.1%(+5.68)#432 |
| 9. | 83808 | 6.5% | 1.2%(+5.30)#9 | 1.1%(+5.36)#483 |
| 10. | 83236 | 5.4% | 1.2%(+4.23)#10 | 1.1%(+4.29)#658 |
| 11. | 83448 | 4.9% | 1.2%(+3.76)#11 | 1.1%(+3.82)#789 |
| 12. | 83555 | 4.4% | 1.2%(+3.23)#12 | 1.1%(+3.29)#974 |
| 13. | 83422 | 4.3% | 1.2%(+3.15)#13 | 1.1%(+3.21)#1,005 |
| 14. | 83462 | 4.3% | 1.2%(+3.12)#14 | 1.1%(+3.18)#1,018 |
| 15. | 83846 | 4.1% | 1.2%(+2.94)#15 | 1.1%(+3.00)#1,104 |
| 16. | 83431 | 4.1% | 1.2%(+2.92)#16 | 1.1%(+2.99)#1,111 |
| 17. | 83209 | 4.0% | 1.2%(+2.85)#17 | 1.1%(+2.91)#1,148 |
| 18. | 83610 | 3.8% | 1.2%(+2.67)#18 | 1.1%(+2.73)#1,254 |
| 19. | 83467 | 3.8% | 1.2%(+2.64)#19 | 1.1%(+2.70)#1,268 |
| 20. | 83861 | 3.5% | 1.2%(+2.39)#20 | 1.1%(+2.45)#1,393 |
| 21. | 83876 | 3.4% | 1.2%(+2.30)#21 | 1.1%(+2.36)#1,458 |
| 22. | 83830 | 3.3% | 1.2%(+2.18)#22 | 1.1%(+2.24)#1,549 |
| 23. | 83544 | 3.3% | 1.2%(+2.18)#23 | 1.1%(+2.24)#1,551 |
| 24. | 83455 | 3.3% | 1.2%(+2.12)#24 | 1.1%(+2.18)#1,608 |
| 25. | 83429 | 3.1% | 1.2%(+1.91)#25 | 1.1%(+1.97)#1,807 |
| 26. | 83843 | 3.0% | 1.2%(+1.90)#26 | 1.1%(+1.96)#1,824 |
| 27. | 83871 | 3.0% | 1.2%(+1.89)#27 | 1.1%(+1.95)#1,827 |
| 28. | 83536 | 3.0% | 1.2%(+1.87)#28 | 1.1%(+1.93)#1,857 |
| 29. | 83660 | 3.0% | 1.2%(+1.83)#29 | 1.1%(+1.89)#1,904 |
| 30. | 83276 | 3.0% | 1.2%(+1.82)#30 | 1.1%(+1.88)#1,912 |
| 31. | 83712 | 3.0% | 1.2%(+1.82)#31 | 1.1%(+1.88)#1,918 |
| 32. | 83349 | 3.0% | 1.2%(+1.80)#32 | 1.1%(+1.86)#1,934 |
| 33. | 83211 | 2.9% | 1.2%(+1.76)#33 | 1.1%(+1.82)#1,981 |
| 34. | 83844 | 2.9% | 1.2%(+1.75)#34 | 1.1%(+1.81)#1,991 |
| 35. | 83210 | 2.8% | 1.2%(+1.69)#35 | 1.1%(+1.75)#2,066 |
| 36. | 83535 | 2.8% | 1.2%(+1.64)#36 | 1.1%(+1.70)#2,125 |
| 37. | 83549 | 2.7% | 1.2%(+1.58)#37 | 1.1%(+1.64)#2,212 |
| 38. | 83450 | 2.7% | 1.2%(+1.57)#38 | 1.1%(+1.63)#2,226 |
| 39. | 83546 | 2.6% | 1.2%(+1.50)#39 | 1.1%(+1.56)#2,316 |
| 40. | 83703 | 2.6% | 1.2%(+1.43)#40 | 1.1%(+1.49)#2,433 |
| 41. | 83869 | 2.4% | 1.2%(+1.29)#41 | 1.1%(+1.35)#2,681 |
| 42. | 83255 | 2.4% | 1.2%(+1.24)#42 | 1.1%(+1.30)#2,772 |
| 43. | 83612 | 2.4% | 1.2%(+1.24)#43 | 1.1%(+1.30)#2,778 |
| 44. | 83872 | 2.4% | 1.2%(+1.24)#44 | 1.1%(+1.30)#2,785 |
| 45. | 83810 | 2.2% | 1.2%(+1.05)#45 | 1.1%(+1.11)#3,189 |
| 46. | 83451 | 2.2% | 1.2%(+1.02)#46 | 1.1%(+1.08)#3,252 |
| 47. | 83406 | 2.1% | 1.2%(+0.981)#47 | 1.1%(+1.04)#3,342 |
| 48. | 83423 | 2.1% | 1.2%(+0.971)#48 | 1.1%(+1.03)#3,363 |
| 49. | 83622 | 2.1% | 1.2%(+0.942)#49 | 1.1%(+1.00)#3,441 |
| 50. | 83404 | 2.0% | 1.2%(+0.874)#50 | 1.1%(+0.934)#3,611 |
| 51. | 83217 | 2.0% | 1.2%(+0.837)#51 | 1.1%(+0.897)#3,725 |
| 52. | 83864 | 1.9% | 1.2%(+0.795)#52 | 1.1%(+0.855)#3,841 |
| 53. | 83352 | 1.9% | 1.2%(+0.756)#53 | 1.1%(+0.817)#3,950 |
| 54. | 83213 | 1.9% | 1.2%(+0.736)#54 | 1.1%(+0.796)#4,021 |
| 55. | 83443 | 1.8% | 1.2%(+0.670)#55 | 1.1%(+0.731)#4,254 |
| 56. | 83313 | 1.8% | 1.2%(+0.618)#56 | 1.1%(+0.678)#4,450 |
| 57. | 83702 | 1.7% | 1.2%(+0.587)#57 | 1.1%(+0.647)#4,563 |
| 58. | 83814 | 1.7% | 1.2%(+0.582)#58 | 1.1%(+0.643)#4,577 |
| 59. | 83644 | 1.7% | 1.2%(+0.576)#59 | 1.1%(+0.636)#4,606 |
| 60. | 83301 | 1.7% | 1.2%(+0.530)#60 | 1.1%(+0.590)#4,814 |
| 61. | 83202 | 1.7% | 1.2%(+0.504)#61 | 1.1%(+0.564)#4,922 |
| 62. | 83626 | 1.6% | 1.2%(+0.496)#62 | 1.1%(+0.557)#4,960 |
| 63. | 83353 | 1.6% | 1.2%(+0.480)#63 | 1.1%(+0.541)#5,026 |
| 64. | 83402 | 1.6% | 1.2%(+0.478)#64 | 1.1%(+0.539)#5,033 |
| 65. | 83860 | 1.6% | 1.2%(+0.462)#65 | 1.1%(+0.522)#5,098 |
| 66. | 83226 | 1.6% | 1.2%(+0.444)#66 | 1.1%(+0.505)#5,181 |
| 67. | 83340 | 1.6% | 1.2%(+0.437)#67 | 1.1%(+0.497)#5,209 |
| 68. | 83261 | 1.6% | 1.2%(+0.436)#68 | 1.1%(+0.496)#5,217 |
| 69. | 83845 | 1.6% | 1.2%(+0.402)#69 | 1.1%(+0.462)#5,365 |
| 70. | 83823 | 1.5% | 1.2%(+0.359)#70 | 1.1%(+0.420)#5,605 |
| 71. | 83286 | 1.5% | 1.2%(+0.356)#71 | 1.1%(+0.416)#5,622 |
| 72. | 83706 | 1.5% | 1.2%(+0.346)#72 | 1.1%(+0.407)#5,673 |
| 73. | 83815 | 1.5% | 1.2%(+0.335)#73 | 1.1%(+0.395)#5,727 |
| 74. | 83523 | 1.4% | 1.2%(+0.286)#74 | 1.1%(+0.346)#5,982 |
| 75. | 83318 | 1.4% | 1.2%(+0.280)#75 | 1.1%(+0.341)#6,015 |
| 76. | 83634 | 1.4% | 1.2%(+0.279)#76 | 1.1%(+0.339)#6,024 |
| 77. | 83522 | 1.4% | 1.2%(+0.273)#77 | 1.1%(+0.333)#6,061 |
| 78. | 83252 | 1.4% | 1.2%(+0.252)#78 | 1.1%(+0.312)#6,171 |
| 79. | 83401 | 1.3% | 1.2%(+0.188)#79 | 1.1%(+0.248)#6,540 |
| 80. | 83334 | 1.3% | 1.2%(+0.174)#80 | 1.1%(+0.235)#6,628 |
| 81. | 83263 | 1.3% | 1.2%(+0.147)#81 | 1.1%(+0.207)#6,823 |
| 82. | 83716 | 1.3% | 1.2%(+0.117)#82 | 1.1%(+0.178)#7,015 |
| 83. | 83338 | 1.2% | 1.2%(+0.079)#83 | 1.1%(+0.139)#7,264 |
| 84. | 83347 | 1.2% | 1.2%(+0.077)#84 | 1.1%(+0.137)#7,280 |
| 85. | 83344 | 1.2% | 1.2%(+0.070)#85 | 1.1%(+0.131)#7,331 |
| 86. | 83501 | 1.2% | 1.2%(+0.059)#86 | 1.1%(+0.119)#7,416 |
| 87. | 83204 | 1.2% | 1.2%(+0.052)#87 | 1.1%(+0.113)#7,475 |
| 88. | 83262 | 1.2% | 1.2%(+0.045)#88 | 1.1%(+0.106)#7,519 |
| 89. | 83632 | 1.2% | 1.2%(+0.030)#89 | 1.1%(+0.090)#7,629 |
| 90. | 83714 | 1.2% | 1.2%(+0.024)#90 | 1.1%(+0.084)#7,682 |
| 91. | 83642 | 1.2% | 1.2%(+0.020)#91 | 1.1%(+0.080)#7,722 |
| 92. | 83541 | 1.2% | 1.2%(+0.003)#92 | 1.1%(+0.064)#7,828 |
| 93. | 83851 | 1.1% | 1.2%(-0.004)#93 | 1.1%(+0.056)#7,879 |
| 94. | 83704 | 1.1% | 1.2%(-0.012)#94 | 1.1%(+0.048)#7,944 |
| 95. | 83341 | 1.1% | 1.2%(-0.027)#95 | 1.1%(+0.033)#8,042 |
| 96. | 83420 | 1.1% | 1.2%(-0.039)#96 | 1.1%(+0.021)#8,133 |
| 97. | 83221 | 1.1% | 1.2%(-0.040)#97 | 1.1%(+0.021)#8,136 |
| 98. | 83849 | 1.1% | 1.2%(-0.049)#98 | 1.1%(+0.011)#8,201 |
| 99. | 83676 | 1.1% | 1.2%(-0.054)#99 | 1.1%(+0.007)#8,245 |
| 100. | 83873 | 1.1% | 1.2%(-0.064)#100 | 1.1%(-0.004)#8,324 |
Common Questions
What are the Top 10 Zip Codes with the Highest Percentage of Population Employed in Life, Physical & Social Science in Idaho?
Top 10 Zip Codes with the Highest Percentage of Population Employed in Life, Physical & Social Science in Idaho are:
What zip code has the Highest Percentage of Population Employed in Life, Physical & Social Science in Idaho?
83842 has the Highest Percentage of Population Employed in Life, Physical & Social Science in Idaho with 28.6%.
What is the Percentage of Population Employed in Life, Physical & Social Science in the State of Idaho?
Percentage of Population Employed in Life, Physical & Social Science in Idaho is 1.2%.
What is the Percentage of Population Employed in Life, Physical & Social Science in the United States?
Percentage of Population Employed in Life, Physical & Social Science in the United States is 1.1%.