Zip Codes with the Highest Percentage of Population Employed in Life, Physical & Social Science in Colorado
RELATED REPORTS & OPTIONS
Life, Physical & Social Science
Colorado
Compare Zip Codes
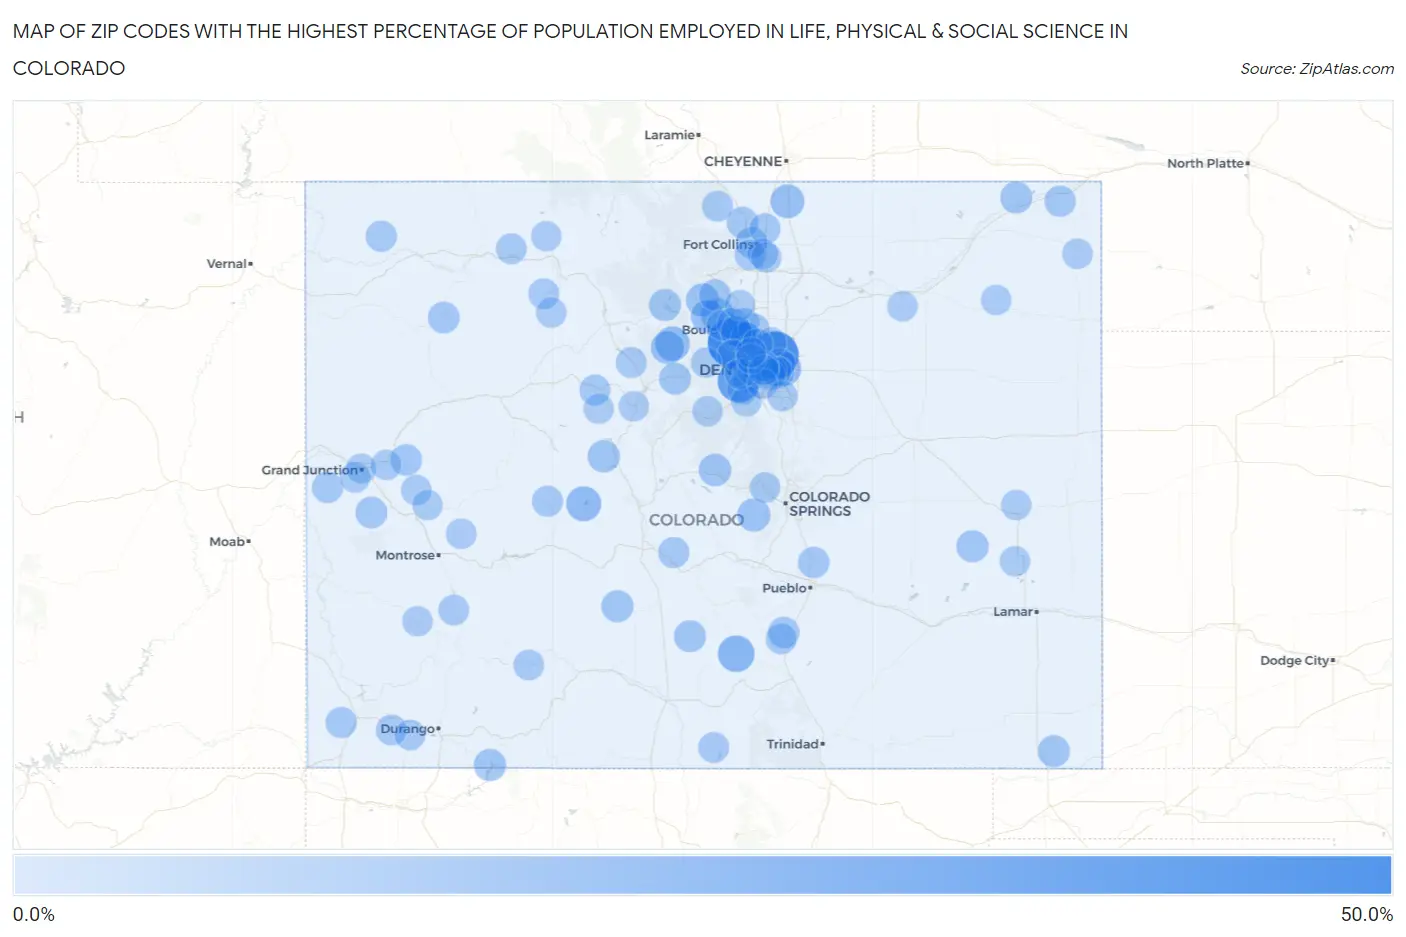
Map of Zip Codes with the Highest Percentage of Population Employed in Life, Physical & Social Science in Colorado
0.0%
50.0%
Zip Codes with the Highest Percentage of Population Employed in Life, Physical & Social Science in Colorado
| Zip Code | % Employed | vs State | vs National | |
| 1. | 80025 | 42.9% | 1.3%(+41.5)#1 | 1.1%(+41.8)#9 |
| 2. | 80024 | 38.2% | 1.3%(+36.9)#2 | 1.1%(+37.1)#17 |
| 3. | 80453 | 27.0% | 1.3%(+25.7)#3 | 1.1%(+25.9)#37 |
| 4. | 81040 | 14.9% | 1.3%(+13.5)#4 | 1.1%(+13.8)#104 |
| 5. | 81210 | 11.3% | 1.3%(+9.99)#5 | 1.1%(+10.2)#161 |
| 6. | 80045 | 11.2% | 1.3%(+9.85)#6 | 1.1%(+10.1)#166 |
| 7. | 80482 | 10.7% | 1.3%(+9.43)#7 | 1.1%(+9.65)#181 |
| 8. | 80612 | 9.0% | 1.3%(+7.73)#8 | 1.1%(+7.96)#255 |
| 9. | 80455 | 8.4% | 1.3%(+7.09)#9 | 1.1%(+7.31)#294 |
| 10. | 80510 | 7.8% | 1.3%(+6.51)#10 | 1.1%(+6.74)#336 |
| 11. | 80442 | 7.8% | 1.3%(+6.44)#11 | 1.1%(+6.67)#345 |
| 12. | 80813 | 7.7% | 1.3%(+6.42)#12 | 1.1%(+6.65)#346 |
| 13. | 80481 | 7.7% | 1.3%(+6.41)#13 | 1.1%(+6.63)#348 |
| 14. | 80305 | 7.0% | 1.3%(+5.69)#14 | 1.1%(+5.92)#405 |
| 15. | 80827 | 6.3% | 1.3%(+5.02)#15 | 1.1%(+5.25)#495 |
| 16. | 80303 | 6.2% | 1.3%(+4.92)#16 | 1.1%(+5.14)#514 |
| 17. | 81251 | 6.2% | 1.3%(+4.84)#17 | 1.1%(+5.06)#525 |
| 18. | 81121 | 5.8% | 1.3%(+4.52)#18 | 1.1%(+4.74)#568 |
| 19. | 81149 | 5.4% | 1.3%(+4.08)#19 | 1.1%(+4.31)#653 |
| 20. | 80446 | 5.3% | 1.3%(+4.00)#20 | 1.1%(+4.22)#681 |
| 21. | 81029 | 5.3% | 1.3%(+3.95)#21 | 1.1%(+4.17)#695 |
| 22. | 81045 | 5.3% | 1.3%(+3.95)#22 | 1.1%(+4.17)#699 |
| 23. | 81131 | 5.2% | 1.3%(+3.89)#23 | 1.1%(+4.11)#709 |
| 24. | 80726 | 4.9% | 1.3%(+3.59)#24 | 1.1%(+3.82)#791 |
| 25. | 80476 | 4.9% | 1.3%(+3.54)#25 | 1.1%(+3.76)#806 |
| 26. | 80301 | 4.7% | 1.3%(+3.42)#26 | 1.1%(+3.65)#835 |
| 27. | 81641 | 4.7% | 1.3%(+3.42)#27 | 1.1%(+3.64)#836 |
| 28. | 80540 | 4.7% | 1.3%(+3.41)#28 | 1.1%(+3.64)#839 |
| 29. | 81527 | 4.7% | 1.3%(+3.33)#29 | 1.1%(+3.56)#866 |
| 30. | 80535 | 4.5% | 1.3%(+3.17)#30 | 1.1%(+3.40)#933 |
| 31. | 81643 | 4.5% | 1.3%(+3.16)#31 | 1.1%(+3.39)#935 |
| 32. | 81019 | 4.3% | 1.3%(+2.95)#32 | 1.1%(+3.18)#1,019 |
| 33. | 80521 | 4.1% | 1.3%(+2.74)#33 | 1.1%(+2.97)#1,118 |
| 34. | 81008 | 4.1% | 1.3%(+2.74)#34 | 1.1%(+2.97)#1,119 |
| 35. | 80302 | 4.0% | 1.3%(+2.66)#35 | 1.1%(+2.89)#1,165 |
| 36. | 80744 | 3.9% | 1.3%(+2.62)#36 | 1.1%(+2.85)#1,192 |
| 37. | 80304 | 3.9% | 1.3%(+2.61)#37 | 1.1%(+2.84)#1,199 |
| 38. | 81640 | 3.7% | 1.3%(+2.39)#38 | 1.1%(+2.61)#1,315 |
| 39. | 81523 | 3.5% | 1.3%(+2.22)#39 | 1.1%(+2.45)#1,395 |
| 40. | 81233 | 3.5% | 1.3%(+2.22)#40 | 1.1%(+2.45)#1,398 |
| 41. | 80230 | 3.4% | 1.3%(+2.11)#41 | 1.1%(+2.34)#1,475 |
| 42. | 81321 | 3.4% | 1.3%(+2.08)#42 | 1.1%(+2.30)#1,504 |
| 43. | 80228 | 3.4% | 1.3%(+2.06)#43 | 1.1%(+2.29)#1,509 |
| 44. | 80524 | 3.4% | 1.3%(+2.05)#44 | 1.1%(+2.28)#1,519 |
| 45. | 80465 | 3.4% | 1.3%(+2.05)#45 | 1.1%(+2.27)#1,524 |
| 46. | 80026 | 3.3% | 1.3%(+1.94)#46 | 1.1%(+2.16)#1,621 |
| 47. | 81224 | 3.2% | 1.3%(+1.93)#47 | 1.1%(+2.15)#1,630 |
| 48. | 80027 | 3.2% | 1.3%(+1.91)#48 | 1.1%(+2.14)#1,646 |
| 49. | 81620 | 3.1% | 1.3%(+1.82)#49 | 1.1%(+2.05)#1,717 |
| 50. | 80536 | 3.1% | 1.3%(+1.79)#50 | 1.1%(+2.02)#1,749 |
| 51. | 81069 | 3.1% | 1.3%(+1.78)#51 | 1.1%(+2.00)#1,769 |
| 52. | 80310 | 3.0% | 1.3%(+1.67)#52 | 1.1%(+1.90)#1,891 |
| 53. | 80526 | 3.0% | 1.3%(+1.66)#53 | 1.1%(+1.89)#1,902 |
| 54. | 80467 | 2.9% | 1.3%(+1.62)#54 | 1.1%(+1.85)#1,944 |
| 55. | 81152 | 2.9% | 1.3%(+1.60)#55 | 1.1%(+1.83)#1,972 |
| 56. | 80238 | 2.8% | 1.3%(+1.53)#56 | 1.1%(+1.76)#2,053 |
| 57. | 80498 | 2.8% | 1.3%(+1.52)#57 | 1.1%(+1.75)#2,064 |
| 58. | 81328 | 2.8% | 1.3%(+1.52)#58 | 1.1%(+1.74)#2,071 |
| 59. | 80206 | 2.8% | 1.3%(+1.52)#59 | 1.1%(+1.74)#2,075 |
| 60. | 81639 | 2.8% | 1.3%(+1.45)#60 | 1.1%(+1.67)#2,159 |
| 61. | 80403 | 2.6% | 1.3%(+1.33)#61 | 1.1%(+1.56)#2,315 |
| 62. | 80525 | 2.5% | 1.3%(+1.19)#62 | 1.1%(+1.41)#2,563 |
| 63. | 80033 | 2.5% | 1.3%(+1.19)#63 | 1.1%(+1.41)#2,564 |
| 64. | 81130 | 2.4% | 1.3%(+1.10)#64 | 1.1%(+1.33)#2,716 |
| 65. | 80819 | 2.4% | 1.3%(+1.09)#65 | 1.1%(+1.31)#2,755 |
| 66. | 80215 | 2.4% | 1.3%(+1.06)#66 | 1.1%(+1.29)#2,791 |
| 67. | 81326 | 2.4% | 1.3%(+1.06)#67 | 1.1%(+1.29)#2,801 |
| 68. | 80127 | 2.3% | 1.3%(+0.989)#68 | 1.1%(+1.22)#2,946 |
| 69. | 81432 | 2.3% | 1.3%(+0.986)#69 | 1.1%(+1.21)#2,953 |
| 70. | 80483 | 2.3% | 1.3%(+0.963)#70 | 1.1%(+1.19)#2,995 |
| 71. | 80209 | 2.3% | 1.3%(+0.957)#71 | 1.1%(+1.18)#3,010 |
| 72. | 80401 | 2.3% | 1.3%(+0.942)#72 | 1.1%(+1.17)#3,036 |
| 73. | 80427 | 2.2% | 1.3%(+0.889)#73 | 1.1%(+1.12)#3,159 |
| 74. | 80734 | 2.2% | 1.3%(+0.854)#74 | 1.1%(+1.08)#3,246 |
| 75. | 81507 | 2.2% | 1.3%(+0.841)#75 | 1.1%(+1.07)#3,278 |
| 76. | 81415 | 2.2% | 1.3%(+0.841)#76 | 1.1%(+1.07)#3,279 |
| 77. | 81526 | 2.2% | 1.3%(+0.833)#77 | 1.1%(+1.06)#3,298 |
| 78. | 80220 | 2.1% | 1.3%(+0.753)#78 | 1.1%(+0.980)#3,489 |
| 79. | 81418 | 2.1% | 1.3%(+0.742)#79 | 1.1%(+0.970)#3,514 |
| 80. | 80241 | 2.1% | 1.3%(+0.735)#80 | 1.1%(+0.962)#3,536 |
| 81. | 80421 | 2.1% | 1.3%(+0.734)#81 | 1.1%(+0.961)#3,538 |
| 82. | 80211 | 2.0% | 1.3%(+0.718)#82 | 1.1%(+0.946)#3,580 |
| 83. | 80701 | 2.0% | 1.3%(+0.708)#83 | 1.1%(+0.935)#3,607 |
| 84. | 81430 | 2.0% | 1.3%(+0.691)#84 | 1.1%(+0.918)#3,661 |
| 85. | 80020 | 2.0% | 1.3%(+0.676)#85 | 1.1%(+0.903)#3,700 |
| 86. | 80743 | 2.0% | 1.3%(+0.671)#86 | 1.1%(+0.898)#3,720 |
| 87. | 80825 | 2.0% | 1.3%(+0.662)#87 | 1.1%(+0.889)#3,745 |
| 88. | 81645 | 2.0% | 1.3%(+0.659)#88 | 1.1%(+0.886)#3,752 |
| 89. | 80236 | 2.0% | 1.3%(+0.654)#89 | 1.1%(+0.881)#3,766 |
| 90. | 80004 | 2.0% | 1.3%(+0.652)#90 | 1.1%(+0.879)#3,774 |
| 91. | 81036 | 2.0% | 1.3%(+0.643)#91 | 1.1%(+0.870)#3,799 |
| 92. | 81410 | 2.0% | 1.3%(+0.636)#92 | 1.1%(+0.863)#3,814 |
| 93. | 80528 | 1.9% | 1.3%(+0.630)#93 | 1.1%(+0.857)#3,833 |
| 94. | 81501 | 1.9% | 1.3%(+0.629)#94 | 1.1%(+0.857)#3,838 |
| 95. | 80112 | 1.9% | 1.3%(+0.624)#95 | 1.1%(+0.851)#3,850 |
| 96. | 80204 | 1.9% | 1.3%(+0.606)#96 | 1.1%(+0.833)#3,902 |
| 97. | 80005 | 1.9% | 1.3%(+0.585)#97 | 1.1%(+0.812)#3,968 |
| 98. | 80503 | 1.9% | 1.3%(+0.570)#98 | 1.1%(+0.797)#4,013 |
| 99. | 80443 | 1.9% | 1.3%(+0.566)#99 | 1.1%(+0.793)#4,028 |
| 100. | 80487 | 1.9% | 1.3%(+0.563)#100 | 1.1%(+0.790)#4,035 |
Common Questions
What are the Top 10 Zip Codes with the Highest Percentage of Population Employed in Life, Physical & Social Science in Colorado?
Top 10 Zip Codes with the Highest Percentage of Population Employed in Life, Physical & Social Science in Colorado are:
What zip code has the Highest Percentage of Population Employed in Life, Physical & Social Science in Colorado?
80025 has the Highest Percentage of Population Employed in Life, Physical & Social Science in Colorado with 42.9%.
What is the Percentage of Population Employed in Life, Physical & Social Science in the State of Colorado?
Percentage of Population Employed in Life, Physical & Social Science in Colorado is 1.3%.
What is the Percentage of Population Employed in Life, Physical & Social Science in the United States?
Percentage of Population Employed in Life, Physical & Social Science in the United States is 1.1%.