Zip Codes with the Highest Percentage of Population Employed in Life, Physical & Social Science in Ohio
RELATED REPORTS & OPTIONS
Life, Physical & Social Science
Ohio
Compare Zip Codes
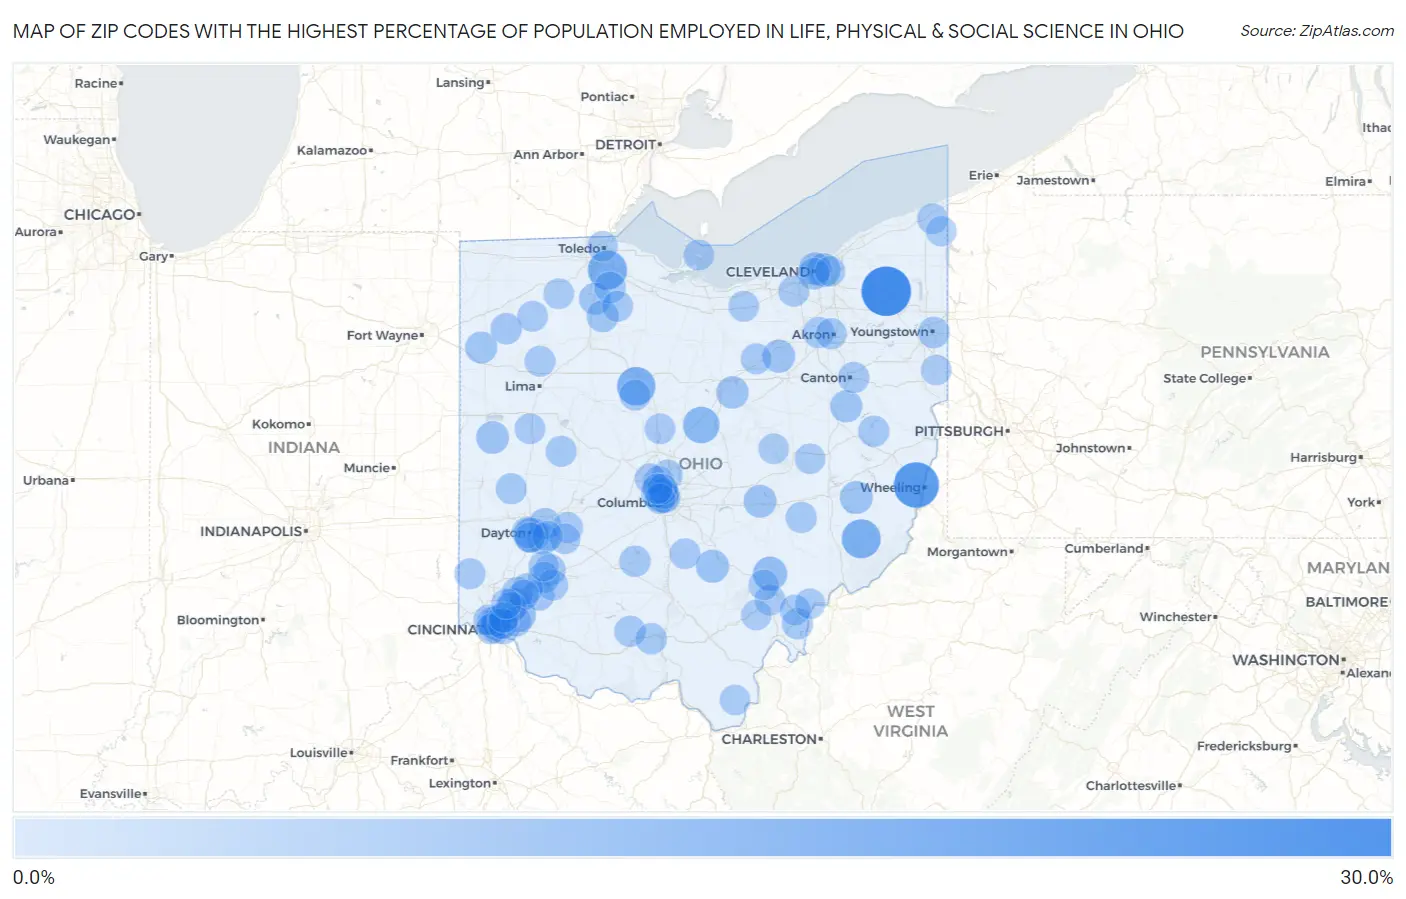
Map of Zip Codes with the Highest Percentage of Population Employed in Life, Physical & Social Science in Ohio
0.0%
30.0%
Zip Codes with the Highest Percentage of Population Employed in Life, Physical & Social Science in Ohio
| Zip Code | % Employed | vs State | vs National | |
| 1. | 44080 | 30.0% | 0.90%(+29.1)#1 | 1.1%(+28.9)#28 |
| 2. | 43934 | 23.8% | 0.90%(+22.9)#2 | 1.1%(+22.7)#43 |
| 3. | 43463 | 14.7% | 0.90%(+13.8)#3 | 1.1%(+13.6)#106 |
| 4. | 43786 | 14.3% | 0.90%(+13.4)#4 | 1.1%(+13.2)#115 |
| 5. | 43323 | 13.5% | 0.90%(+12.6)#5 | 1.1%(+12.4)#124 |
| 6. | 43317 | 10.6% | 0.90%(+9.71)#6 | 1.1%(+9.52)#188 |
| 7. | 45469 | 8.5% | 0.90%(+7.58)#7 | 1.1%(+7.38)#287 |
| 8. | 45740 | 7.5% | 0.90%(+6.59)#8 | 1.1%(+6.39)#363 |
| 9. | 45111 | 7.2% | 0.90%(+6.28)#9 | 1.1%(+6.09)#391 |
| 10. | 44106 | 6.3% | 0.90%(+5.38)#10 | 1.1%(+5.19)#508 |
| 11. | 43149 | 5.9% | 0.90%(+4.96)#11 | 1.1%(+4.77)#562 |
| 12. | 43210 | 5.7% | 0.90%(+4.76)#12 | 1.1%(+4.57)#598 |
| 13. | 44214 | 5.6% | 0.90%(+4.69)#13 | 1.1%(+4.50)#609 |
| 14. | 43773 | 5.4% | 0.90%(+4.54)#14 | 1.1%(+4.35)#641 |
| 15. | 43746 | 5.4% | 0.90%(+4.49)#15 | 1.1%(+4.30)#657 |
| 16. | 45860 | 5.2% | 0.90%(+4.33)#16 | 1.1%(+4.13)#704 |
| 17. | 44114 | 5.2% | 0.90%(+4.31)#17 | 1.1%(+4.11)#708 |
| 18. | 45249 | 5.1% | 0.90%(+4.24)#18 | 1.1%(+4.05)#722 |
| 19. | 44843 | 4.9% | 0.90%(+4.02)#19 | 1.1%(+3.82)#785 |
| 20. | 44697 | 4.6% | 0.90%(+3.69)#20 | 1.1%(+3.50)#892 |
| 21. | 43451 | 4.4% | 0.90%(+3.54)#21 | 1.1%(+3.35)#950 |
| 22. | 44817 | 4.3% | 0.90%(+3.36)#22 | 1.1%(+3.17)#1,022 |
| 23. | 45886 | 4.2% | 0.90%(+3.28)#23 | 1.1%(+3.09)#1,059 |
| 24. | 44113 | 3.8% | 0.90%(+2.87)#24 | 1.1%(+2.68)#1,280 |
| 25. | 43450 | 3.7% | 0.90%(+2.79)#25 | 1.1%(+2.60)#1,321 |
| 26. | 45433 | 3.7% | 0.90%(+2.77)#26 | 1.1%(+2.57)#1,335 |
| 27. | 44502 | 3.7% | 0.90%(+2.76)#27 | 1.1%(+2.57)#1,339 |
| 28. | 45032 | 3.7% | 0.90%(+2.76)#28 | 1.1%(+2.56)#1,343 |
| 29. | 45430 | 3.6% | 0.90%(+2.72)#29 | 1.1%(+2.53)#1,360 |
| 30. | 43221 | 3.5% | 0.90%(+2.59)#30 | 1.1%(+2.40)#1,429 |
| 31. | 45152 | 3.4% | 0.90%(+2.53)#31 | 1.1%(+2.34)#1,478 |
| 32. | 45873 | 3.4% | 0.90%(+2.53)#32 | 1.1%(+2.33)#1,484 |
| 33. | 43145 | 3.4% | 0.90%(+2.46)#33 | 1.1%(+2.27)#1,531 |
| 34. | 45646 | 3.3% | 0.90%(+2.38)#34 | 1.1%(+2.19)#1,602 |
| 35. | 44321 | 3.3% | 0.90%(+2.37)#35 | 1.1%(+2.18)#1,614 |
| 36. | 45661 | 3.3% | 0.90%(+2.36)#36 | 1.1%(+2.17)#1,617 |
| 37. | 44695 | 3.3% | 0.90%(+2.36)#37 | 1.1%(+2.17)#1,619 |
| 38. | 45402 | 3.2% | 0.90%(+2.33)#38 | 1.1%(+2.13)#1,651 |
| 39. | 44704 | 3.2% | 0.90%(+2.28)#39 | 1.1%(+2.08)#1,687 |
| 40. | 45054 | 3.2% | 0.90%(+2.27)#40 | 1.1%(+2.07)#1,693 |
| 41. | 45772 | 3.1% | 0.90%(+2.21)#41 | 1.1%(+2.02)#1,746 |
| 42. | 45040 | 3.1% | 0.90%(+2.21)#42 | 1.1%(+2.01)#1,750 |
| 43. | 45113 | 3.1% | 0.90%(+2.20)#43 | 1.1%(+2.01)#1,765 |
| 44. | 45202 | 3.1% | 0.90%(+2.18)#44 | 1.1%(+1.99)#1,783 |
| 45. | 43727 | 3.0% | 0.90%(+2.15)#45 | 1.1%(+1.95)#1,829 |
| 46. | 45220 | 3.0% | 0.90%(+2.11)#46 | 1.1%(+1.92)#1,867 |
| 47. | 45065 | 3.0% | 0.90%(+2.11)#47 | 1.1%(+1.92)#1,868 |
| 48. | 45206 | 2.9% | 0.90%(+1.98)#48 | 1.1%(+1.79)#2,014 |
| 49. | 44302 | 2.9% | 0.90%(+1.98)#49 | 1.1%(+1.79)#2,018 |
| 50. | 45359 | 2.9% | 0.90%(+1.98)#50 | 1.1%(+1.79)#2,019 |
| 51. | 43318 | 2.9% | 0.90%(+1.97)#51 | 1.1%(+1.78)#2,029 |
| 52. | 43457 | 2.9% | 0.90%(+1.96)#52 | 1.1%(+1.77)#2,042 |
| 53. | 43337 | 2.8% | 0.90%(+1.95)#53 | 1.1%(+1.76)#2,056 |
| 54. | 45387 | 2.8% | 0.90%(+1.88)#54 | 1.1%(+1.69)#2,138 |
| 55. | 45056 | 2.7% | 0.90%(+1.79)#55 | 1.1%(+1.60)#2,259 |
| 56. | 44017 | 2.7% | 0.90%(+1.77)#56 | 1.1%(+1.58)#2,281 |
| 57. | 43240 | 2.7% | 0.90%(+1.77)#57 | 1.1%(+1.58)#2,288 |
| 58. | 43201 | 2.7% | 0.90%(+1.76)#58 | 1.1%(+1.57)#2,302 |
| 59. | 44866 | 2.7% | 0.90%(+1.76)#59 | 1.1%(+1.56)#2,305 |
| 60. | 45701 | 2.6% | 0.90%(+1.73)#60 | 1.1%(+1.54)#2,351 |
| 61. | 43235 | 2.6% | 0.90%(+1.72)#61 | 1.1%(+1.52)#2,368 |
| 62. | 45226 | 2.6% | 0.90%(+1.71)#62 | 1.1%(+1.52)#2,371 |
| 63. | 45830 | 2.6% | 0.90%(+1.70)#63 | 1.1%(+1.51)#2,391 |
| 64. | 45039 | 2.6% | 0.90%(+1.69)#64 | 1.1%(+1.49)#2,424 |
| 65. | 45723 | 2.5% | 0.90%(+1.64)#65 | 1.1%(+1.45)#2,498 |
| 66. | 45229 | 2.5% | 0.90%(+1.60)#66 | 1.1%(+1.41)#2,569 |
| 67. | 43548 | 2.5% | 0.90%(+1.59)#67 | 1.1%(+1.40)#2,594 |
| 68. | 45223 | 2.5% | 0.90%(+1.58)#68 | 1.1%(+1.39)#2,608 |
| 69. | 45242 | 2.5% | 0.90%(+1.58)#69 | 1.1%(+1.38)#2,612 |
| 70. | 45203 | 2.5% | 0.90%(+1.56)#70 | 1.1%(+1.37)#2,644 |
| 71. | 45306 | 2.4% | 0.90%(+1.53)#71 | 1.1%(+1.34)#2,700 |
| 72. | 43202 | 2.4% | 0.90%(+1.52)#72 | 1.1%(+1.33)#2,713 |
| 73. | 43017 | 2.4% | 0.90%(+1.52)#73 | 1.1%(+1.32)#2,730 |
| 74. | 43438 | 2.4% | 0.90%(+1.51)#74 | 1.1%(+1.32)#2,743 |
| 75. | 44048 | 2.4% | 0.90%(+1.49)#75 | 1.1%(+1.29)#2,787 |
| 76. | 45384 | 2.4% | 0.90%(+1.48)#76 | 1.1%(+1.29)#2,795 |
| 77. | 43154 | 2.4% | 0.90%(+1.48)#77 | 1.1%(+1.28)#2,808 |
| 78. | 45719 | 2.4% | 0.90%(+1.46)#78 | 1.1%(+1.27)#2,823 |
| 79. | 44049 | 2.3% | 0.90%(+1.43)#79 | 1.1%(+1.23)#2,895 |
| 80. | 43534 | 2.3% | 0.90%(+1.42)#80 | 1.1%(+1.23)#2,904 |
| 81. | 43356 | 2.3% | 0.90%(+1.41)#81 | 1.1%(+1.22)#2,941 |
| 82. | 43844 | 2.3% | 0.90%(+1.37)#82 | 1.1%(+1.18)#3,025 |
| 83. | 45434 | 2.3% | 0.90%(+1.36)#83 | 1.1%(+1.16)#3,055 |
| 84. | 45174 | 2.2% | 0.90%(+1.35)#84 | 1.1%(+1.16)#3,067 |
| 85. | 45208 | 2.2% | 0.90%(+1.33)#85 | 1.1%(+1.14)#3,116 |
| 86. | 43845 | 2.2% | 0.90%(+1.31)#86 | 1.1%(+1.12)#3,165 |
| 87. | 44445 | 2.2% | 0.90%(+1.30)#87 | 1.1%(+1.11)#3,182 |
| 88. | 45678 | 2.2% | 0.90%(+1.30)#88 | 1.1%(+1.10)#3,201 |
| 89. | 43214 | 2.2% | 0.90%(+1.29)#89 | 1.1%(+1.10)#3,207 |
| 90. | 44082 | 2.2% | 0.90%(+1.28)#90 | 1.1%(+1.09)#3,235 |
| 91. | 45710 | 2.2% | 0.90%(+1.27)#91 | 1.1%(+1.08)#3,247 |
| 92. | 43212 | 2.2% | 0.90%(+1.26)#92 | 1.1%(+1.06)#3,293 |
| 93. | 45068 | 2.1% | 0.90%(+1.25)#93 | 1.1%(+1.06)#3,310 |
| 94. | 45213 | 2.1% | 0.90%(+1.25)#94 | 1.1%(+1.05)#3,316 |
| 95. | 45241 | 2.1% | 0.90%(+1.23)#95 | 1.1%(+1.04)#3,345 |
| 96. | 43220 | 2.1% | 0.90%(+1.22)#96 | 1.1%(+1.03)#3,372 |
| 97. | 45742 | 2.1% | 0.90%(+1.21)#97 | 1.1%(+1.02)#3,394 |
| 98. | 45409 | 2.1% | 0.90%(+1.18)#98 | 1.1%(+0.987)#3,471 |
| 99. | 43620 | 2.0% | 0.90%(+1.10)#99 | 1.1%(+0.909)#3,686 |
| 100. | 44118 | 2.0% | 0.90%(+1.09)#100 | 1.1%(+0.900)#3,713 |
Common Questions
What are the Top 10 Zip Codes with the Highest Percentage of Population Employed in Life, Physical & Social Science in Ohio?
Top 10 Zip Codes with the Highest Percentage of Population Employed in Life, Physical & Social Science in Ohio are:
What zip code has the Highest Percentage of Population Employed in Life, Physical & Social Science in Ohio?
44080 has the Highest Percentage of Population Employed in Life, Physical & Social Science in Ohio with 30.0%.
What is the Percentage of Population Employed in Life, Physical & Social Science in the State of Ohio?
Percentage of Population Employed in Life, Physical & Social Science in Ohio is 0.90%.
What is the Percentage of Population Employed in Life, Physical & Social Science in the United States?
Percentage of Population Employed in Life, Physical & Social Science in the United States is 1.1%.