Zip Codes with the Highest Percentage of Population Employed in Life, Physical & Social Science in Puerto Rico
RELATED REPORTS & OPTIONS
Life, Physical & Social Science
Puerto Rico
Compare Zip Codes
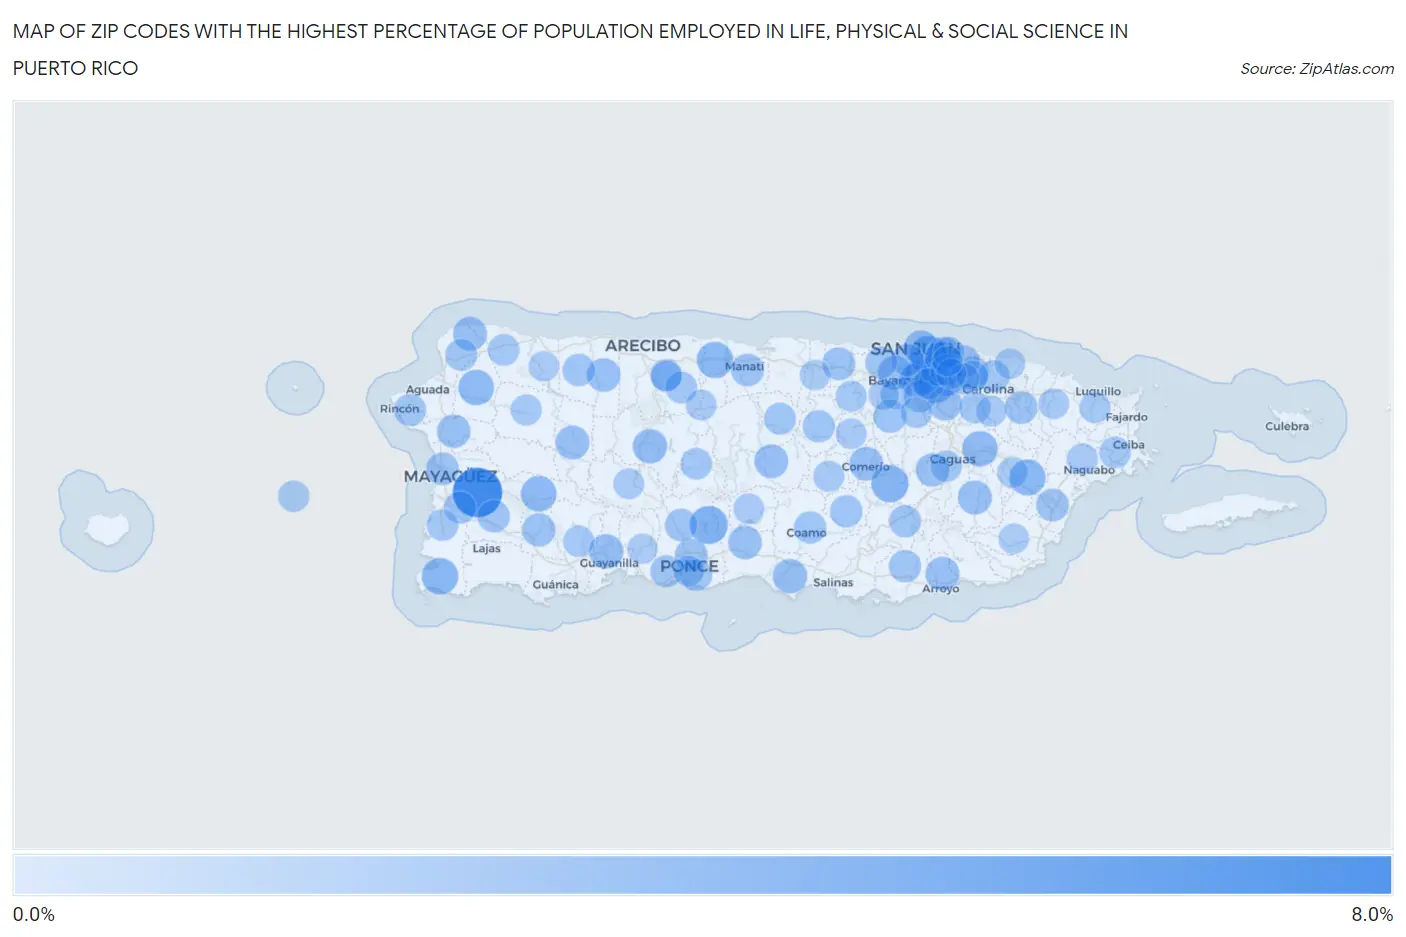
Map of Zip Codes with the Highest Percentage of Population Employed in Life, Physical & Social Science in Puerto Rico
0.0%
8.0%
Zip Codes with the Highest Percentage of Population Employed in Life, Physical & Social Science in Puerto Rico
| Zip Code | % Employed | vs State | vs National | |
| 1. | 00636 | 7.0% | 0.79%(+6.16)#1 | 1.1%(+5.86)#413 |
| 2. | 00907 | 2.9% | 0.79%(+2.10)#2 | 1.1%(+1.81)#2,000 |
| 3. | 00780 | 2.8% | 0.79%(+2.04)#3 | 1.1%(+1.75)#2,068 |
| 4. | 00739 | 2.5% | 0.79%(+1.70)#4 | 1.1%(+1.40)#2,587 |
| 5. | 00622 | 2.3% | 0.79%(+1.48)#5 | 1.1%(+1.19)#3,007 |
| 6. | 00617 | 2.2% | 0.79%(+1.40)#6 | 1.1%(+1.10)#3,195 |
| 7. | 00771 | 2.1% | 0.79%(+1.36)#7 | 1.1%(+1.06)#3,303 |
| 8. | 00927 | 2.0% | 0.79%(+1.25)#8 | 1.1%(+0.957)#3,549 |
| 9. | 00968 | 2.0% | 0.79%(+1.25)#9 | 1.1%(+0.951)#3,563 |
| 10. | 00606 | 2.0% | 0.79%(+1.18)#10 | 1.1%(+0.886)#3,755 |
| 11. | 00676 | 2.0% | 0.79%(+1.16)#11 | 1.1%(+0.862)#3,816 |
| 12. | 00778 | 1.9% | 0.79%(+1.11)#12 | 1.1%(+0.812)#3,970 |
| 13. | 00966 | 1.7% | 0.79%(+0.904)#13 | 1.1%(+0.608)#4,734 |
| 14. | 00925 | 1.6% | 0.79%(+0.847)#14 | 1.1%(+0.550)#4,988 |
| 15. | 00641 | 1.6% | 0.79%(+0.793)#15 | 1.1%(+0.497)#5,210 |
| 16. | 00757 | 1.6% | 0.79%(+0.772)#16 | 1.1%(+0.475)#5,311 |
| 17. | 00656 | 1.5% | 0.79%(+0.747)#17 | 1.1%(+0.450)#5,438 |
| 18. | 00901 | 1.5% | 0.79%(+0.735)#18 | 1.1%(+0.438)#5,503 |
| 19. | 00918 | 1.5% | 0.79%(+0.661)#19 | 1.1%(+0.365)#5,894 |
| 20. | 00720 | 1.4% | 0.79%(+0.619)#20 | 1.1%(+0.322)#6,119 |
| 21. | 00690 | 1.4% | 0.79%(+0.603)#21 | 1.1%(+0.306)#6,211 |
| 22. | 00961 | 1.4% | 0.79%(+0.601)#22 | 1.1%(+0.305)#6,222 |
| 23. | 00714 | 1.4% | 0.79%(+0.599)#23 | 1.1%(+0.302)#6,238 |
| 24. | 00754 | 1.4% | 0.79%(+0.598)#24 | 1.1%(+0.301)#6,244 |
| 25. | 00669 | 1.4% | 0.79%(+0.569)#25 | 1.1%(+0.272)#6,403 |
| 26. | 00782 | 1.3% | 0.79%(+0.542)#26 | 1.1%(+0.245)#6,559 |
| 27. | 00926 | 1.3% | 0.79%(+0.513)#27 | 1.1%(+0.216)#6,766 |
| 28. | 00795 | 1.3% | 0.79%(+0.505)#28 | 1.1%(+0.208)#6,812 |
| 29. | 00659 | 1.3% | 0.79%(+0.486)#29 | 1.1%(+0.189)#6,927 |
| 30. | 00911 | 1.3% | 0.79%(+0.478)#30 | 1.1%(+0.181)#6,989 |
| 31. | 00727 | 1.2% | 0.79%(+0.416)#31 | 1.1%(+0.120)#7,413 |
| 32. | 00610 | 1.2% | 0.79%(+0.406)#32 | 1.1%(+0.109)#7,495 |
| 33. | 00637 | 1.2% | 0.79%(+0.367)#33 | 1.1%(+0.070)#7,789 |
| 34. | 00956 | 1.1% | 0.79%(+0.312)#34 | 1.1%(+0.016)#8,179 |
| 35. | 00646 | 1.1% | 0.79%(+0.259)#35 | 1.1%(-0.038)#8,599 |
| 36. | 00730 | 1.0% | 0.79%(+0.224)#36 | 1.1%(-0.073)#8,906 |
| 37. | 00791 | 1.0% | 0.79%(+0.221)#37 | 1.1%(-0.075)#8,921 |
| 38. | 00729 | 1.0% | 0.79%(+0.209)#38 | 1.1%(-0.088)#9,023 |
| 39. | 00674 | 0.99% | 0.79%(+0.191)#39 | 1.1%(-0.106)#9,175 |
| 40. | 00682 | 0.98% | 0.79%(+0.190)#40 | 1.1%(-0.107)#9,186 |
| 41. | 00983 | 0.95% | 0.79%(+0.157)#41 | 1.1%(-0.139)#9,480 |
| 42. | 00912 | 0.92% | 0.79%(+0.125)#42 | 1.1%(-0.172)#9,776 |
| 43. | 00731 | 0.92% | 0.79%(+0.124)#43 | 1.1%(-0.172)#9,780 |
| 44. | 00683 | 0.89% | 0.79%(+0.092)#44 | 1.1%(-0.205)#10,088 |
| 45. | 00962 | 0.88% | 0.79%(+0.083)#45 | 1.1%(-0.214)#10,174 |
| 46. | 00784 | 0.85% | 0.79%(+0.057)#46 | 1.1%(-0.240)#10,466 |
| 47. | 00627 | 0.84% | 0.79%(+0.043)#47 | 1.1%(-0.254)#10,610 |
| 48. | 00705 | 0.83% | 0.79%(+0.039)#48 | 1.1%(-0.258)#10,653 |
| 49. | 00969 | 0.81% | 0.79%(+0.014)#49 | 1.1%(-0.283)#10,914 |
| 50. | 00660 | 0.80% | 0.79%(+0.007)#50 | 1.1%(-0.290)#10,990 |
| 51. | 00783 | 0.80% | 0.79%(+0.005)#51 | 1.1%(-0.292)#11,009 |
| 52. | 00769 | 0.77% | 0.79%(-0.019)#52 | 1.1%(-0.316)#11,252 |
| 53. | 00979 | 0.77% | 0.79%(-0.028)#53 | 1.1%(-0.325)#11,345 |
| 54. | 00736 | 0.76% | 0.79%(-0.033)#54 | 1.1%(-0.330)#11,391 |
| 55. | 00677 | 0.74% | 0.79%(-0.052)#55 | 1.1%(-0.348)#11,588 |
| 56. | 00616 | 0.70% | 0.79%(-0.092)#56 | 1.1%(-0.389)#12,001 |
| 57. | 00603 | 0.70% | 0.79%(-0.097)#57 | 1.1%(-0.394)#12,071 |
| 58. | 00716 | 0.68% | 0.79%(-0.112)#58 | 1.1%(-0.408)#12,261 |
| 59. | 00985 | 0.68% | 0.79%(-0.116)#59 | 1.1%(-0.413)#12,308 |
| 60. | 00687 | 0.68% | 0.79%(-0.117)#60 | 1.1%(-0.414)#12,323 |
| 61. | 00728 | 0.66% | 0.79%(-0.135)#61 | 1.1%(-0.432)#12,549 |
| 62. | 00949 | 0.63% | 0.79%(-0.161)#62 | 1.1%(-0.458)#12,865 |
| 63. | 00688 | 0.63% | 0.79%(-0.168)#63 | 1.1%(-0.465)#12,961 |
| 64. | 00959 | 0.61% | 0.79%(-0.187)#64 | 1.1%(-0.483)#13,190 |
| 65. | 00976 | 0.60% | 0.79%(-0.191)#65 | 1.1%(-0.487)#13,243 |
| 66. | 00735 | 0.60% | 0.79%(-0.195)#66 | 1.1%(-0.491)#13,302 |
| 67. | 00623 | 0.60% | 0.79%(-0.198)#67 | 1.1%(-0.494)#13,347 |
| 68. | 00917 | 0.59% | 0.79%(-0.200)#68 | 1.1%(-0.497)#13,372 |
| 69. | 00662 | 0.59% | 0.79%(-0.209)#69 | 1.1%(-0.506)#13,483 |
| 70. | 00664 | 0.55% | 0.79%(-0.240)#70 | 1.1%(-0.537)#13,844 |
| 71. | 00913 | 0.53% | 0.79%(-0.266)#71 | 1.1%(-0.563)#14,177 |
| 72. | 00680 | 0.51% | 0.79%(-0.281)#72 | 1.1%(-0.578)#14,342 |
| 73. | 00725 | 0.48% | 0.79%(-0.316)#73 | 1.1%(-0.613)#14,793 |
| 74. | 00921 | 0.48% | 0.79%(-0.316)#74 | 1.1%(-0.613)#14,797 |
| 75. | 00982 | 0.48% | 0.79%(-0.318)#75 | 1.1%(-0.615)#14,828 |
| 76. | 00698 | 0.47% | 0.79%(-0.325)#76 | 1.1%(-0.621)#14,904 |
| 77. | 00924 | 0.45% | 0.79%(-0.340)#77 | 1.1%(-0.636)#15,081 |
| 78. | 00717 | 0.43% | 0.79%(-0.365)#78 | 1.1%(-0.661)#15,376 |
| 79. | 00971 | 0.42% | 0.79%(-0.375)#79 | 1.1%(-0.671)#15,509 |
| 80. | 00685 | 0.39% | 0.79%(-0.404)#80 | 1.1%(-0.701)#15,883 |
| 81. | 00794 | 0.38% | 0.79%(-0.410)#81 | 1.1%(-0.707)#15,963 |
| 82. | 00773 | 0.37% | 0.79%(-0.423)#82 | 1.1%(-0.719)#16,114 |
| 83. | 00953 | 0.36% | 0.79%(-0.436)#83 | 1.1%(-0.733)#16,307 |
| 84. | 00718 | 0.34% | 0.79%(-0.453)#84 | 1.1%(-0.750)#16,523 |
| 85. | 00601 | 0.32% | 0.79%(-0.475)#85 | 1.1%(-0.772)#16,817 |
| 86. | 00612 | 0.32% | 0.79%(-0.479)#86 | 1.1%(-0.775)#16,873 |
| 87. | 00719 | 0.31% | 0.79%(-0.487)#87 | 1.1%(-0.783)#16,971 |
| 88. | 00777 | 0.29% | 0.79%(-0.499)#88 | 1.1%(-0.796)#17,128 |
| 89. | 00650 | 0.29% | 0.79%(-0.507)#89 | 1.1%(-0.803)#17,215 |
| 90. | 00987 | 0.27% | 0.79%(-0.524)#90 | 1.1%(-0.821)#17,422 |
| 91. | 00766 | 0.25% | 0.79%(-0.540)#91 | 1.1%(-0.837)#17,599 |
| 92. | 00745 | 0.25% | 0.79%(-0.544)#92 | 1.1%(-0.841)#17,630 |
| 93. | 00923 | 0.23% | 0.79%(-0.568)#93 | 1.1%(-0.864)#17,898 |
| 94. | 00915 | 0.21% | 0.79%(-0.586)#94 | 1.1%(-0.883)#18,114 |
| 95. | 00957 | 0.21% | 0.79%(-0.588)#95 | 1.1%(-0.885)#18,134 |
| 96. | 00767 | 0.20% | 0.79%(-0.592)#96 | 1.1%(-0.889)#18,173 |
| 97. | 00772 | 0.19% | 0.79%(-0.606)#97 | 1.1%(-0.903)#18,333 |
| 98. | 00678 | 0.18% | 0.79%(-0.619)#98 | 1.1%(-0.915)#18,438 |
| 99. | 00692 | 0.16% | 0.79%(-0.637)#99 | 1.1%(-0.934)#18,625 |
| 100. | 00624 | 0.15% | 0.79%(-0.648)#100 | 1.1%(-0.945)#18,712 |
1
2Common Questions
What are the Top 10 Zip Codes with the Highest Percentage of Population Employed in Life, Physical & Social Science in Puerto Rico?
Top 10 Zip Codes with the Highest Percentage of Population Employed in Life, Physical & Social Science in Puerto Rico are:
What zip code has the Highest Percentage of Population Employed in Life, Physical & Social Science in Puerto Rico?
00636 has the Highest Percentage of Population Employed in Life, Physical & Social Science in Puerto Rico with 7.0%.
What is the Percentage of Population Employed in Life, Physical & Social Science in the State of Puerto Rico?
Percentage of Population Employed in Life, Physical & Social Science in Puerto Rico is 0.79%.
What is the Percentage of Population Employed in Life, Physical & Social Science in the United States?
Percentage of Population Employed in Life, Physical & Social Science in the United States is 1.1%.