Zip Codes with the Highest Percentage of Population Employed in Life, Physical & Social Science in Maine
RELATED REPORTS & OPTIONS
Life, Physical & Social Science
Maine
Compare Zip Codes
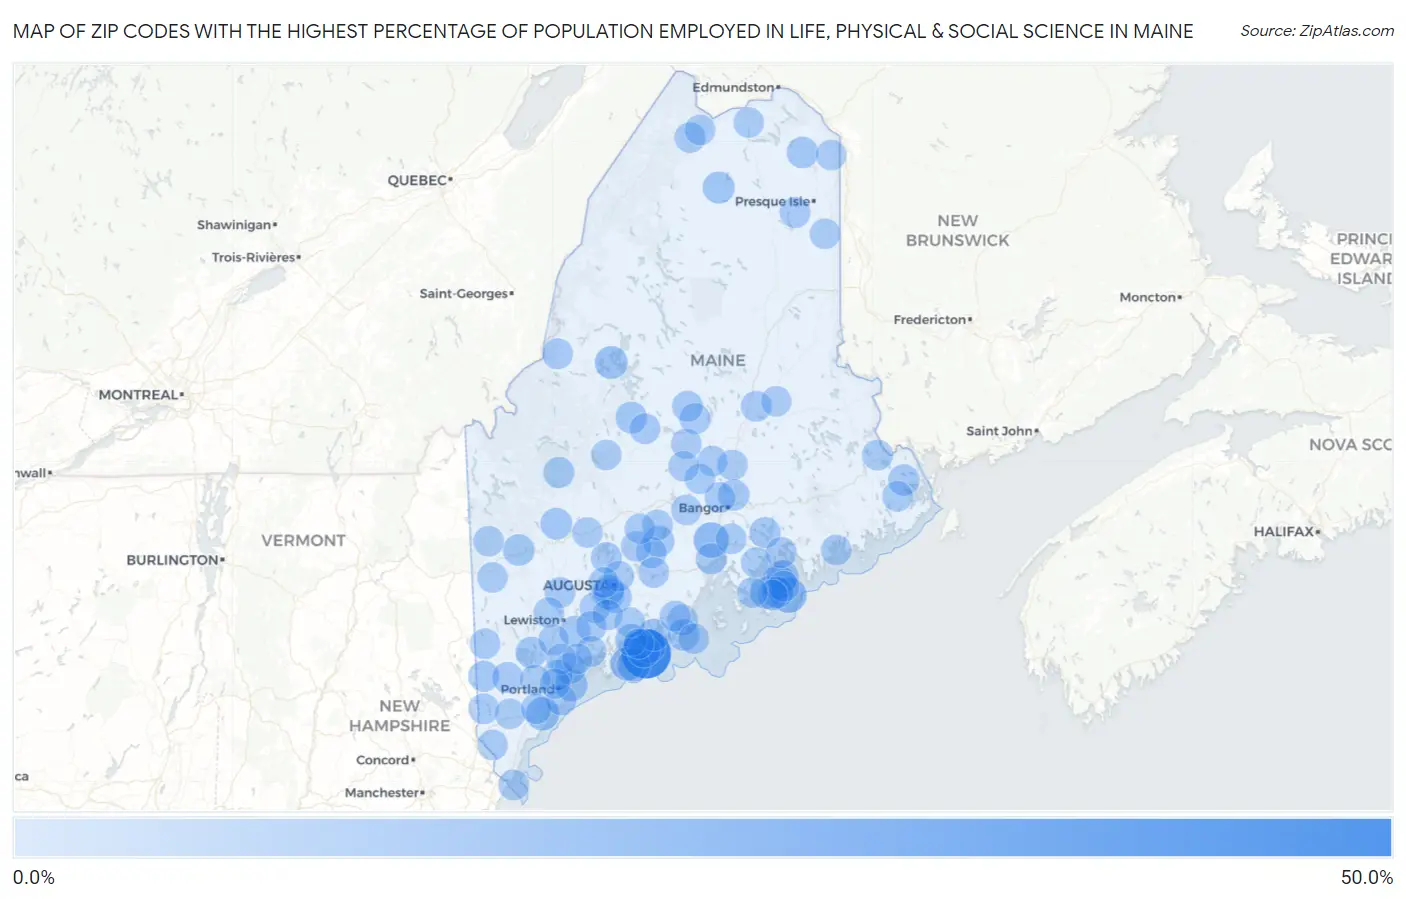
Map of Zip Codes with the Highest Percentage of Population Employed in Life, Physical & Social Science in Maine
0.0%
50.0%
Zip Codes with the Highest Percentage of Population Employed in Life, Physical & Social Science in Maine
| Zip Code | % Employed | vs State | vs National | |
| 1. | 04541 | 50.0% | 1.1%(+48.9)#1 | 1.1%(+48.9)#6 |
| 2. | 04625 | 14.3% | 1.1%(+13.2)#2 | 1.1%(+13.2)#116 |
| 3. | 04438 | 13.4% | 1.1%(+12.4)#3 | 1.1%(+12.3)#125 |
| 4. | 04660 | 10.3% | 1.1%(+9.21)#4 | 1.1%(+9.20)#203 |
| 5. | 04576 | 9.4% | 1.1%(+8.36)#5 | 1.1%(+8.35)#231 |
| 6. | 04564 | 9.3% | 1.1%(+8.26)#6 | 1.1%(+8.25)#236 |
| 7. | 04063 | 9.0% | 1.1%(+7.87)#7 | 1.1%(+7.86)#260 |
| 8. | 04544 | 8.4% | 1.1%(+7.27)#8 | 1.1%(+7.26)#297 |
| 9. | 04558 | 7.5% | 1.1%(+6.44)#9 | 1.1%(+6.43)#361 |
| 10. | 04478 | 7.3% | 1.1%(+6.17)#10 | 1.1%(+6.16)#385 |
| 11. | 04674 | 6.7% | 1.1%(+5.65)#11 | 1.1%(+5.64)#439 |
| 12. | 04050 | 6.5% | 1.1%(+5.37)#12 | 1.1%(+5.36)#482 |
| 13. | 04551 | 5.6% | 1.1%(+4.49)#13 | 1.1%(+4.48)#611 |
| 14. | 04344 | 5.4% | 1.1%(+4.35)#14 | 1.1%(+4.34)#645 |
| 15. | 04609 | 5.4% | 1.1%(+4.34)#15 | 1.1%(+4.33)#648 |
| 16. | 04768 | 5.1% | 1.1%(+4.01)#16 | 1.1%(+4.00)#739 |
| 17. | 04556 | 4.9% | 1.1%(+3.81)#17 | 1.1%(+3.81)#795 |
| 18. | 04984 | 4.7% | 1.1%(+3.58)#18 | 1.1%(+3.57)#861 |
| 19. | 04276 | 4.3% | 1.1%(+3.23)#19 | 1.1%(+3.22)#998 |
| 20. | 04859 | 4.3% | 1.1%(+3.21)#20 | 1.1%(+3.20)#1,011 |
| 21. | 04485 | 4.2% | 1.1%(+3.09)#21 | 1.1%(+3.08)#1,068 |
| 22. | 04679 | 4.0% | 1.1%(+2.89)#22 | 1.1%(+2.88)#1,173 |
| 23. | 04762 | 4.0% | 1.1%(+2.88)#23 | 1.1%(+2.87)#1,178 |
| 24. | 04071 | 3.8% | 1.1%(+2.74)#24 | 1.1%(+2.73)#1,249 |
| 25. | 04666 | 3.7% | 1.1%(+2.58)#25 | 1.1%(+2.57)#1,338 |
| 26. | 04473 | 3.5% | 1.1%(+2.47)#26 | 1.1%(+2.46)#1,391 |
| 27. | 04346 | 3.3% | 1.1%(+2.22)#27 | 1.1%(+2.21)#1,578 |
| 28. | 04988 | 3.1% | 1.1%(+2.04)#28 | 1.1%(+2.03)#1,731 |
| 29. | 04250 | 3.1% | 1.1%(+1.98)#29 | 1.1%(+1.97)#1,796 |
| 30. | 04947 | 3.0% | 1.1%(+1.94)#30 | 1.1%(+1.93)#1,852 |
| 31. | 04047 | 2.9% | 1.1%(+1.82)#31 | 1.1%(+1.81)#1,990 |
| 32. | 04605 | 2.8% | 1.1%(+1.70)#32 | 1.1%(+1.69)#2,136 |
| 33. | 04415 | 2.7% | 1.1%(+1.66)#33 | 1.1%(+1.65)#2,191 |
| 34. | 04640 | 2.7% | 1.1%(+1.64)#34 | 1.1%(+1.63)#2,227 |
| 35. | 04974 | 2.7% | 1.1%(+1.62)#35 | 1.1%(+1.61)#2,251 |
| 36. | 04260 | 2.5% | 1.1%(+1.47)#36 | 1.1%(+1.46)#2,484 |
| 37. | 04414 | 2.5% | 1.1%(+1.43)#37 | 1.1%(+1.42)#2,553 |
| 38. | 04662 | 2.5% | 1.1%(+1.40)#38 | 1.1%(+1.39)#2,600 |
| 39. | 04757 | 2.5% | 1.1%(+1.40)#39 | 1.1%(+1.39)#2,607 |
| 40. | 04457 | 2.5% | 1.1%(+1.37)#40 | 1.1%(+1.36)#2,655 |
| 41. | 04694 | 2.4% | 1.1%(+1.35)#41 | 1.1%(+1.34)#2,688 |
| 42. | 04945 | 2.4% | 1.1%(+1.32)#42 | 1.1%(+1.31)#2,759 |
| 43. | 04049 | 2.4% | 1.1%(+1.31)#43 | 1.1%(+1.30)#2,768 |
| 44. | 04347 | 2.3% | 1.1%(+1.26)#44 | 1.1%(+1.25)#2,853 |
| 45. | 04861 | 2.3% | 1.1%(+1.25)#45 | 1.1%(+1.24)#2,870 |
| 46. | 04917 | 2.3% | 1.1%(+1.18)#46 | 1.1%(+1.17)#3,039 |
| 47. | 04350 | 2.2% | 1.1%(+1.08)#47 | 1.1%(+1.07)#3,267 |
| 48. | 04096 | 2.2% | 1.1%(+1.07)#48 | 1.1%(+1.06)#3,292 |
| 49. | 04743 | 2.2% | 1.1%(+1.07)#49 | 1.1%(+1.06)#3,296 |
| 50. | 04910 | 2.1% | 1.1%(+1.05)#50 | 1.1%(+1.04)#3,349 |
| 51. | 03905 | 2.1% | 1.1%(+1.04)#51 | 1.1%(+1.03)#3,371 |
| 52. | 04464 | 2.1% | 1.1%(+1.00)#52 | 1.1%(+0.992)#3,462 |
| 53. | 04922 | 2.0% | 1.1%(+0.927)#53 | 1.1%(+0.917)#3,663 |
| 54. | 04287 | 2.0% | 1.1%(+0.909)#54 | 1.1%(+0.899)#3,717 |
| 55. | 03901 | 2.0% | 1.1%(+0.903)#55 | 1.1%(+0.893)#3,736 |
| 56. | 04864 | 1.9% | 1.1%(+0.863)#56 | 1.1%(+0.854)#3,846 |
| 57. | 04354 | 1.9% | 1.1%(+0.855)#57 | 1.1%(+0.845)#3,872 |
| 58. | 04416 | 1.9% | 1.1%(+0.840)#58 | 1.1%(+0.830)#3,911 |
| 59. | 04282 | 1.9% | 1.1%(+0.790)#59 | 1.1%(+0.780)#4,063 |
| 60. | 04401 | 1.9% | 1.1%(+0.783)#60 | 1.1%(+0.773)#4,095 |
| 61. | 04107 | 1.8% | 1.1%(+0.769)#61 | 1.1%(+0.759)#4,140 |
| 62. | 04001 | 1.8% | 1.1%(+0.765)#62 | 1.1%(+0.755)#4,152 |
| 63. | 04628 | 1.8% | 1.1%(+0.762)#63 | 1.1%(+0.752)#4,162 |
| 64. | 04330 | 1.8% | 1.1%(+0.756)#64 | 1.1%(+0.746)#4,187 |
| 65. | 04011 | 1.8% | 1.1%(+0.732)#65 | 1.1%(+0.722)#4,285 |
| 66. | 04612 | 1.8% | 1.1%(+0.711)#66 | 1.1%(+0.701)#4,351 |
| 67. | 04774 | 1.7% | 1.1%(+0.666)#67 | 1.1%(+0.656)#4,520 |
| 68. | 04351 | 1.7% | 1.1%(+0.662)#68 | 1.1%(+0.652)#4,537 |
| 69. | 04643 | 1.7% | 1.1%(+0.647)#69 | 1.1%(+0.637)#4,600 |
| 70. | 04468 | 1.7% | 1.1%(+0.622)#70 | 1.1%(+0.612)#4,712 |
| 71. | 04854 | 1.7% | 1.1%(+0.600)#71 | 1.1%(+0.590)#4,818 |
| 72. | 04955 | 1.7% | 1.1%(+0.595)#72 | 1.1%(+0.585)#4,836 |
| 73. | 04750 | 1.7% | 1.1%(+0.578)#73 | 1.1%(+0.568)#4,902 |
| 74. | 04010 | 1.6% | 1.1%(+0.567)#74 | 1.1%(+0.557)#4,954 |
| 75. | 04105 | 1.6% | 1.1%(+0.565)#75 | 1.1%(+0.555)#4,965 |
| 76. | 04410 | 1.6% | 1.1%(+0.552)#76 | 1.1%(+0.542)#5,019 |
| 77. | 04258 | 1.6% | 1.1%(+0.542)#77 | 1.1%(+0.532)#5,065 |
| 78. | 04616 | 1.6% | 1.1%(+0.502)#78 | 1.1%(+0.492)#5,234 |
| 79. | 04097 | 1.6% | 1.1%(+0.482)#79 | 1.1%(+0.472)#5,322 |
| 80. | 04901 | 1.6% | 1.1%(+0.478)#80 | 1.1%(+0.468)#5,340 |
| 81. | 04927 | 1.5% | 1.1%(+0.445)#81 | 1.1%(+0.435)#5,517 |
| 82. | 04032 | 1.5% | 1.1%(+0.441)#82 | 1.1%(+0.431)#5,536 |
| 83. | 04261 | 1.5% | 1.1%(+0.434)#83 | 1.1%(+0.424)#5,578 |
| 84. | 04002 | 1.5% | 1.1%(+0.432)#84 | 1.1%(+0.422)#5,591 |
| 85. | 04920 | 1.5% | 1.1%(+0.428)#85 | 1.1%(+0.418)#5,612 |
| 86. | 04427 | 1.5% | 1.1%(+0.403)#86 | 1.1%(+0.393)#5,739 |
| 87. | 04535 | 1.5% | 1.1%(+0.403)#87 | 1.1%(+0.393)#5,740 |
| 88. | 04357 | 1.5% | 1.1%(+0.400)#88 | 1.1%(+0.390)#5,761 |
| 89. | 04684 | 1.5% | 1.1%(+0.391)#89 | 1.1%(+0.381)#5,817 |
| 90. | 04495 | 1.5% | 1.1%(+0.379)#90 | 1.1%(+0.369)#5,870 |
| 91. | 04038 | 1.5% | 1.1%(+0.374)#91 | 1.1%(+0.365)#5,895 |
| 92. | 04217 | 1.5% | 1.1%(+0.369)#92 | 1.1%(+0.359)#5,919 |
| 93. | 04734 | 1.4% | 1.1%(+0.354)#93 | 1.1%(+0.344)#5,993 |
| 94. | 04426 | 1.4% | 1.1%(+0.339)#94 | 1.1%(+0.329)#6,082 |
| 95. | 04939 | 1.4% | 1.1%(+0.337)#95 | 1.1%(+0.328)#6,091 |
| 96. | 04573 | 1.4% | 1.1%(+0.283)#96 | 1.1%(+0.273)#6,399 |
| 97. | 04781 | 1.3% | 1.1%(+0.246)#97 | 1.1%(+0.237)#6,622 |
| 98. | 04434 | 1.3% | 1.1%(+0.242)#98 | 1.1%(+0.232)#6,645 |
| 99. | 04072 | 1.3% | 1.1%(+0.239)#99 | 1.1%(+0.229)#6,670 |
| 100. | 04103 | 1.3% | 1.1%(+0.234)#100 | 1.1%(+0.225)#6,706 |
Common Questions
What are the Top 10 Zip Codes with the Highest Percentage of Population Employed in Life, Physical & Social Science in Maine?
Top 10 Zip Codes with the Highest Percentage of Population Employed in Life, Physical & Social Science in Maine are:
What zip code has the Highest Percentage of Population Employed in Life, Physical & Social Science in Maine?
04541 has the Highest Percentage of Population Employed in Life, Physical & Social Science in Maine with 50.0%.
What is the Percentage of Population Employed in Life, Physical & Social Science in the State of Maine?
Percentage of Population Employed in Life, Physical & Social Science in Maine is 1.1%.
What is the Percentage of Population Employed in Life, Physical & Social Science in the United States?
Percentage of Population Employed in Life, Physical & Social Science in the United States is 1.1%.