Zip Codes with the Highest Percentage of Population Employed in Security & Protection in Rowlett, TX
RELATED REPORTS & OPTIONS
Security & Protection
Rowlett
Compare Zip Codes
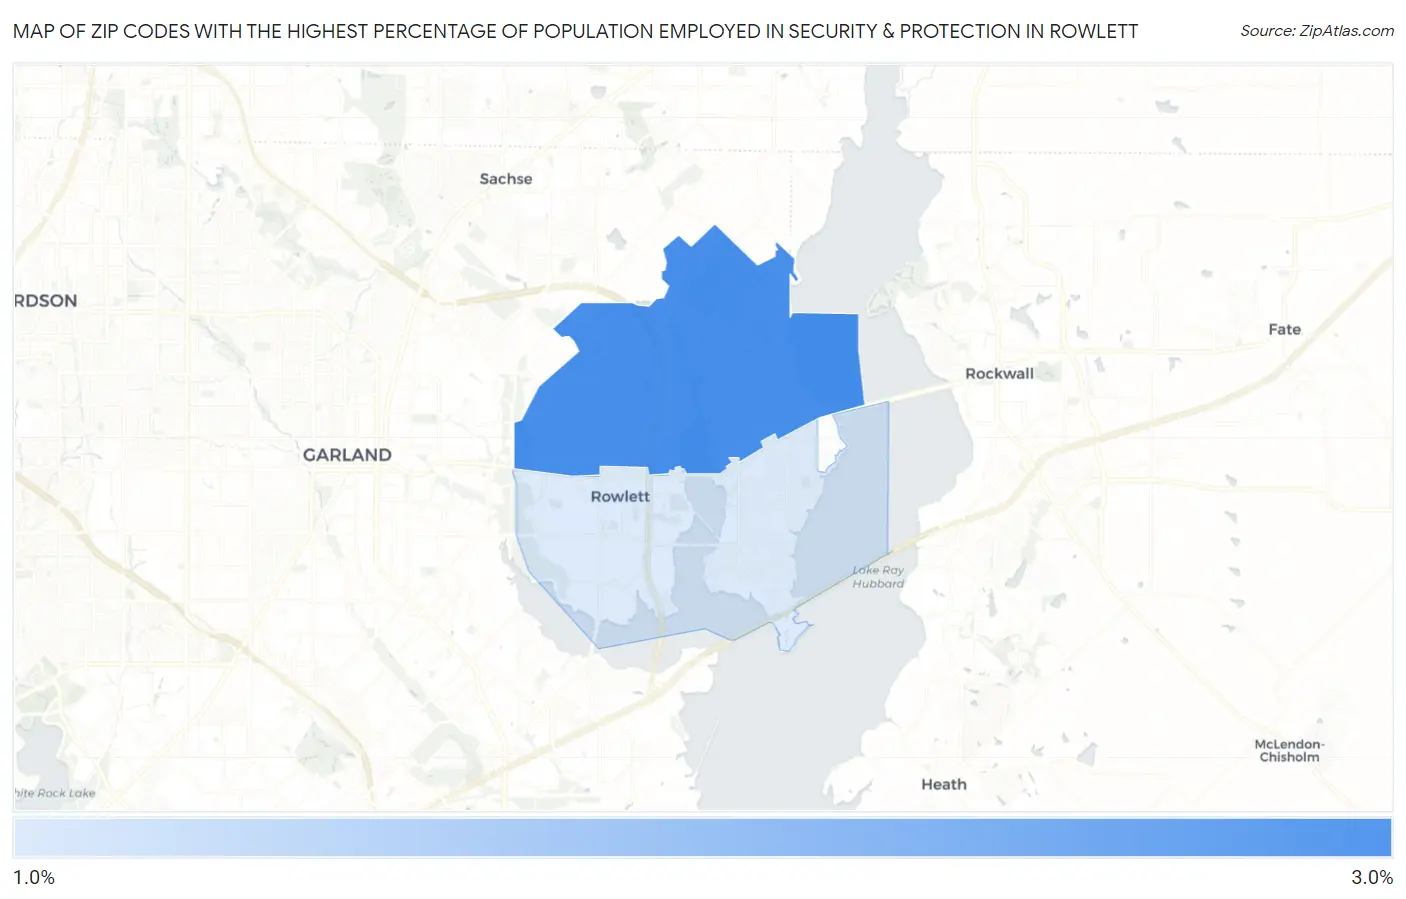
Map of Zip Codes with the Highest Percentage of Population Employed in Security & Protection in Rowlett
1.4%
2.5%
Zip Codes with the Highest Percentage of Population Employed in Security & Protection in Rowlett, TX
| Zip Code | % Employed | vs State | vs National | |
| 1. | 75089 | 2.5% | 2.2%(+0.312)#653 | 2.1%(+0.387)#9,323 |
| 2. | 75088 | 1.4% | 2.2%(-0.846)#1,139 | 2.1%(-0.771)#17,120 |
1
Common Questions
What are the Top Zip Codes with the Highest Percentage of Population Employed in Security & Protection in Rowlett, TX?
Top Zip Codes with the Highest Percentage of Population Employed in Security & Protection in Rowlett, TX are:
What zip code has the Highest Percentage of Population Employed in Security & Protection in Rowlett, TX?
75089 has the Highest Percentage of Population Employed in Security & Protection in Rowlett, TX with 2.5%.
What is the Percentage of Population Employed in Security & Protection in Rowlett, TX?
Percentage of Population Employed in Security & Protection in Rowlett is 2.0%.
What is the Percentage of Population Employed in Security & Protection in Texas?
Percentage of Population Employed in Security & Protection in Texas is 2.2%.
What is the Percentage of Population Employed in Security & Protection in the United States?
Percentage of Population Employed in Security & Protection in the United States is 2.1%.