Zip Codes with the Highest Percentage of Population Employed in Security & Protection in Dallas, TX
RELATED REPORTS & OPTIONS
Security & Protection
Dallas
Compare Zip Codes
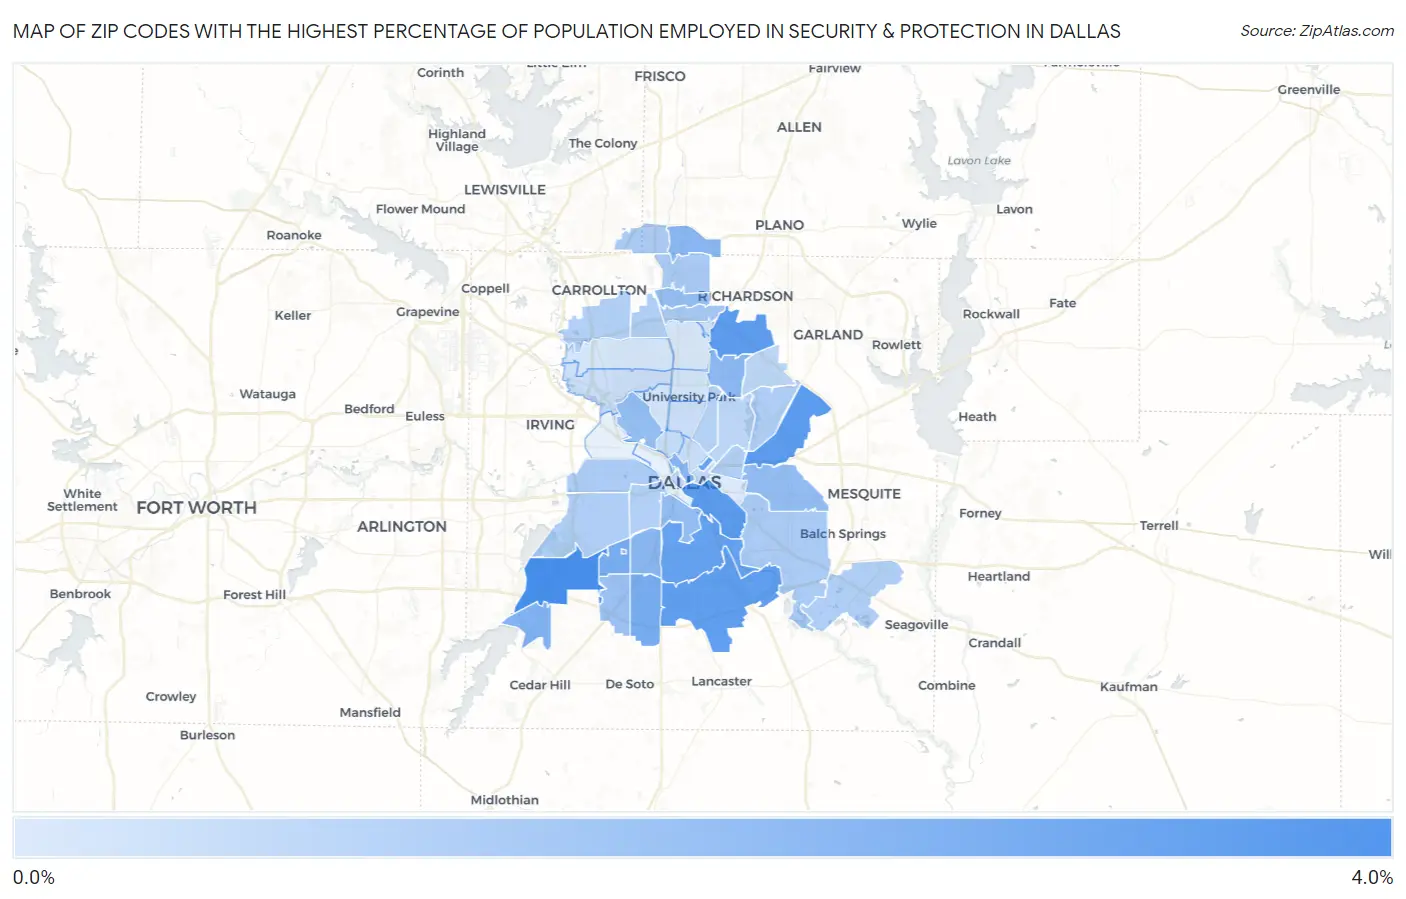
Map of Zip Codes with the Highest Percentage of Population Employed in Security & Protection in Dallas
0.13%
3.1%
Zip Codes with the Highest Percentage of Population Employed in Security & Protection in Dallas, TX
| Zip Code | % Employed | vs State | vs National | |
| 1. | 75236 | 3.1% | 2.2%(+0.864)#500 | 2.1%(+0.940)#6,924 |
| 2. | 75215 | 2.7% | 2.2%(+0.511)#597 | 2.1%(+0.587)#8,380 |
| 3. | 75228 | 2.7% | 2.2%(+0.474)#605 | 2.1%(+0.550)#8,538 |
| 4. | 75243 | 2.6% | 2.2%(+0.389)#626 | 2.1%(+0.465)#8,943 |
| 5. | 75241 | 2.6% | 2.2%(+0.361)#637 | 2.1%(+0.436)#9,077 |
| 6. | 75216 | 2.5% | 2.2%(+0.252)#678 | 2.1%(+0.327)#9,642 |
| 7. | 75246 | 2.4% | 2.2%(+0.221)#690 | 2.1%(+0.296)#9,819 |
| 8. | 75233 | 2.1% | 2.2%(-0.096)#801 | 2.1%(-0.020)#11,714 |
| 9. | 75232 | 2.1% | 2.2%(-0.097)#802 | 2.1%(-0.022)#11,727 |
| 10. | 75249 | 2.0% | 2.2%(-0.260)#877 | 2.1%(-0.184)#12,793 |
| 11. | 75201 | 1.8% | 2.2%(-0.401)#938 | 2.1%(-0.325)#13,760 |
| 12. | 75224 | 1.8% | 2.2%(-0.453)#967 | 2.1%(-0.377)#14,155 |
| 13. | 75252 | 1.7% | 2.2%(-0.485)#981 | 2.1%(-0.410)#14,402 |
| 14. | 75231 | 1.7% | 2.2%(-0.510)#989 | 2.1%(-0.434)#14,565 |
| 15. | 75227 | 1.6% | 2.2%(-0.631)#1,040 | 2.1%(-0.556)#15,463 |
| 16. | 75203 | 1.6% | 2.2%(-0.639)#1,048 | 2.1%(-0.563)#15,529 |
| 17. | 75254 | 1.5% | 2.2%(-0.677)#1,068 | 2.1%(-0.601)#15,815 |
| 18. | 75235 | 1.5% | 2.2%(-0.709)#1,080 | 2.1%(-0.634)#16,077 |
| 19. | 75237 | 1.5% | 2.2%(-0.765)#1,095 | 2.1%(-0.689)#16,499 |
| 20. | 75240 | 1.2% | 2.2%(-1.00)#1,196 | 2.1%(-0.929)#18,367 |
| 21. | 75248 | 1.1% | 2.2%(-1.08)#1,227 | 2.1%(-1.01)#18,957 |
| 22. | 75287 | 1.1% | 2.2%(-1.14)#1,254 | 2.1%(-1.07)#19,435 |
| 23. | 75212 | 1.1% | 2.2%(-1.15)#1,256 | 2.1%(-1.07)#19,455 |
| 24. | 75217 | 1.1% | 2.2%(-1.16)#1,263 | 2.1%(-1.09)#19,573 |
| 25. | 75218 | 1.0% | 2.2%(-1.18)#1,275 | 2.1%(-1.10)#19,690 |
| 26. | 75211 | 1.0% | 2.2%(-1.21)#1,296 | 2.1%(-1.14)#19,970 |
| 27. | 75253 | 1.0% | 2.2%(-1.22)#1,300 | 2.1%(-1.14)#19,999 |
| 28. | 75244 | 0.99% | 2.2%(-1.23)#1,306 | 2.1%(-1.15)#20,083 |
| 29. | 75223 | 0.97% | 2.2%(-1.25)#1,315 | 2.1%(-1.17)#20,249 |
| 30. | 75234 | 0.96% | 2.2%(-1.26)#1,320 | 2.1%(-1.19)#20,355 |
| 31. | 75208 | 0.95% | 2.2%(-1.27)#1,325 | 2.1%(-1.19)#20,405 |
| 32. | 75206 | 0.89% | 2.2%(-1.34)#1,350 | 2.1%(-1.26)#20,879 |
| 33. | 75238 | 0.78% | 2.2%(-1.44)#1,385 | 2.1%(-1.37)#21,515 |
| 34. | 75214 | 0.77% | 2.2%(-1.46)#1,390 | 2.1%(-1.38)#21,629 |
| 35. | 75202 | 0.73% | 2.2%(-1.50)#1,399 | 2.1%(-1.42)#21,896 |
| 36. | 75226 | 0.63% | 2.2%(-1.59)#1,428 | 2.1%(-1.52)#22,486 |
| 37. | 75219 | 0.60% | 2.2%(-1.63)#1,438 | 2.1%(-1.55)#22,672 |
| 38. | 75204 | 0.56% | 2.2%(-1.67)#1,454 | 2.1%(-1.59)#22,935 |
| 39. | 75205 | 0.48% | 2.2%(-1.74)#1,468 | 2.1%(-1.67)#23,319 |
| 40. | 75220 | 0.48% | 2.2%(-1.74)#1,469 | 2.1%(-1.67)#23,339 |
| 41. | 75251 | 0.39% | 2.2%(-1.83)#1,488 | 2.1%(-1.76)#23,767 |
| 42. | 75225 | 0.32% | 2.2%(-1.91)#1,493 | 2.1%(-1.83)#24,105 |
| 43. | 75209 | 0.29% | 2.2%(-1.93)#1,502 | 2.1%(-1.85)#24,196 |
| 44. | 75229 | 0.27% | 2.2%(-1.95)#1,505 | 2.1%(-1.87)#24,272 |
| 45. | 75230 | 0.23% | 2.2%(-2.00)#1,515 | 2.1%(-1.92)#24,439 |
| 46. | 75210 | 0.13% | 2.2%(-2.09)#1,527 | 2.1%(-2.01)#24,670 |
1
Common Questions
What are the Top 10 Zip Codes with the Highest Percentage of Population Employed in Security & Protection in Dallas, TX?
Top 10 Zip Codes with the Highest Percentage of Population Employed in Security & Protection in Dallas, TX are:
What zip code has the Highest Percentage of Population Employed in Security & Protection in Dallas, TX?
75236 has the Highest Percentage of Population Employed in Security & Protection in Dallas, TX with 3.1%.
What is the Percentage of Population Employed in Security & Protection in Dallas, TX?
Percentage of Population Employed in Security & Protection in Dallas is 1.4%.
What is the Percentage of Population Employed in Security & Protection in Texas?
Percentage of Population Employed in Security & Protection in Texas is 2.2%.
What is the Percentage of Population Employed in Security & Protection in the United States?
Percentage of Population Employed in Security & Protection in the United States is 2.1%.