Zip Codes with the Highest Percentage of Population Employed in Security & Protection in Denison, TX
RELATED REPORTS & OPTIONS
Security & Protection
Denison
Compare Zip Codes
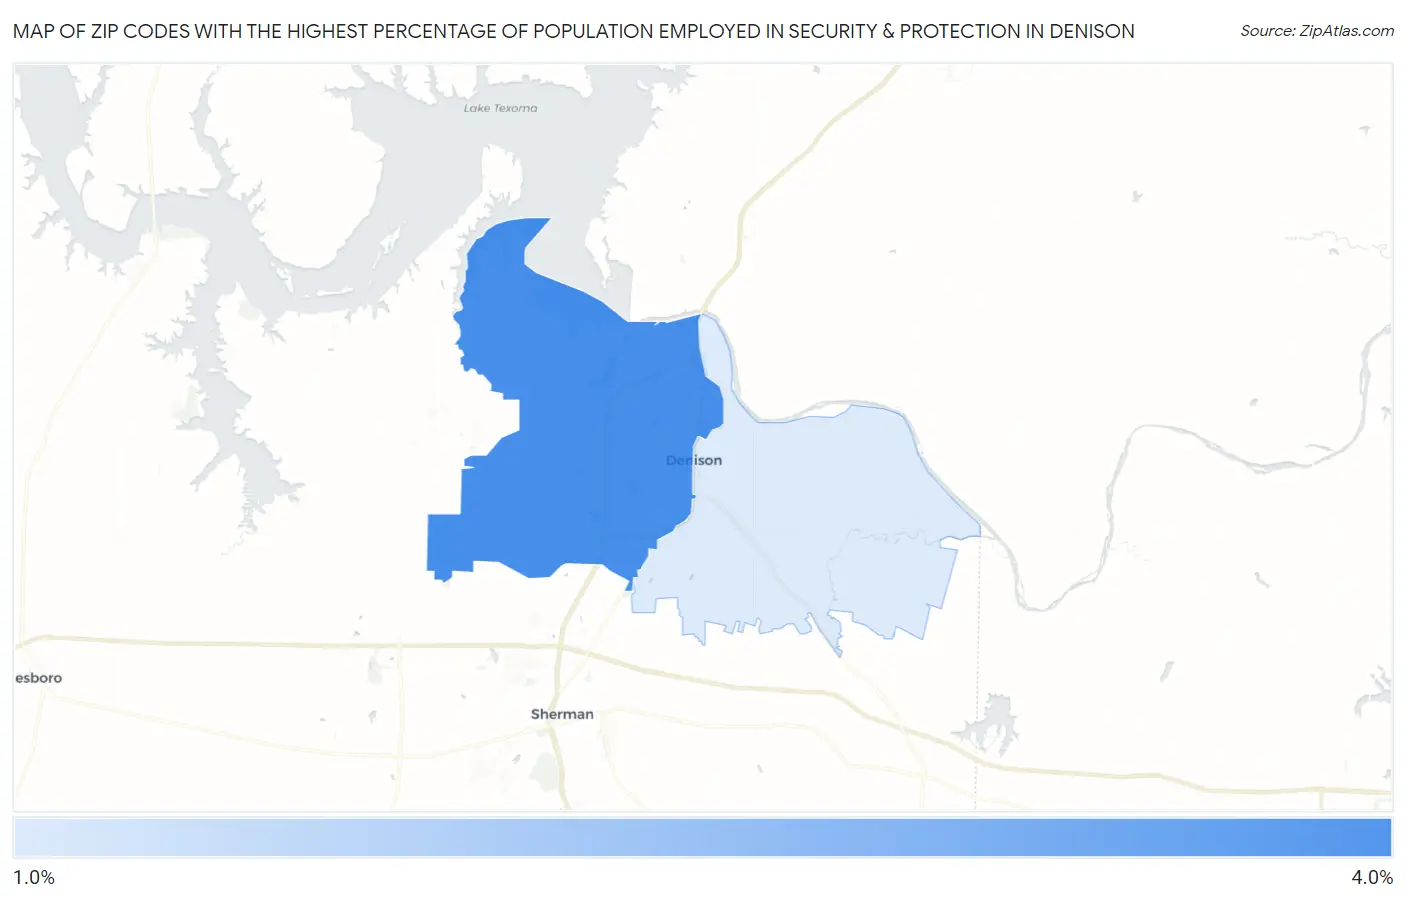
Map of Zip Codes with the Highest Percentage of Population Employed in Security & Protection in Denison
1.7%
3.2%
Zip Codes with the Highest Percentage of Population Employed in Security & Protection in Denison, TX
| Zip Code | % Employed | vs State | vs National | |
| 1. | 75020 | 3.2% | 2.2%(+1.00)#468 | 2.1%(+1.08)#6,469 |
| 2. | 75021 | 1.7% | 2.2%(-0.516)#992 | 2.1%(-0.441)#14,619 |
1
Common Questions
What are the Top Zip Codes with the Highest Percentage of Population Employed in Security & Protection in Denison, TX?
Top Zip Codes with the Highest Percentage of Population Employed in Security & Protection in Denison, TX are:
What zip code has the Highest Percentage of Population Employed in Security & Protection in Denison, TX?
75020 has the Highest Percentage of Population Employed in Security & Protection in Denison, TX with 3.2%.
What is the Percentage of Population Employed in Security & Protection in Denison, TX?
Percentage of Population Employed in Security & Protection in Denison is 2.4%.
What is the Percentage of Population Employed in Security & Protection in Texas?
Percentage of Population Employed in Security & Protection in Texas is 2.2%.
What is the Percentage of Population Employed in Security & Protection in the United States?
Percentage of Population Employed in Security & Protection in the United States is 2.1%.