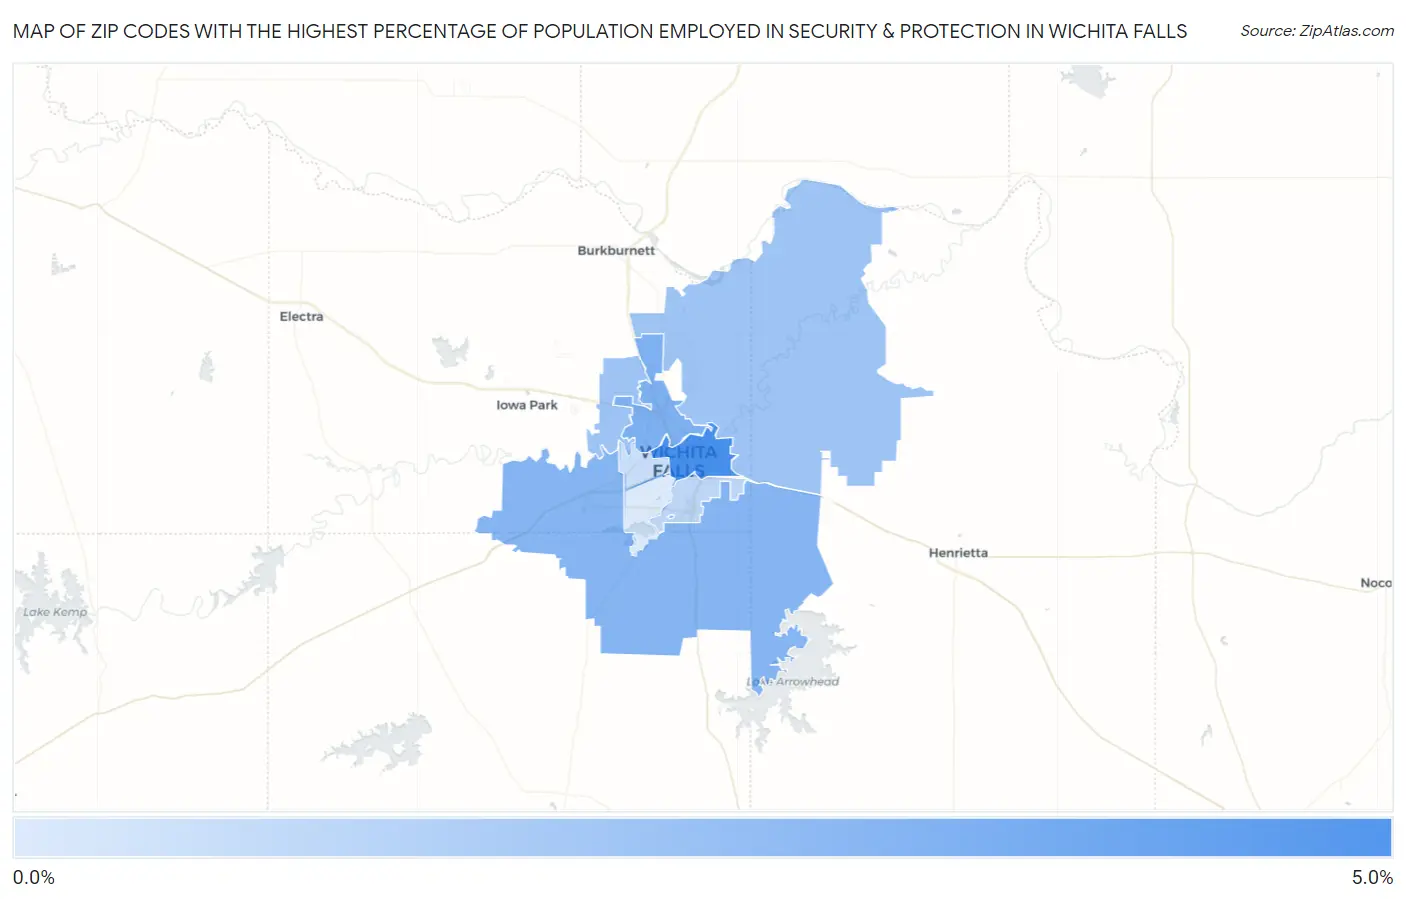
Zip Codes with the Highest Percentage of Population Employed in Security & Protection in Wichita Falls, TX
RELATED REPORTS & OPTIONS
Security & Protection
Wichita Falls
Compare Zip Codes
Map of Zip Codes with the Highest Percentage of Population Employed in Security & Protection in Wichita Falls
0.80%
4.5%
Zip Codes with the Highest Percentage of Population Employed in Security & Protection in Wichita Falls, TX
| Zip Code | % Employed | vs State | vs National | |
| 1. | 76301 | 4.5% | 2.2%(+2.29)#272 | 2.1%(+2.37)#3,587 |
| 2. | 76306 | 3.1% | 2.2%(+0.896)#493 | 2.1%(+0.972)#6,819 |
| 3. | 76310 | 2.9% | 2.2%(+0.715)#540 | 2.1%(+0.790)#7,484 |
| 4. | 76305 | 2.3% | 2.2%(+0.102)#734 | 2.1%(+0.177)#10,482 |
| 5. | 76302 | 1.6% | 2.2%(-0.636)#1,046 | 2.1%(-0.561)#15,498 |
| 6. | 76309 | 1.3% | 2.2%(-0.894)#1,156 | 2.1%(-0.818)#17,498 |
| 7. | 76308 | 0.80% | 2.2%(-1.42)#1,375 | 2.1%(-1.34)#21,384 |
1
Common Questions
What are the Top 5 Zip Codes with the Highest Percentage of Population Employed in Security & Protection in Wichita Falls, TX?
Top 5 Zip Codes with the Highest Percentage of Population Employed in Security & Protection in Wichita Falls, TX are:
What zip code has the Highest Percentage of Population Employed in Security & Protection in Wichita Falls, TX?
76301 has the Highest Percentage of Population Employed in Security & Protection in Wichita Falls, TX with 4.5%.
What is the Percentage of Population Employed in Security & Protection in Wichita Falls, TX?
Percentage of Population Employed in Security & Protection in Wichita Falls is 2.4%.
What is the Percentage of Population Employed in Security & Protection in Texas?
Percentage of Population Employed in Security & Protection in Texas is 2.2%.
What is the Percentage of Population Employed in Security & Protection in the United States?
Percentage of Population Employed in Security & Protection in the United States is 2.1%.