Zip Codes with the Highest Percentage of Population Employed in Security & Protection in Rockwall, TX
RELATED REPORTS & OPTIONS
Security & Protection
Rockwall
Compare Zip Codes
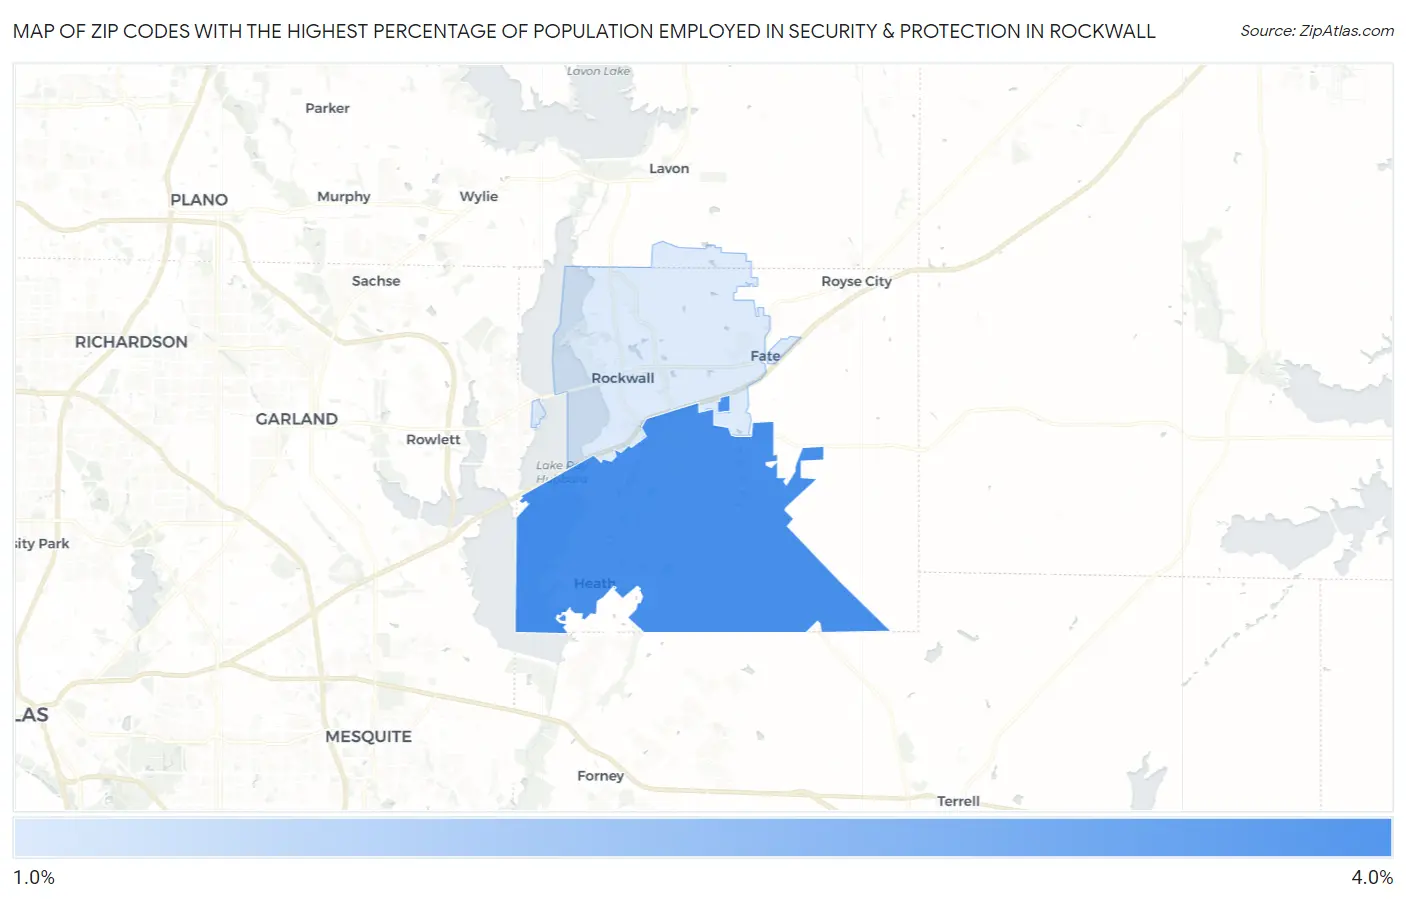
Map of Zip Codes with the Highest Percentage of Population Employed in Security & Protection in Rockwall
1.4%
3.0%
Zip Codes with the Highest Percentage of Population Employed in Security & Protection in Rockwall, TX
| Zip Code | % Employed | vs State | vs National | |
| 1. | 75032 | 3.0% | 2.2%(+0.781)#516 | 2.1%(+0.856)#7,211 |
| 2. | 75087 | 1.4% | 2.2%(-0.861)#1,147 | 2.1%(-0.785)#17,226 |
1
Common Questions
What are the Top Zip Codes with the Highest Percentage of Population Employed in Security & Protection in Rockwall, TX?
Top Zip Codes with the Highest Percentage of Population Employed in Security & Protection in Rockwall, TX are:
What zip code has the Highest Percentage of Population Employed in Security & Protection in Rockwall, TX?
75032 has the Highest Percentage of Population Employed in Security & Protection in Rockwall, TX with 3.0%.
What is the Percentage of Population Employed in Security & Protection in Rockwall, TX?
Percentage of Population Employed in Security & Protection in Rockwall is 2.4%.
What is the Percentage of Population Employed in Security & Protection in Texas?
Percentage of Population Employed in Security & Protection in Texas is 2.2%.
What is the Percentage of Population Employed in Security & Protection in the United States?
Percentage of Population Employed in Security & Protection in the United States is 2.1%.