Zip Codes with the Highest Percentage of Population Employed in Security & Protection in San Angelo, TX
RELATED REPORTS & OPTIONS
Security & Protection
San Angelo
Compare Zip Codes
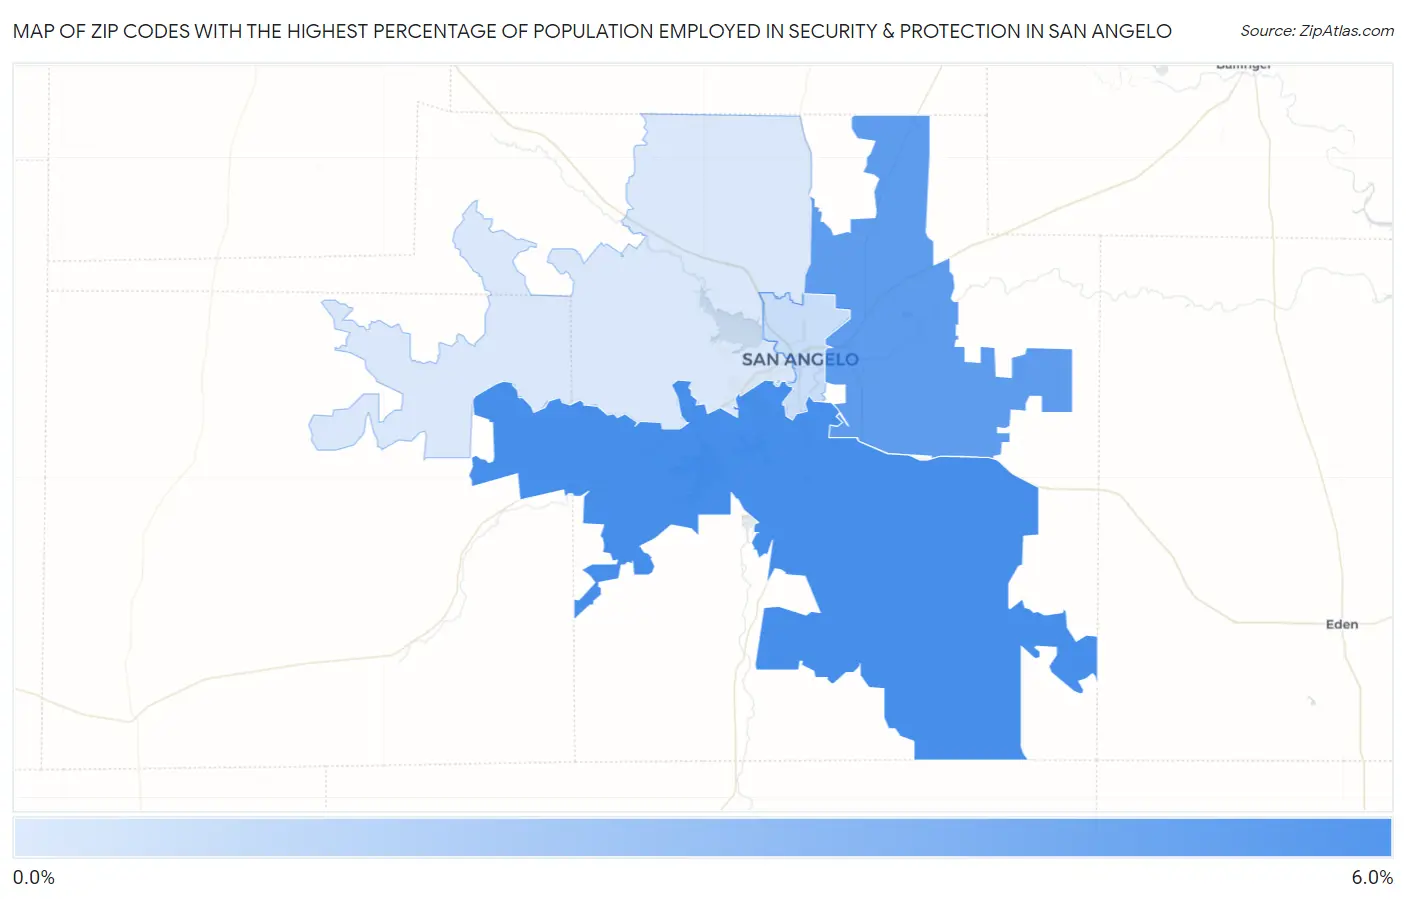
Map of Zip Codes with the Highest Percentage of Population Employed in Security & Protection in San Angelo
1.1%
5.3%
Zip Codes with the Highest Percentage of Population Employed in Security & Protection in San Angelo, TX
| Zip Code | % Employed | vs State | vs National | |
| 1. | 76904 | 5.3% | 2.2%(+3.10)#199 | 2.1%(+3.17)#2,614 |
| 2. | 76905 | 4.7% | 2.2%(+2.46)#258 | 2.1%(+2.54)#3,326 |
| 3. | 76903 | 1.7% | 2.2%(-0.481)#979 | 2.1%(-0.406)#14,367 |
| 4. | 76901 | 1.2% | 2.2%(-0.987)#1,189 | 2.1%(-0.912)#18,227 |
| 5. | 76909 | 1.1% | 2.2%(-1.08)#1,226 | 2.1%(-1.00)#18,939 |
1
Common Questions
What are the Top 3 Zip Codes with the Highest Percentage of Population Employed in Security & Protection in San Angelo, TX?
Top 3 Zip Codes with the Highest Percentage of Population Employed in Security & Protection in San Angelo, TX are:
What zip code has the Highest Percentage of Population Employed in Security & Protection in San Angelo, TX?
76904 has the Highest Percentage of Population Employed in Security & Protection in San Angelo, TX with 5.3%.
What is the Percentage of Population Employed in Security & Protection in San Angelo, TX?
Percentage of Population Employed in Security & Protection in San Angelo is 3.3%.
What is the Percentage of Population Employed in Security & Protection in Texas?
Percentage of Population Employed in Security & Protection in Texas is 2.2%.
What is the Percentage of Population Employed in Security & Protection in the United States?
Percentage of Population Employed in Security & Protection in the United States is 2.1%.