Zip Codes with the Highest Percentage of Population Employed in Security & Protection in Hurst, TX
RELATED REPORTS & OPTIONS
Security & Protection
Hurst
Compare Zip Codes
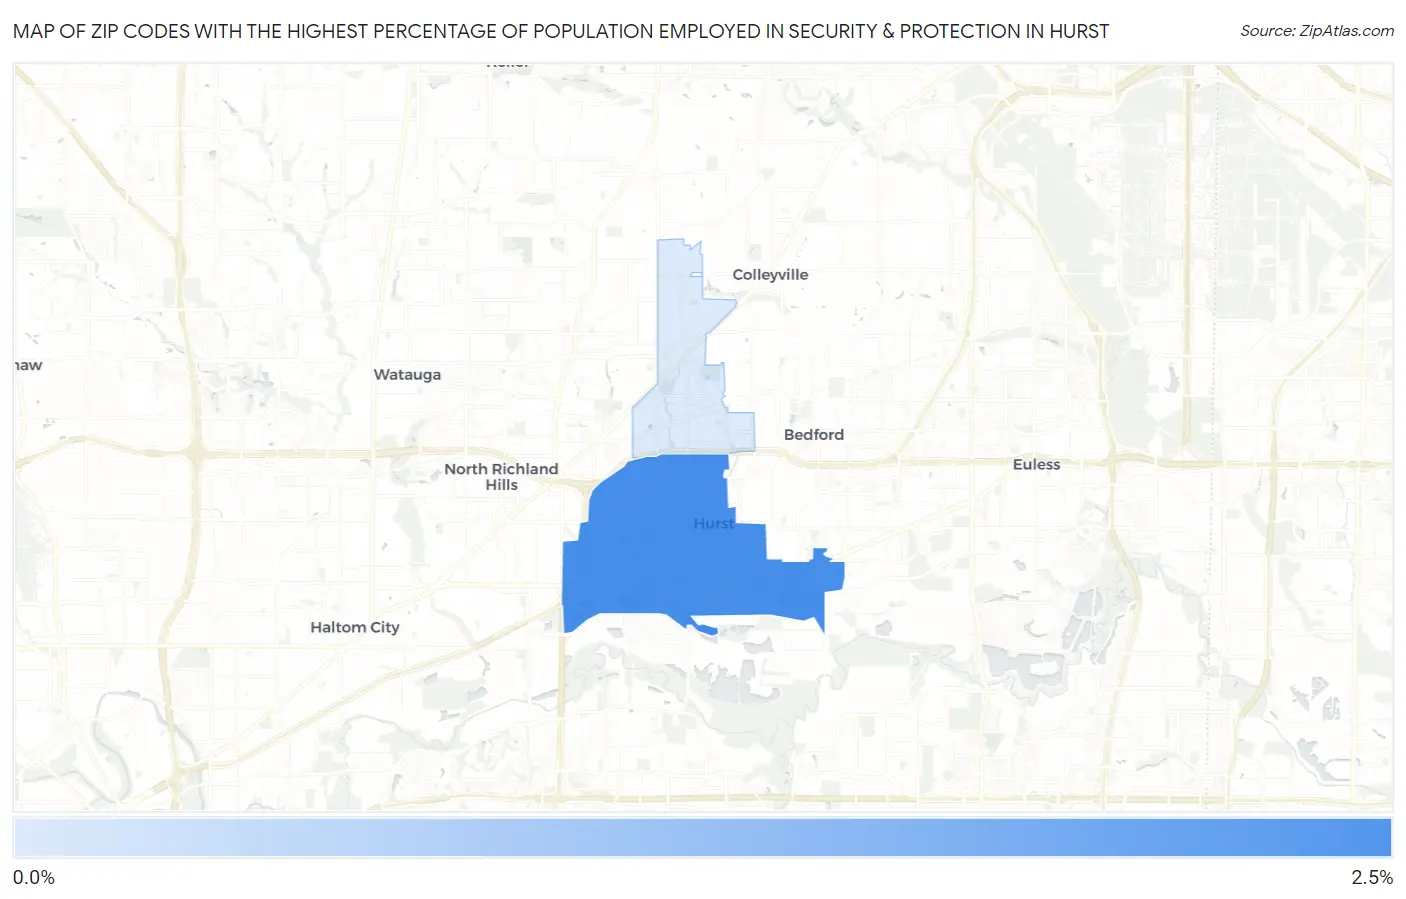
Map of Zip Codes with the Highest Percentage of Population Employed in Security & Protection in Hurst
0.48%
2.5%
Zip Codes with the Highest Percentage of Population Employed in Security & Protection in Hurst, TX
| Zip Code | % Employed | vs State | vs National | |
| 1. | 76053 | 2.5% | 2.2%(+0.237)#683 | 2.1%(+0.313)#9,730 |
| 2. | 76054 | 0.48% | 2.2%(-1.75)#1,470 | 2.1%(-1.67)#23,354 |
1
Common Questions
What are the Top Zip Codes with the Highest Percentage of Population Employed in Security & Protection in Hurst, TX?
Top Zip Codes with the Highest Percentage of Population Employed in Security & Protection in Hurst, TX are:
What zip code has the Highest Percentage of Population Employed in Security & Protection in Hurst, TX?
76053 has the Highest Percentage of Population Employed in Security & Protection in Hurst, TX with 2.5%.
What is the Percentage of Population Employed in Security & Protection in Hurst, TX?
Percentage of Population Employed in Security & Protection in Hurst is 1.8%.
What is the Percentage of Population Employed in Security & Protection in Texas?
Percentage of Population Employed in Security & Protection in Texas is 2.2%.
What is the Percentage of Population Employed in Security & Protection in the United States?
Percentage of Population Employed in Security & Protection in the United States is 2.1%.