Zip Codes with the Highest Percentage of Population Employed in Security & Protection in Gilmer, TX
RELATED REPORTS & OPTIONS
Security & Protection
Gilmer
Compare Zip Codes
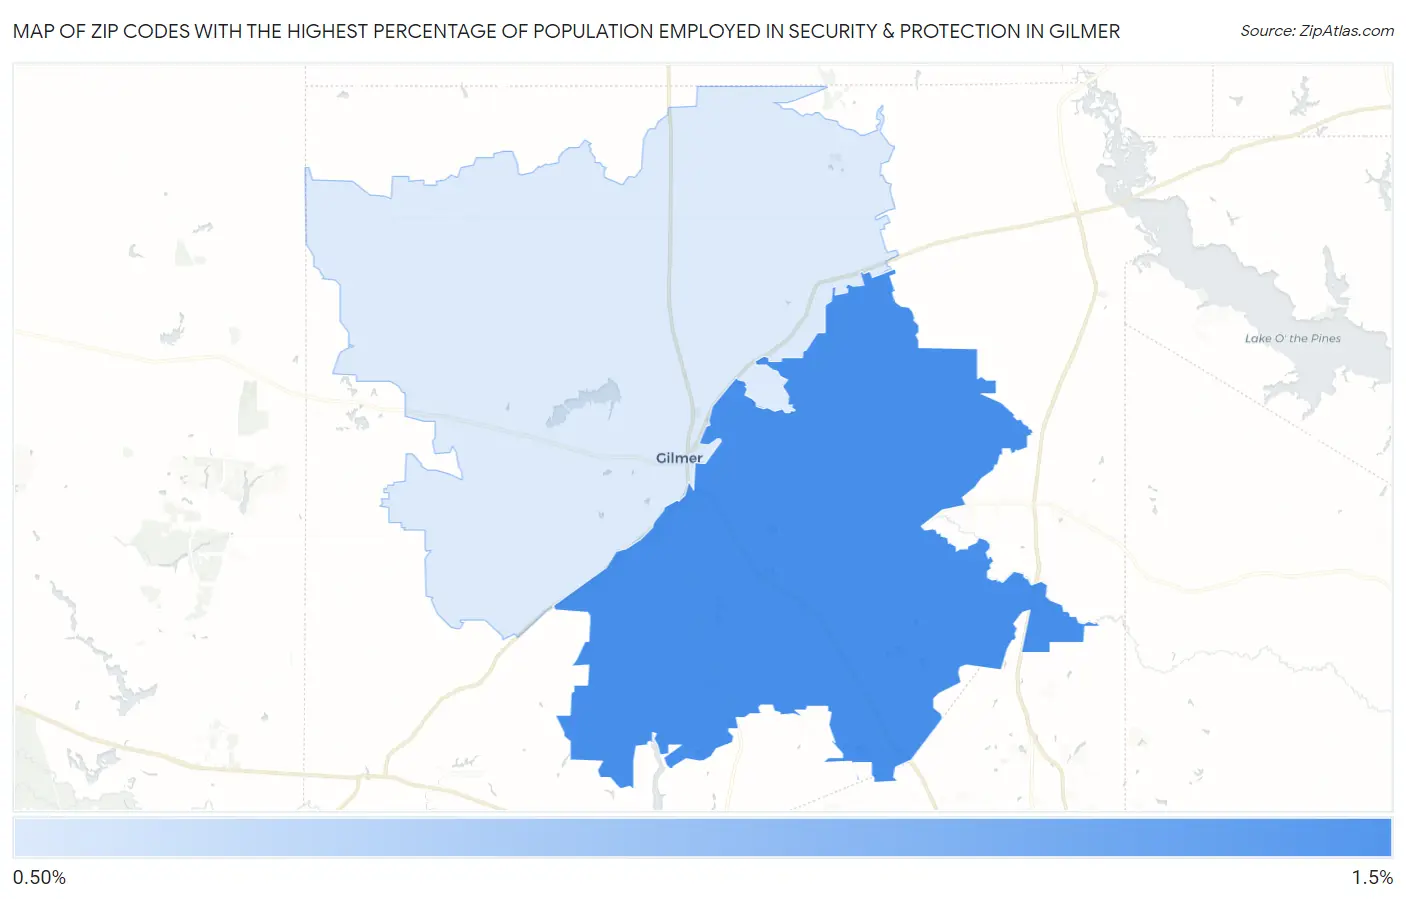
Map of Zip Codes with the Highest Percentage of Population Employed in Security & Protection in Gilmer
0.92%
1.4%
Zip Codes with the Highest Percentage of Population Employed in Security & Protection in Gilmer, TX
| Zip Code | % Employed | vs State | vs National | |
| 1. | 75645 | 1.4% | 2.2%(-0.816)#1,119 | 2.1%(-0.741)#16,894 |
| 2. | 75644 | 0.92% | 2.2%(-1.31)#1,337 | 2.1%(-1.23)#20,663 |
1
Common Questions
What are the Top Zip Codes with the Highest Percentage of Population Employed in Security & Protection in Gilmer, TX?
Top Zip Codes with the Highest Percentage of Population Employed in Security & Protection in Gilmer, TX are:
What zip code has the Highest Percentage of Population Employed in Security & Protection in Gilmer, TX?
75645 has the Highest Percentage of Population Employed in Security & Protection in Gilmer, TX with 1.4%.
What is the Percentage of Population Employed in Security & Protection in Gilmer, TX?
Percentage of Population Employed in Security & Protection in Gilmer is 0.66%.
What is the Percentage of Population Employed in Security & Protection in Texas?
Percentage of Population Employed in Security & Protection in Texas is 2.2%.
What is the Percentage of Population Employed in Security & Protection in the United States?
Percentage of Population Employed in Security & Protection in the United States is 2.1%.