Zip Codes with the Highest Percentage of Population Employed in Security & Protection in Conroe, TX
RELATED REPORTS & OPTIONS
Security & Protection
Conroe
Compare Zip Codes
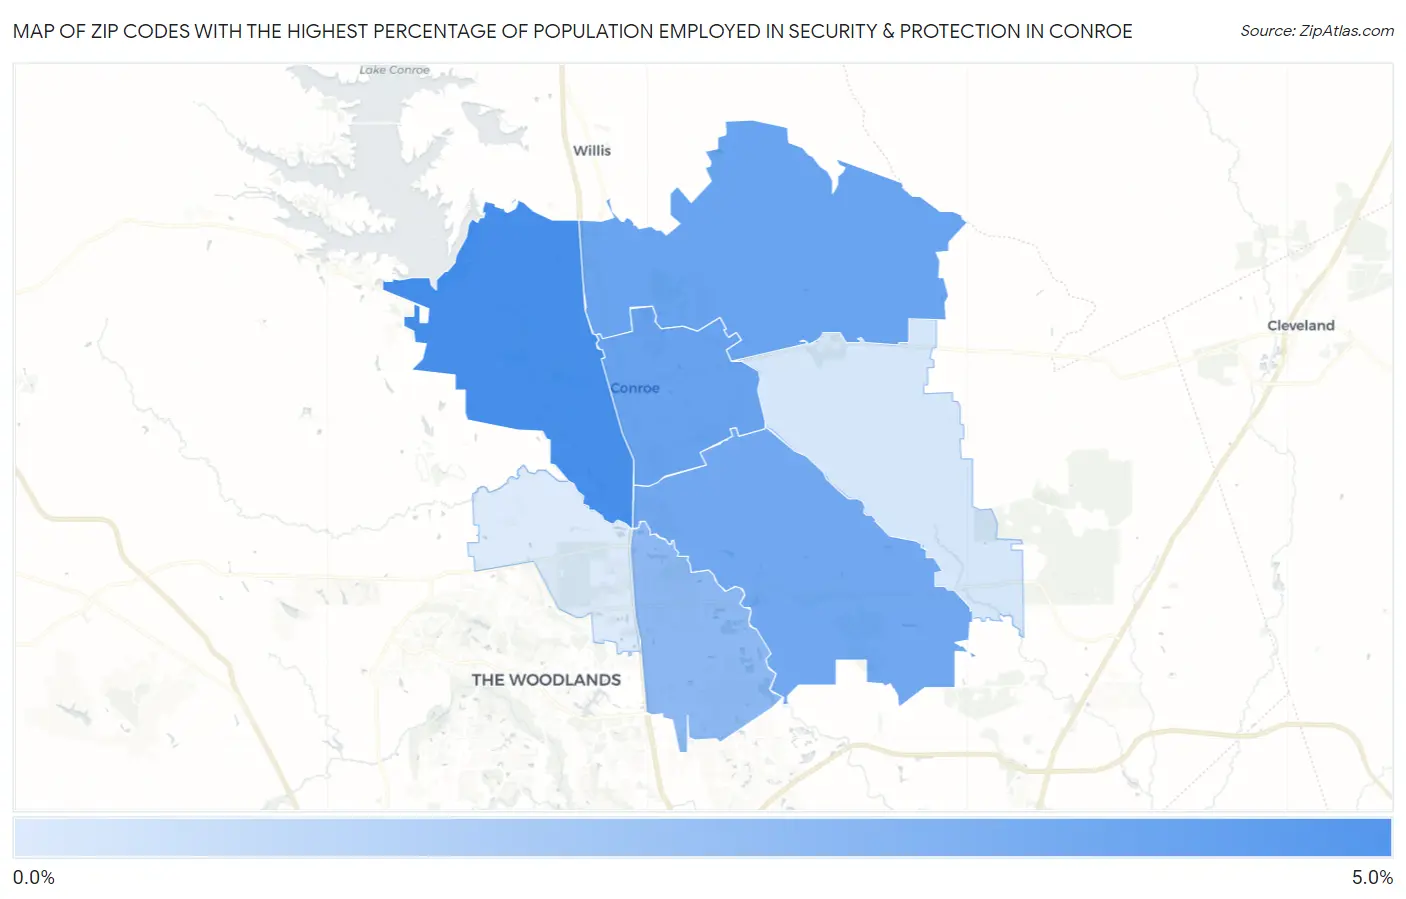
Map of Zip Codes with the Highest Percentage of Population Employed in Security & Protection in Conroe
0.72%
4.0%
Zip Codes with the Highest Percentage of Population Employed in Security & Protection in Conroe, TX
| Zip Code | % Employed | vs State | vs National | |
| 1. | 77304 | 4.0% | 2.2%(+1.83)#319 | 2.1%(+1.90)#4,403 |
| 2. | 77301 | 3.3% | 2.2%(+1.08)#453 | 2.1%(+1.16)#6,230 |
| 3. | 77303 | 3.3% | 2.2%(+1.06)#457 | 2.1%(+1.13)#6,302 |
| 4. | 77302 | 3.1% | 2.2%(+0.886)#495 | 2.1%(+0.961)#6,856 |
| 5. | 77385 | 2.5% | 2.2%(+0.252)#679 | 2.1%(+0.327)#9,645 |
| 6. | 77306 | 0.88% | 2.2%(-1.34)#1,353 | 2.1%(-1.27)#20,916 |
| 7. | 77384 | 0.72% | 2.2%(-1.50)#1,402 | 2.1%(-1.43)#21,933 |
1
Common Questions
What are the Top 5 Zip Codes with the Highest Percentage of Population Employed in Security & Protection in Conroe, TX?
Top 5 Zip Codes with the Highest Percentage of Population Employed in Security & Protection in Conroe, TX are:
What zip code has the Highest Percentage of Population Employed in Security & Protection in Conroe, TX?
77304 has the Highest Percentage of Population Employed in Security & Protection in Conroe, TX with 4.0%.
What is the Percentage of Population Employed in Security & Protection in Conroe, TX?
Percentage of Population Employed in Security & Protection in Conroe is 3.4%.
What is the Percentage of Population Employed in Security & Protection in Texas?
Percentage of Population Employed in Security & Protection in Texas is 2.2%.
What is the Percentage of Population Employed in Security & Protection in the United States?
Percentage of Population Employed in Security & Protection in the United States is 2.1%.