Zip Codes with the Highest Percentage of Population Employed in Security & Protection in North Richland Hills, TX
RELATED REPORTS & OPTIONS
Security & Protection
North Richland Hills
Compare Zip Codes
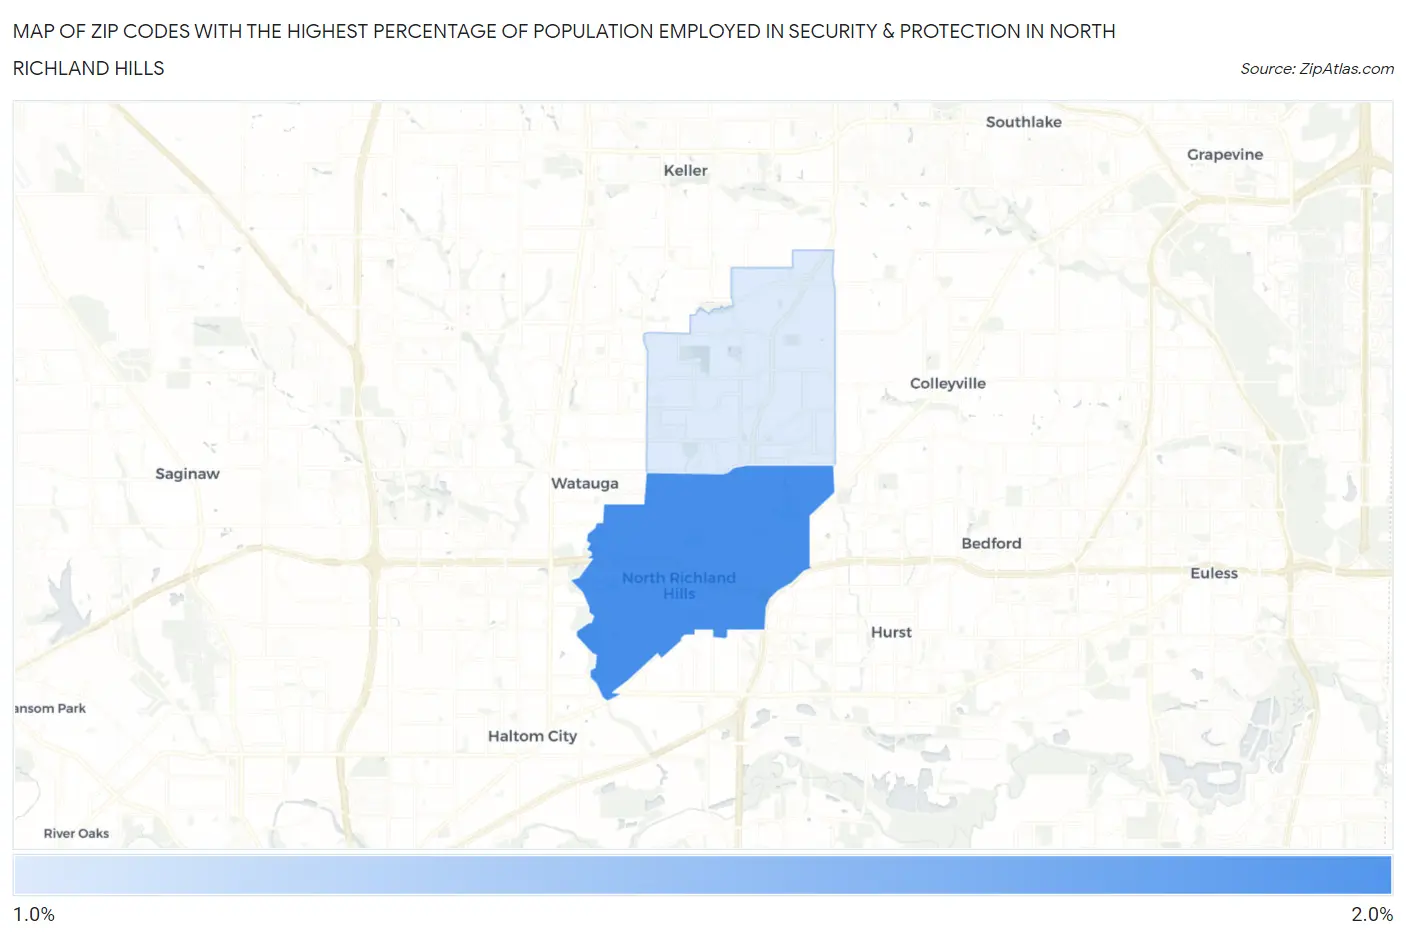
Map of Zip Codes with the Highest Percentage of Population Employed in Security & Protection in North Richland Hills
1.3%
1.7%
Zip Codes with the Highest Percentage of Population Employed in Security & Protection in North Richland Hills, TX
| Zip Code | % Employed | vs State | vs National | |
| 1. | 76180 | 1.7% | 2.2%(-0.573)#1,013 | 2.1%(-0.498)#15,030 |
| 2. | 76182 | 1.3% | 2.2%(-0.886)#1,153 | 2.1%(-0.810)#17,431 |
1
Common Questions
What are the Top Zip Codes with the Highest Percentage of Population Employed in Security & Protection in North Richland Hills, TX?
Top Zip Codes with the Highest Percentage of Population Employed in Security & Protection in North Richland Hills, TX are:
What zip code has the Highest Percentage of Population Employed in Security & Protection in North Richland Hills, TX?
76180 has the Highest Percentage of Population Employed in Security & Protection in North Richland Hills, TX with 1.7%.
What is the Percentage of Population Employed in Security & Protection in North Richland Hills, TX?
Percentage of Population Employed in Security & Protection in North Richland Hills is 1.5%.
What is the Percentage of Population Employed in Security & Protection in Texas?
Percentage of Population Employed in Security & Protection in Texas is 2.2%.
What is the Percentage of Population Employed in Security & Protection in the United States?
Percentage of Population Employed in Security & Protection in the United States is 2.1%.