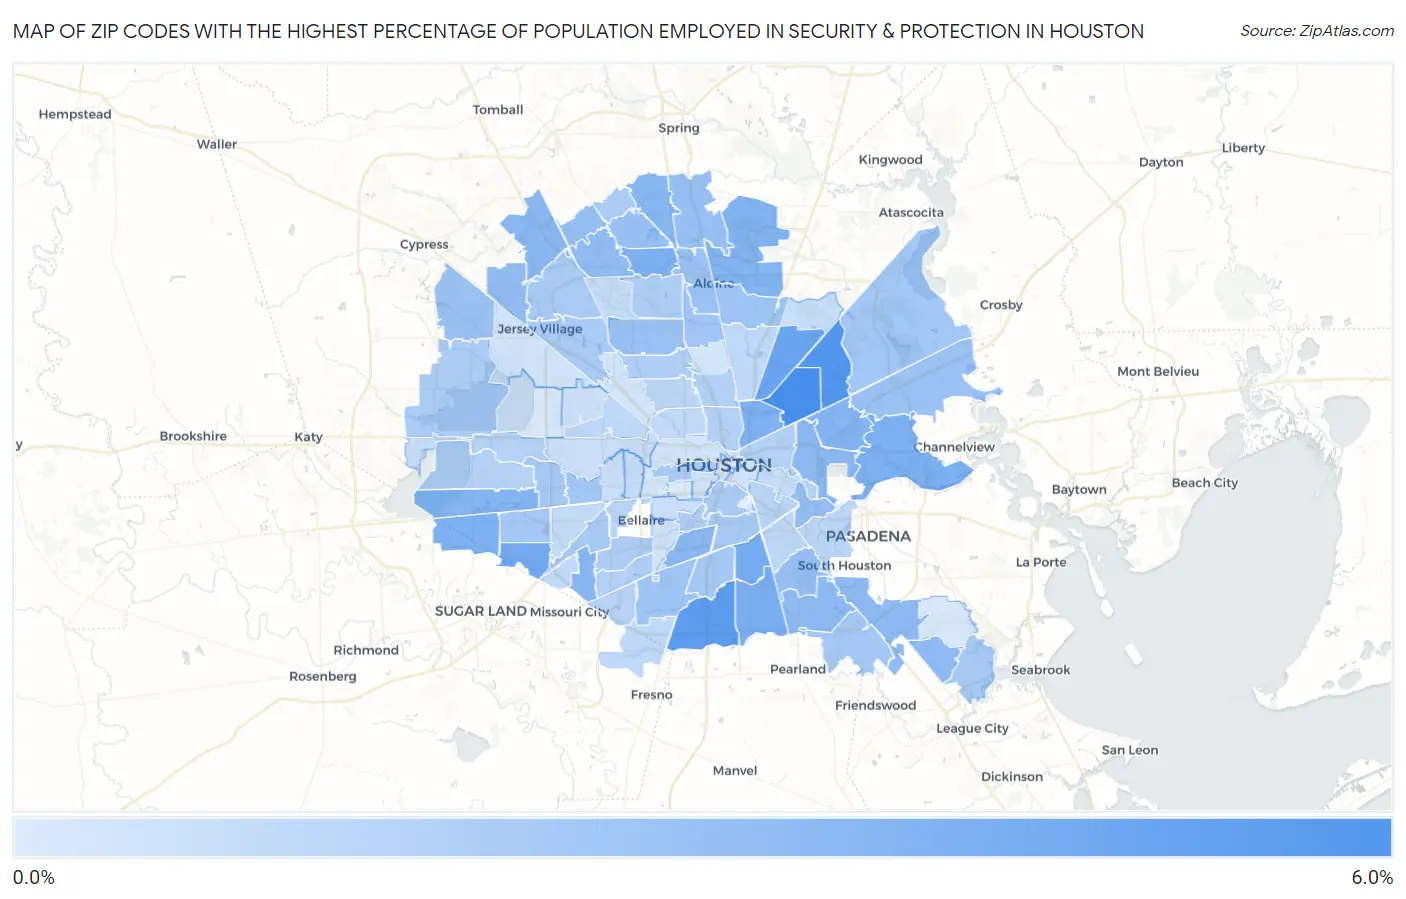
Zip Codes with the Highest Percentage of Population Employed in Security & Protection in Houston, TX
RELATED REPORTS & OPTIONS
Security & Protection
Houston
Compare Zip Codes
Map of Zip Codes with the Highest Percentage of Population Employed in Security & Protection in Houston
0.080%
5.3%
Zip Codes with the Highest Percentage of Population Employed in Security & Protection in Houston, TX
| Zip Code | % Employed | vs State | vs National | |
| 1. | 77028 | 5.3% | 2.2%(+3.09)#202 | 2.1%(+3.16)#2,633 |
| 2. | 77078 | 4.9% | 2.2%(+2.70)#237 | 2.1%(+2.77)#3,019 |
| 3. | 77047 | 4.5% | 2.2%(+2.31)#267 | 2.1%(+2.39)#3,550 |
| 4. | 77016 | 4.1% | 2.2%(+1.85)#318 | 2.1%(+1.92)#4,359 |
| 5. | 77099 | 3.8% | 2.2%(+1.53)#370 | 2.1%(+1.60)#5,023 |
| 6. | 77033 | 3.7% | 2.2%(+1.48)#383 | 2.1%(+1.55)#5,146 |
| 7. | 77048 | 3.5% | 2.2%(+1.31)#413 | 2.1%(+1.38)#5,596 |
| 8. | 77067 | 3.4% | 2.2%(+1.17)#439 | 2.1%(+1.24)#5,959 |
| 9. | 77015 | 3.4% | 2.2%(+1.17)#440 | 2.1%(+1.24)#5,961 |
| 10. | 77083 | 3.4% | 2.2%(+1.13)#444 | 2.1%(+1.21)#6,080 |
| 11. | 77026 | 3.3% | 2.2%(+1.09)#450 | 2.1%(+1.17)#6,196 |
| 12. | 77032 | 3.2% | 2.2%(+0.999)#469 | 2.1%(+1.07)#6,489 |
| 13. | 77082 | 3.1% | 2.2%(+0.883)#497 | 2.1%(+0.959)#6,866 |
| 14. | 77013 | 3.1% | 2.2%(+0.860)#501 | 2.1%(+0.935)#6,940 |
| 15. | 77090 | 3.0% | 2.2%(+0.790)#513 | 2.1%(+0.866)#7,173 |
| 16. | 77071 | 3.0% | 2.2%(+0.765)#521 | 2.1%(+0.841)#7,267 |
| 17. | 77070 | 2.9% | 2.2%(+0.723)#534 | 2.1%(+0.799)#7,447 |
| 18. | 77054 | 2.9% | 2.2%(+0.681)#548 | 2.1%(+0.757)#7,617 |
| 19. | 77029 | 2.8% | 2.2%(+0.606)#569 | 2.1%(+0.681)#7,974 |
| 20. | 77075 | 2.8% | 2.2%(+0.580)#576 | 2.1%(+0.655)#8,102 |
| 21. | 77034 | 2.8% | 2.2%(+0.570)#580 | 2.1%(+0.646)#8,137 |
| 22. | 77062 | 2.8% | 2.2%(+0.528)#592 | 2.1%(+0.604)#8,308 |
| 23. | 77066 | 2.7% | 2.2%(+0.440)#613 | 2.1%(+0.516)#8,697 |
| 24. | 77065 | 2.6% | 2.2%(+0.371)#635 | 2.1%(+0.446)#9,031 |
| 25. | 77012 | 2.5% | 2.2%(+0.311)#655 | 2.1%(+0.386)#9,330 |
| 26. | 77069 | 2.5% | 2.2%(+0.304)#656 | 2.1%(+0.380)#9,366 |
| 27. | 77014 | 2.5% | 2.2%(+0.255)#674 | 2.1%(+0.330)#9,626 |
| 28. | 77073 | 2.5% | 2.2%(+0.242)#682 | 2.1%(+0.318)#9,695 |
| 29. | 77061 | 2.4% | 2.2%(+0.207)#695 | 2.1%(+0.282)#9,893 |
| 30. | 77046 | 2.4% | 2.2%(+0.190)#704 | 2.1%(+0.265)#9,990 |
| 31. | 77095 | 2.4% | 2.2%(+0.158)#715 | 2.1%(+0.233)#10,146 |
| 32. | 77060 | 2.4% | 2.2%(+0.142)#722 | 2.1%(+0.218)#10,249 |
| 33. | 77049 | 2.4% | 2.2%(+0.127)#727 | 2.1%(+0.203)#10,319 |
| 34. | 77088 | 2.3% | 2.2%(+0.098)#735 | 2.1%(+0.173)#10,508 |
| 35. | 77039 | 2.2% | 2.2%(+0.012)#767 | 2.1%(+0.088)#11,038 |
| 36. | 77045 | 2.2% | 2.2%(-0.037)#781 | 2.1%(+0.039)#11,331 |
| 37. | 77037 | 2.2% | 2.2%(-0.072)#790 | 2.1%(+0.004)#11,554 |
| 38. | 77044 | 2.0% | 2.2%(-0.192)#846 | 2.1%(-0.117)#12,356 |
| 39. | 77063 | 2.0% | 2.2%(-0.193)#848 | 2.1%(-0.118)#12,362 |
| 40. | 77051 | 2.0% | 2.2%(-0.218)#855 | 2.1%(-0.143)#12,529 |
| 41. | 77072 | 2.0% | 2.2%(-0.247)#874 | 2.1%(-0.171)#12,707 |
| 42. | 77042 | 2.0% | 2.2%(-0.269)#880 | 2.1%(-0.194)#12,859 |
| 43. | 77089 | 1.9% | 2.2%(-0.281)#885 | 2.1%(-0.205)#12,928 |
| 44. | 77058 | 1.9% | 2.2%(-0.307)#895 | 2.1%(-0.232)#13,103 |
| 45. | 77021 | 1.9% | 2.2%(-0.322)#905 | 2.1%(-0.247)#13,209 |
| 46. | 77074 | 1.9% | 2.2%(-0.339)#916 | 2.1%(-0.263)#13,344 |
| 47. | 77040 | 1.8% | 2.2%(-0.387)#932 | 2.1%(-0.312)#13,669 |
| 48. | 77004 | 1.8% | 2.2%(-0.412)#942 | 2.1%(-0.336)#13,840 |
| 49. | 77019 | 1.8% | 2.2%(-0.428)#950 | 2.1%(-0.353)#13,980 |
| 50. | 77064 | 1.8% | 2.2%(-0.434)#955 | 2.1%(-0.358)#14,025 |
| 51. | 77068 | 1.8% | 2.2%(-0.457)#969 | 2.1%(-0.382)#14,178 |
| 52. | 77084 | 1.8% | 2.2%(-0.468)#974 | 2.1%(-0.392)#14,258 |
| 53. | 77038 | 1.7% | 2.2%(-0.566)#1,010 | 2.1%(-0.490)#14,992 |
| 54. | 77030 | 1.6% | 2.2%(-0.580)#1,020 | 2.1%(-0.505)#15,091 |
| 55. | 77096 | 1.6% | 2.2%(-0.597)#1,025 | 2.1%(-0.521)#15,203 |
| 56. | 77091 | 1.6% | 2.2%(-0.615)#1,034 | 2.1%(-0.540)#15,347 |
| 57. | 77022 | 1.5% | 2.2%(-0.693)#1,073 | 2.1%(-0.617)#15,933 |
| 58. | 77009 | 1.5% | 2.2%(-0.696)#1,074 | 2.1%(-0.620)#15,963 |
| 59. | 77035 | 1.5% | 2.2%(-0.725)#1,085 | 2.1%(-0.649)#16,216 |
| 60. | 77020 | 1.5% | 2.2%(-0.756)#1,092 | 2.1%(-0.681)#16,442 |
| 61. | 77079 | 1.4% | 2.2%(-0.786)#1,106 | 2.1%(-0.710)#16,676 |
| 62. | 77077 | 1.4% | 2.2%(-0.821)#1,123 | 2.1%(-0.746)#16,926 |
| 63. | 77081 | 1.4% | 2.2%(-0.870)#1,149 | 2.1%(-0.794)#17,301 |
| 64. | 77085 | 1.3% | 2.2%(-0.905)#1,160 | 2.1%(-0.829)#17,591 |
| 65. | 77023 | 1.2% | 2.2%(-0.994)#1,194 | 2.1%(-0.918)#18,280 |
| 66. | 77017 | 1.2% | 2.2%(-1.01)#1,197 | 2.1%(-0.930)#18,371 |
| 67. | 77018 | 1.2% | 2.2%(-1.04)#1,211 | 2.1%(-0.965)#18,641 |
| 68. | 77053 | 1.1% | 2.2%(-1.11)#1,234 | 2.1%(-1.03)#19,171 |
| 69. | 77093 | 1.1% | 2.2%(-1.12)#1,241 | 2.1%(-1.05)#19,274 |
| 70. | 77087 | 1.1% | 2.2%(-1.14)#1,249 | 2.1%(-1.06)#19,403 |
| 71. | 77055 | 1.1% | 2.2%(-1.14)#1,253 | 2.1%(-1.07)#19,434 |
| 72. | 77008 | 1.1% | 2.2%(-1.17)#1,273 | 2.1%(-1.10)#19,656 |
| 73. | 77031 | 1.0% | 2.2%(-1.20)#1,283 | 2.1%(-1.12)#19,819 |
| 74. | 77036 | 0.96% | 2.2%(-1.26)#1,319 | 2.1%(-1.19)#20,344 |
| 75. | 77056 | 0.86% | 2.2%(-1.36)#1,358 | 2.1%(-1.29)#21,034 |
| 76. | 77086 | 0.84% | 2.2%(-1.38)#1,368 | 2.1%(-1.31)#21,163 |
| 77. | 77011 | 0.80% | 2.2%(-1.42)#1,376 | 2.1%(-1.35)#21,392 |
| 78. | 77094 | 0.79% | 2.2%(-1.43)#1,379 | 2.1%(-1.35)#21,453 |
| 79. | 77050 | 0.79% | 2.2%(-1.44)#1,384 | 2.1%(-1.36)#21,492 |
| 80. | 77005 | 0.72% | 2.2%(-1.50)#1,400 | 2.1%(-1.43)#21,920 |
| 81. | 77024 | 0.71% | 2.2%(-1.52)#1,408 | 2.1%(-1.44)#22,041 |
| 82. | 77057 | 0.70% | 2.2%(-1.52)#1,413 | 2.1%(-1.45)#22,070 |
| 83. | 77080 | 0.61% | 2.2%(-1.62)#1,434 | 2.1%(-1.54)#22,625 |
| 84. | 77006 | 0.58% | 2.2%(-1.64)#1,442 | 2.1%(-1.57)#22,767 |
| 85. | 77041 | 0.48% | 2.2%(-1.75)#1,471 | 2.1%(-1.67)#23,360 |
| 86. | 77003 | 0.47% | 2.2%(-1.75)#1,474 | 2.1%(-1.68)#23,399 |
| 87. | 77025 | 0.45% | 2.2%(-1.78)#1,479 | 2.1%(-1.70)#23,503 |
| 88. | 77092 | 0.42% | 2.2%(-1.80)#1,483 | 2.1%(-1.73)#23,627 |
| 89. | 77076 | 0.41% | 2.2%(-1.81)#1,484 | 2.1%(-1.74)#23,676 |
| 90. | 77027 | 0.41% | 2.2%(-1.82)#1,485 | 2.1%(-1.74)#23,694 |
| 91. | 77007 | 0.40% | 2.2%(-1.83)#1,486 | 2.1%(-1.75)#23,740 |
| 92. | 77059 | 0.27% | 2.2%(-1.95)#1,506 | 2.1%(-1.88)#24,277 |
| 93. | 77043 | 0.25% | 2.2%(-1.97)#1,511 | 2.1%(-1.90)#24,360 |
| 94. | 77002 | 0.24% | 2.2%(-1.99)#1,513 | 2.1%(-1.91)#24,415 |
| 95. | 77098 | 0.080% | 2.2%(-2.14)#1,533 | 2.1%(-2.07)#24,740 |
1
Common Questions
What are the Top 10 Zip Codes with the Highest Percentage of Population Employed in Security & Protection in Houston, TX?
Top 10 Zip Codes with the Highest Percentage of Population Employed in Security & Protection in Houston, TX are:
What zip code has the Highest Percentage of Population Employed in Security & Protection in Houston, TX?
77028 has the Highest Percentage of Population Employed in Security & Protection in Houston, TX with 5.3%.
What is the Percentage of Population Employed in Security & Protection in Houston, TX?
Percentage of Population Employed in Security & Protection in Houston is 1.8%.
What is the Percentage of Population Employed in Security & Protection in Texas?
Percentage of Population Employed in Security & Protection in Texas is 2.2%.
What is the Percentage of Population Employed in Security & Protection in the United States?
Percentage of Population Employed in Security & Protection in the United States is 2.1%.