Zip Codes with the Highest Percentage of Population Employed in Security & Protection in Midland, TX
RELATED REPORTS & OPTIONS
Security & Protection
Midland
Compare Zip Codes
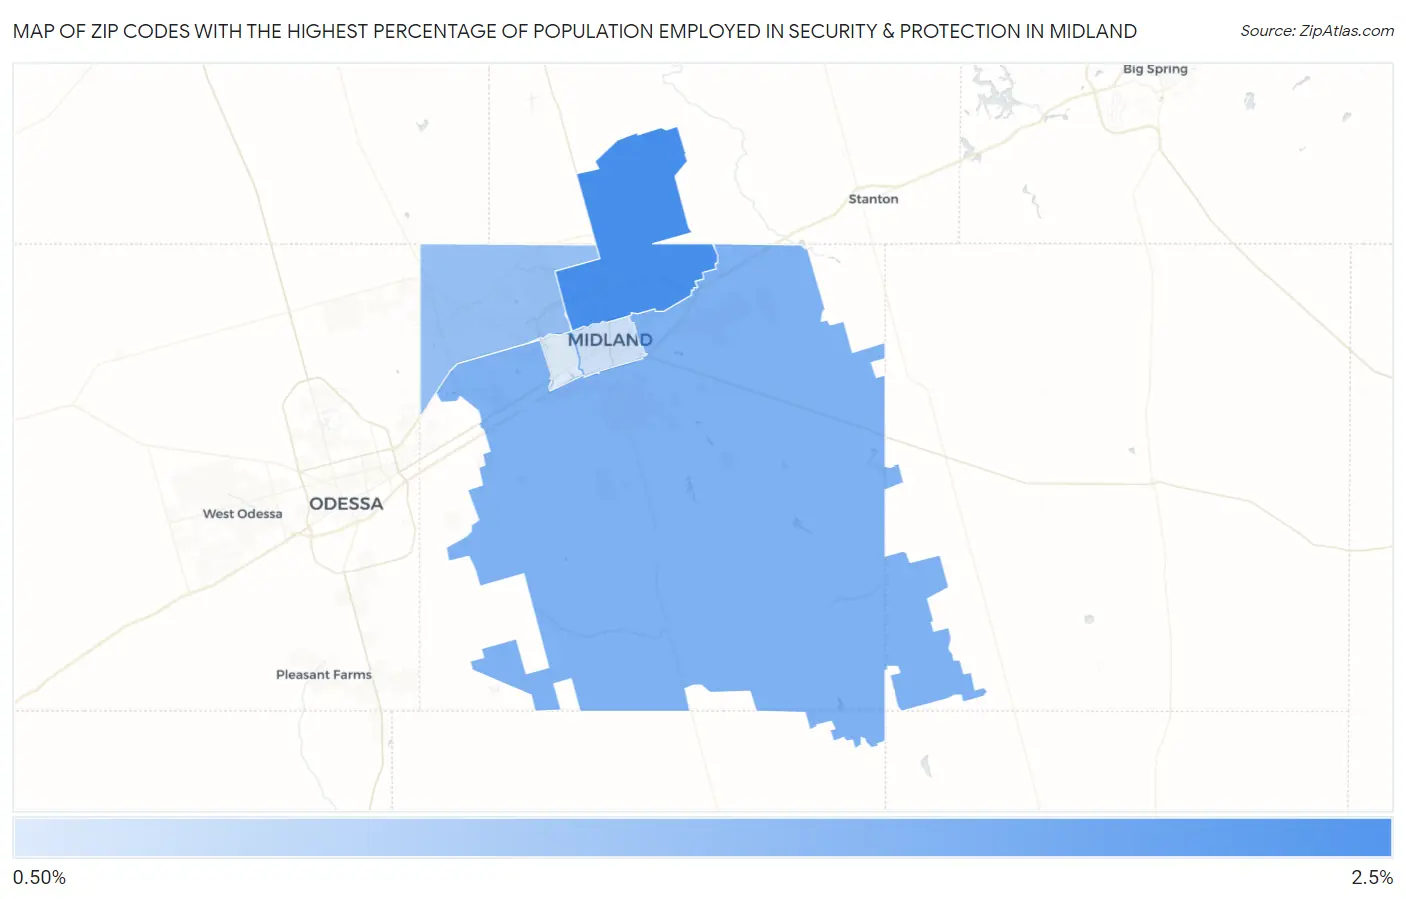
Map of Zip Codes with the Highest Percentage of Population Employed in Security & Protection in Midland
0.67%
2.2%
Zip Codes with the Highest Percentage of Population Employed in Security & Protection in Midland, TX
| Zip Code | % Employed | vs State | vs National | |
| 1. | 79705 | 2.2% | 2.2%(-0.012)#777 | 2.1%(+0.064)#11,186 |
| 2. | 79706 | 1.6% | 2.2%(-0.584)#1,022 | 2.1%(-0.509)#15,115 |
| 3. | 79707 | 1.4% | 2.2%(-0.814)#1,117 | 2.1%(-0.738)#16,869 |
| 4. | 79701 | 0.83% | 2.2%(-1.40)#1,370 | 2.1%(-1.32)#21,261 |
| 5. | 79703 | 0.67% | 2.2%(-1.55)#1,421 | 2.1%(-1.48)#22,257 |
1
Common Questions
What are the Top 3 Zip Codes with the Highest Percentage of Population Employed in Security & Protection in Midland, TX?
Top 3 Zip Codes with the Highest Percentage of Population Employed in Security & Protection in Midland, TX are:
What zip code has the Highest Percentage of Population Employed in Security & Protection in Midland, TX?
79705 has the Highest Percentage of Population Employed in Security & Protection in Midland, TX with 2.2%.
What is the Percentage of Population Employed in Security & Protection in Midland, TX?
Percentage of Population Employed in Security & Protection in Midland is 1.5%.
What is the Percentage of Population Employed in Security & Protection in Texas?
Percentage of Population Employed in Security & Protection in Texas is 2.2%.
What is the Percentage of Population Employed in Security & Protection in the United States?
Percentage of Population Employed in Security & Protection in the United States is 2.1%.