Zip Codes with the Highest Percentage of Population Employed in Security & Protection in Port Arthur, TX
RELATED REPORTS & OPTIONS
Security & Protection
Port Arthur
Compare Zip Codes
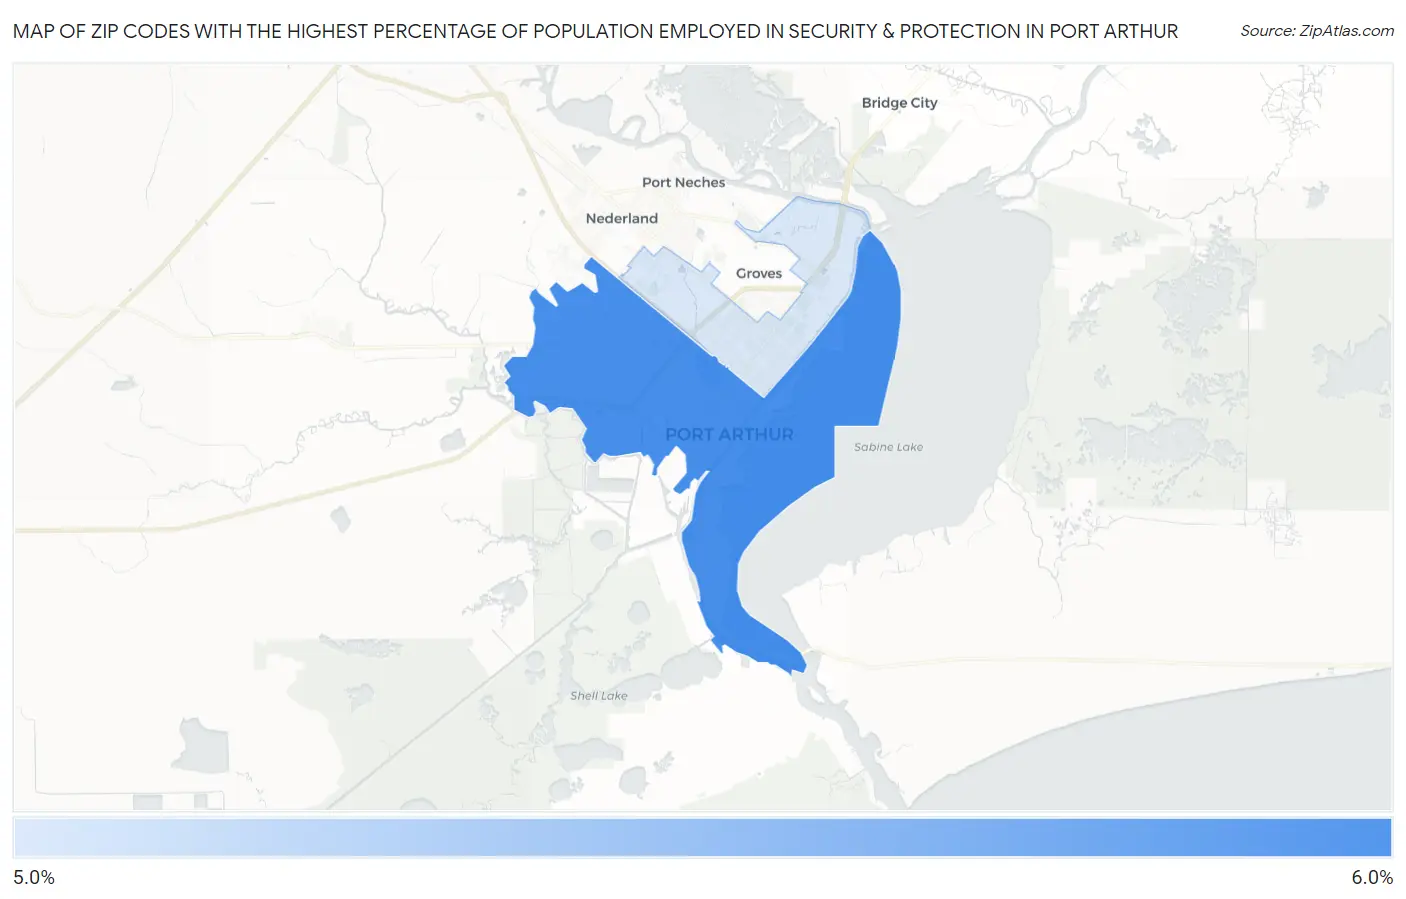
Map of Zip Codes with the Highest Percentage of Population Employed in Security & Protection in Port Arthur
5.0%
5.0%
Zip Codes with the Highest Percentage of Population Employed in Security & Protection in Port Arthur, TX
| Zip Code | % Employed | vs State | vs National | |
| 1. | 77640 | 5.0% | 2.2%(+2.80)#229 | 2.1%(+2.87)#2,899 |
| 2. | 77642 | 5.0% | 2.2%(+2.78)#231 | 2.1%(+2.86)#2,922 |
1
Common Questions
What are the Top Zip Codes with the Highest Percentage of Population Employed in Security & Protection in Port Arthur, TX?
Top Zip Codes with the Highest Percentage of Population Employed in Security & Protection in Port Arthur, TX are:
What zip code has the Highest Percentage of Population Employed in Security & Protection in Port Arthur, TX?
77640 has the Highest Percentage of Population Employed in Security & Protection in Port Arthur, TX with 5.0%.
What is the Percentage of Population Employed in Security & Protection in Port Arthur, TX?
Percentage of Population Employed in Security & Protection in Port Arthur is 5.0%.
What is the Percentage of Population Employed in Security & Protection in Texas?
Percentage of Population Employed in Security & Protection in Texas is 2.2%.
What is the Percentage of Population Employed in Security & Protection in the United States?
Percentage of Population Employed in Security & Protection in the United States is 2.1%.