Zip Codes with the Highest Percentage of Population Employed in Health Diagnosing & Treating in Henderson, NV
RELATED REPORTS & OPTIONS
Health Diagnosing & Treating
Henderson
Compare Zip Codes
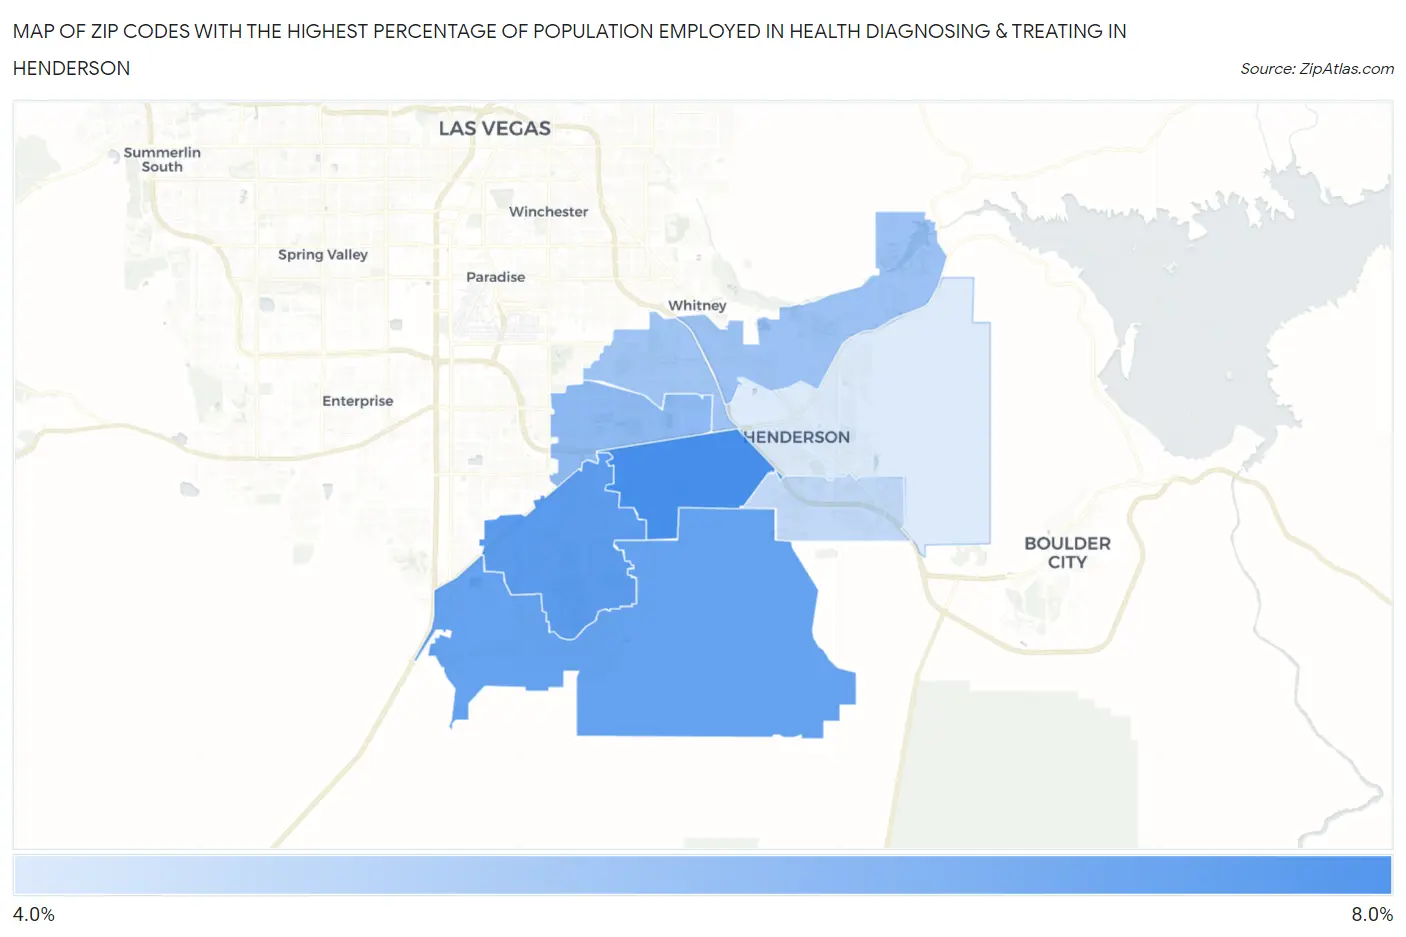
Map of Zip Codes with the Highest Percentage of Population Employed in Health Diagnosing & Treating in Henderson
4.3%
6.9%
Zip Codes with the Highest Percentage of Population Employed in Health Diagnosing & Treating in Henderson, NV
| Zip Code | % Employed | vs State | vs National | |
| 1. | 89012 | 6.9% | 4.9%(+1.96)#37 | 6.2%(+0.631)#10,759 |
| 2. | 89052 | 6.5% | 4.9%(+1.61)#40 | 6.2%(+0.278)#11,944 |
| 3. | 89044 | 6.3% | 4.9%(+1.44)#41 | 6.2%(+0.103)#12,582 |
| 4. | 89074 | 5.6% | 4.9%(+0.702)#46 | 6.2%(-0.631)#15,335 |
| 5. | 89011 | 5.4% | 4.9%(+0.494)#50 | 6.2%(-0.839)#16,139 |
| 6. | 89014 | 5.3% | 4.9%(+0.407)#51 | 6.2%(-0.926)#16,481 |
| 7. | 89002 | 4.8% | 4.9%(-0.146)#61 | 6.2%(-1.48)#18,613 |
| 8. | 89015 | 4.3% | 4.9%(-0.630)#74 | 6.2%(-1.96)#20,403 |
1
Common Questions
What are the Top 5 Zip Codes with the Highest Percentage of Population Employed in Health Diagnosing & Treating in Henderson, NV?
Top 5 Zip Codes with the Highest Percentage of Population Employed in Health Diagnosing & Treating in Henderson, NV are:
What zip code has the Highest Percentage of Population Employed in Health Diagnosing & Treating in Henderson, NV?
89012 has the Highest Percentage of Population Employed in Health Diagnosing & Treating in Henderson, NV with 6.9%.
What is the Percentage of Population Employed in Health Diagnosing & Treating in Henderson, NV?
Percentage of Population Employed in Health Diagnosing & Treating in Henderson is 5.9%.
What is the Percentage of Population Employed in Health Diagnosing & Treating in Nevada?
Percentage of Population Employed in Health Diagnosing & Treating in Nevada is 4.9%.
What is the Percentage of Population Employed in Health Diagnosing & Treating in the United States?
Percentage of Population Employed in Health Diagnosing & Treating in the United States is 6.2%.