Beatty, NV Map & Demographics
Beatty Map
Beatty Overview
$24,844
PER CAPITA INCOME
$49,007
AVG FAMILY INCOME
33.4%
WAGE / INCOME GAP [ % ]
66.6¢/ $1
WAGE / INCOME GAP [ $ ]
0.34
INEQUALITY / GINI INDEX
596
TOTAL POPULATION
276
MALE POPULATION
320
FEMALE POPULATION
86.25
MALES / 100 FEMALES
115.94
FEMALES / 100 MALES
61.0
MEDIAN AGE
2.1
AVG FAMILY SIZE
1.6
AVG HOUSEHOLD SIZE
262
LABOR FORCE [ PEOPLE ]
44.0%
PERCENT IN LABOR FORCE
Beatty Zip Codes
Beatty Area Codes
Income in Beatty
Income Overview in Beatty
| Characteristic | Number | Measure |
| Per Capita Income | 596 | $24,844 |
| Median Family Income | 181 | $49,007 |
| Mean Family Income | 181 | $51,706 |
| Median Household Income | 378 | $0 |
| Mean Household Income | 378 | $37,916 |
| Income Deficit | 181 | $0 |
| Wage / Income Gap (%) | 596 | 33.36% |
| Wage / Income Gap ($) | 596 | 66.64¢ per $1 |
| Gini / Inequality Index | 596 | 0.34 |
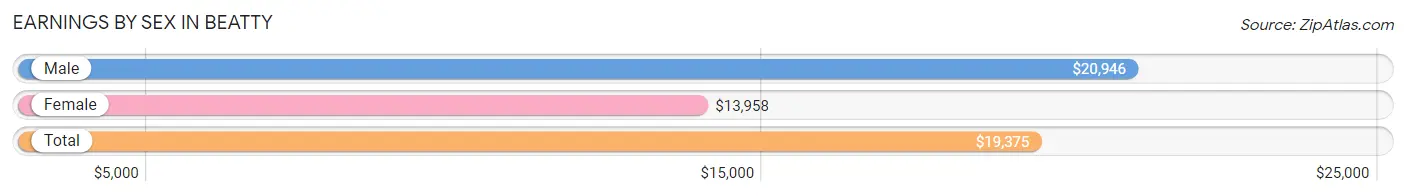
Earnings by Sex in Beatty
Average Earnings in Beatty are $19,375, $20,946 for men and $13,958 for women, a difference of 33.4%.
| Sex | Number | Average Earnings |
| Male | 129 (49.2%) | $20,946 |
| Female | 133 (50.8%) | $13,958 |
| Total | 262 (100.0%) | $19,375 |
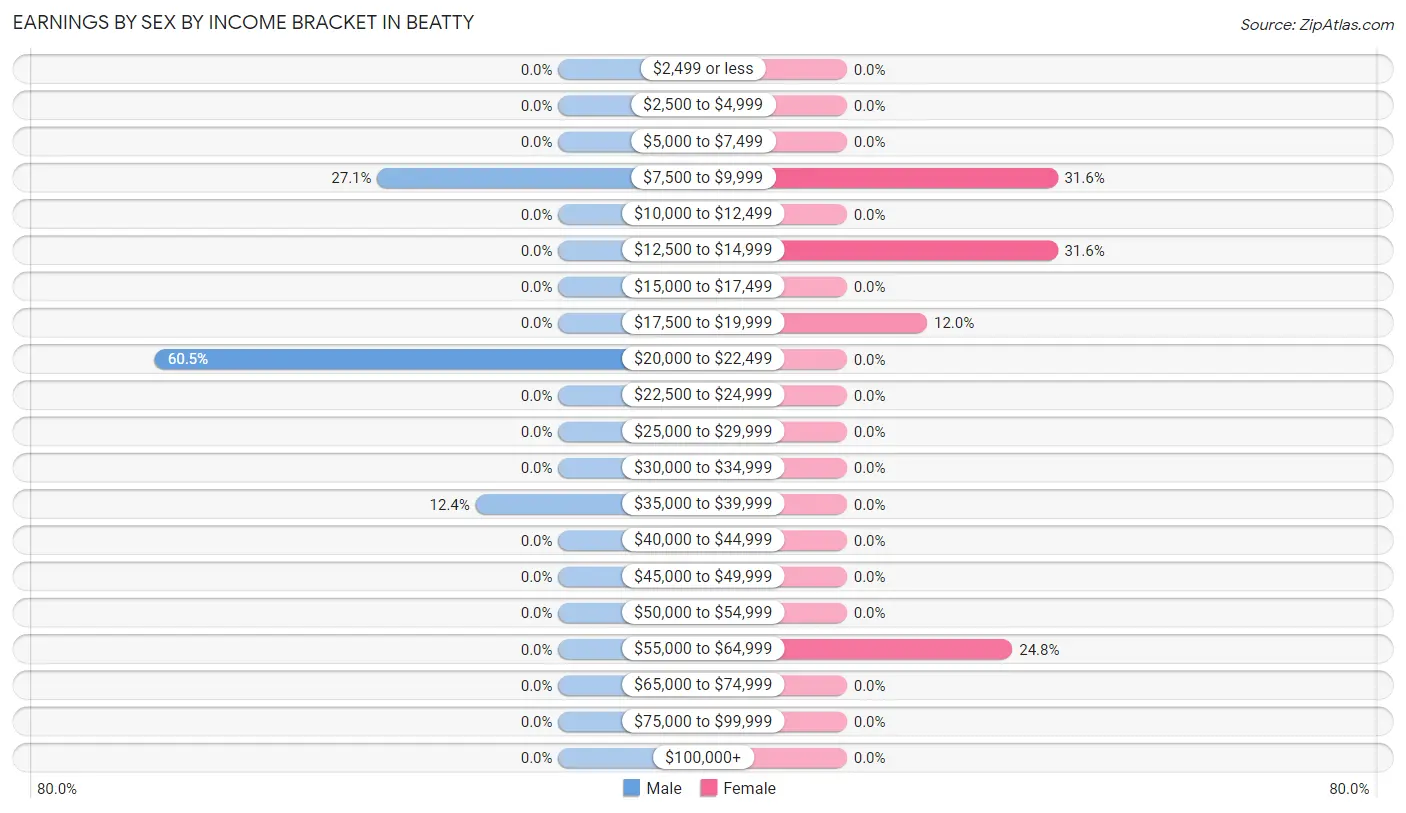
Earnings by Sex by Income Bracket in Beatty
The most common earnings brackets in Beatty are $20,000 to $22,499 for men (78 | 60.5%) and $7,500 to $9,999 for women (42 | 31.6%).
| Income | Male | Female |
| $2,499 or less | 0 (0.0%) | 0 (0.0%) |
| $2,500 to $4,999 | 0 (0.0%) | 0 (0.0%) |
| $5,000 to $7,499 | 0 (0.0%) | 0 (0.0%) |
| $7,500 to $9,999 | 35 (27.1%) | 42 (31.6%) |
| $10,000 to $12,499 | 0 (0.0%) | 0 (0.0%) |
| $12,500 to $14,999 | 0 (0.0%) | 42 (31.6%) |
| $15,000 to $17,499 | 0 (0.0%) | 0 (0.0%) |
| $17,500 to $19,999 | 0 (0.0%) | 16 (12.0%) |
| $20,000 to $22,499 | 78 (60.5%) | 0 (0.0%) |
| $22,500 to $24,999 | 0 (0.0%) | 0 (0.0%) |
| $25,000 to $29,999 | 0 (0.0%) | 0 (0.0%) |
| $30,000 to $34,999 | 0 (0.0%) | 0 (0.0%) |
| $35,000 to $39,999 | 16 (12.4%) | 0 (0.0%) |
| $40,000 to $44,999 | 0 (0.0%) | 0 (0.0%) |
| $45,000 to $49,999 | 0 (0.0%) | 0 (0.0%) |
| $50,000 to $54,999 | 0 (0.0%) | 0 (0.0%) |
| $55,000 to $64,999 | 0 (0.0%) | 33 (24.8%) |
| $65,000 to $74,999 | 0 (0.0%) | 0 (0.0%) |
| $75,000 to $99,999 | 0 (0.0%) | 0 (0.0%) |
| $100,000+ | 0 (0.0%) | 0 (0.0%) |
| Total | 129 (100.0%) | 133 (100.0%) |
Earnings by Sex by Educational Attainment in Beatty
| Educational Attainment | Male Income | Female Income |
| Less than High School | - | - |
| High School Diploma | - | - |
| College or Associate's Degree | - | - |
| Bachelor's Degree | - | - |
| Graduate Degree | - | - |
| Total | $20,946 | $0 |
Family Income in Beatty
Family Income Brackets in Beatty
According to the Beatty family income data, there are 69 families falling into the $35,000 to $49,999 income range, which is the most common income bracket and makes up 38.1% of all families.
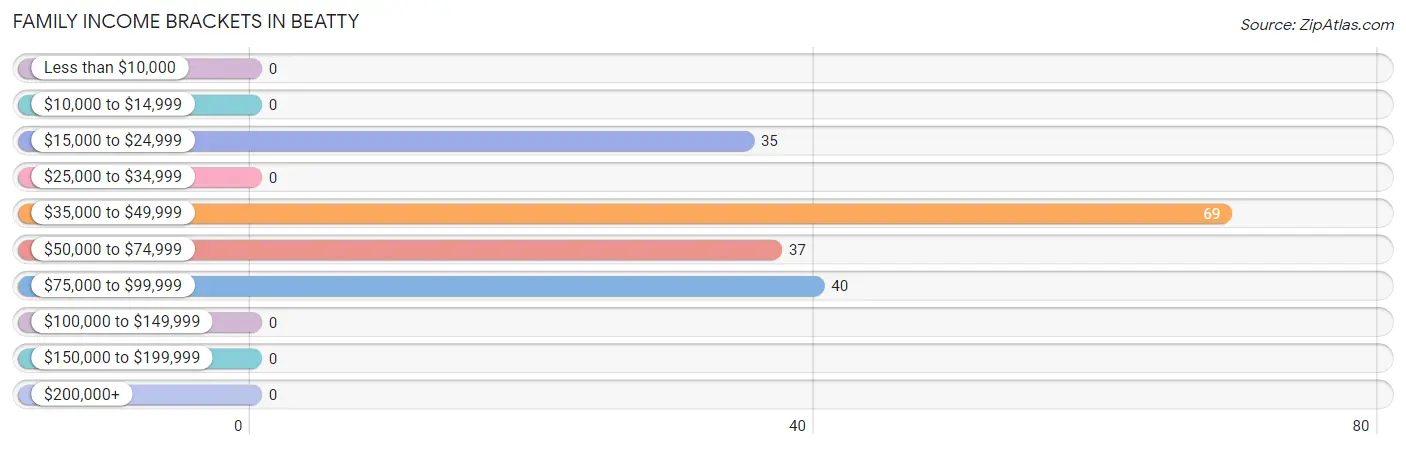
| Income Bracket | # Families | % Families |
| Less than $10,000 | 0 | 0.0% |
| $10,000 to $14,999 | 0 | 0.0% |
| $15,000 to $24,999 | 35 | 19.3% |
| $25,000 to $34,999 | 0 | 0.0% |
| $35,000 to $49,999 | 69 | 38.1% |
| $50,000 to $74,999 | 37 | 20.4% |
| $75,000 to $99,999 | 40 | 22.1% |
| $100,000 to $149,999 | 0 | 0.0% |
| $150,000 to $199,999 | 0 | 0.0% |
| $200,000+ | 0 | 0.0% |
Family Income by Famaliy Size in Beatty
2-person families (181 | 100.0%) account for the highest median family income in Beatty with $49,007 per family, while 2-person families (181 | 100.0%) have the highest median income of $24,504 per family member.
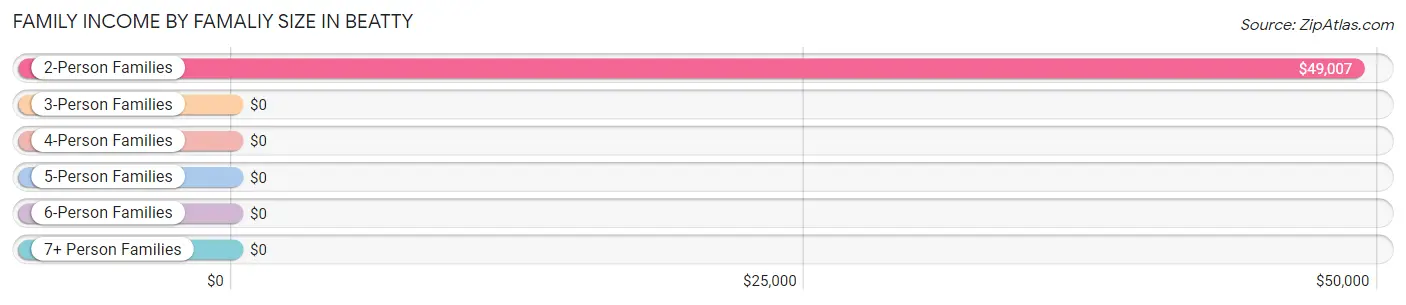
| Income Bracket | # Families | Median Income |
| 2-Person Families | 181 (100.0%) | $49,007 |
| 3-Person Families | 0 (0.0%) | $0 |
| 4-Person Families | 0 (0.0%) | $0 |
| 5-Person Families | 0 (0.0%) | $0 |
| 6-Person Families | 0 (0.0%) | $0 |
| 7+ Person Families | 0 (0.0%) | $0 |
| Total | 181 (100.0%) | $49,007 |
Family Income by Number of Earners in Beatty
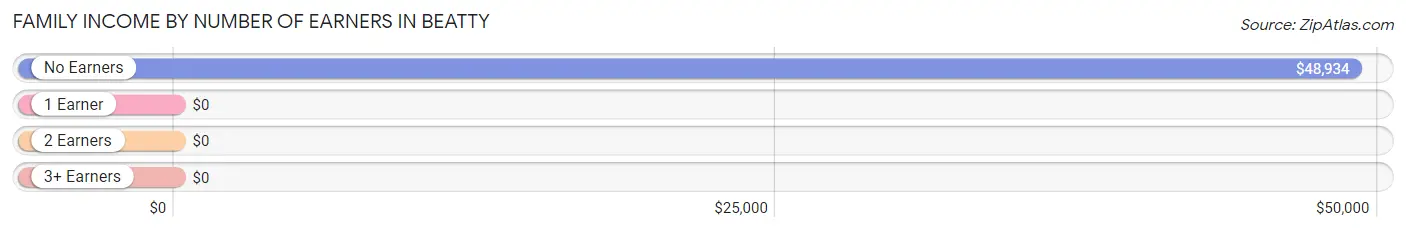
| Number of Earners | # Families | Median Income |
| No Earners | 109 (60.2%) | $48,934 |
| 1 Earner | 37 (20.4%) | $0 |
| 2 Earners | 35 (19.3%) | $0 |
| 3+ Earners | 0 (0.0%) | $0 |
| Total | 181 (100.0%) | $49,007 |
Household Income in Beatty
Household Income Brackets in Beatty
With 131 households falling in the category, the $15,000 to $24,999 income range is the most frequent in Beatty, accounting for 34.7% of all households.
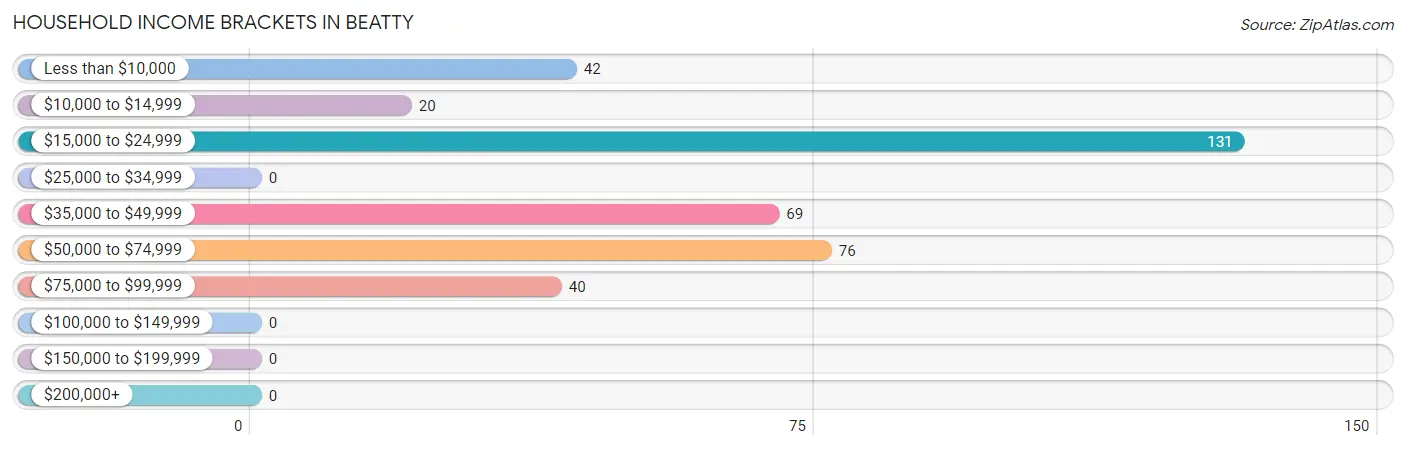
| Income Bracket | # Households | % Households |
| Less than $10,000 | 42 | 11.1% |
| $10,000 to $14,999 | 20 | 5.3% |
| $15,000 to $24,999 | 131 | 34.7% |
| $25,000 to $34,999 | 0 | 0.0% |
| $35,000 to $49,999 | 69 | 18.3% |
| $50,000 to $74,999 | 76 | 20.1% |
| $75,000 to $99,999 | 40 | 10.6% |
| $100,000 to $149,999 | 0 | 0.0% |
| $150,000 to $199,999 | 0 | 0.0% |
| $200,000+ | 0 | 0.0% |
Household Income by Householder Age in Beatty
The median household income in Beatty is $0, with the highest median household income of $48,382 found in the 65+ years age bracket for the primary householder. A total of 170 households (45.0%) fall into this category. Meanwhile, the 15 to 24 years age bracket for the primary householder has the lowest median household income of $0, with 42 households (11.1%) in this group.
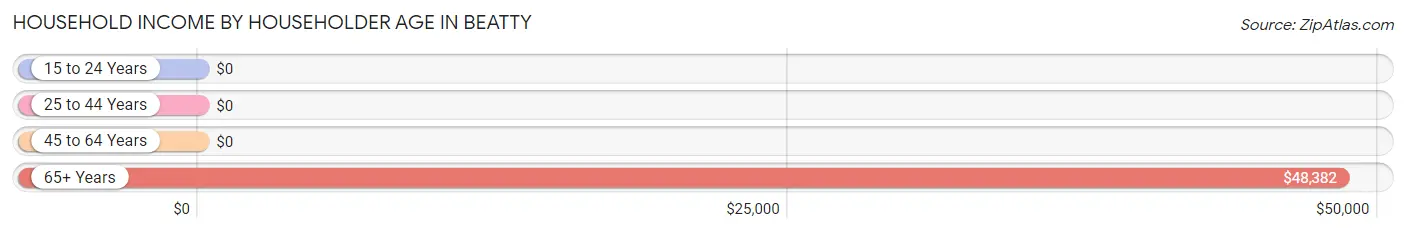
| Income Bracket | # Households | Median Income |
| 15 to 24 Years | 42 (11.1%) | $0 |
| 25 to 44 Years | 0 (0.0%) | $0 |
| 45 to 64 Years | 166 (43.9%) | $0 |
| 65+ Years | 170 (45.0%) | $48,382 |
| Total | 378 (100.0%) | $0 |
Poverty in Beatty
Income Below Poverty by Sex and Age in Beatty
With 7.2% poverty level for males and 13.1% for females among the residents of Beatty, 75 year old and over males and 18 to 24 year old females are the most vulnerable to poverty, with 20 males (100.0%) and 42 females (100.0%) in their respective age groups living below the poverty level.
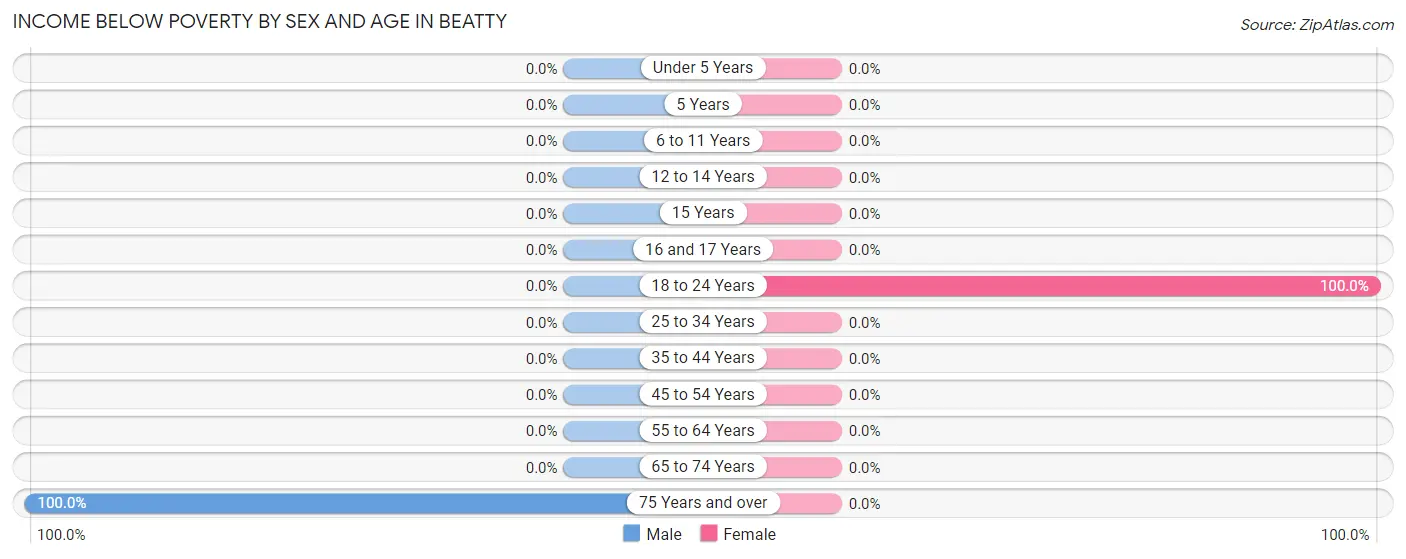
| Age Bracket | Male | Female |
| Under 5 Years | 0 (0.0%) | 0 (0.0%) |
| 5 Years | 0 (0.0%) | 0 (0.0%) |
| 6 to 11 Years | 0 (0.0%) | 0 (0.0%) |
| 12 to 14 Years | 0 (0.0%) | 0 (0.0%) |
| 15 Years | 0 (0.0%) | 0 (0.0%) |
| 16 and 17 Years | 0 (0.0%) | 0 (0.0%) |
| 18 to 24 Years | 0 (0.0%) | 42 (100.0%) |
| 25 to 34 Years | 0 (0.0%) | 0 (0.0%) |
| 35 to 44 Years | 0 (0.0%) | 0 (0.0%) |
| 45 to 54 Years | 0 (0.0%) | 0 (0.0%) |
| 55 to 64 Years | 0 (0.0%) | 0 (0.0%) |
| 65 to 74 Years | 0 (0.0%) | 0 (0.0%) |
| 75 Years and over | 20 (100.0%) | 0 (0.0%) |
| Total | 20 (7.2%) | 42 (13.1%) |
Income Above Poverty by Sex and Age in Beatty
According to the poverty statistics in Beatty, males aged 45 to 54 years and females aged 35 to 44 years are the age groups that are most secure financially, with 100.0% of males and 100.0% of females in these age groups living above the poverty line.
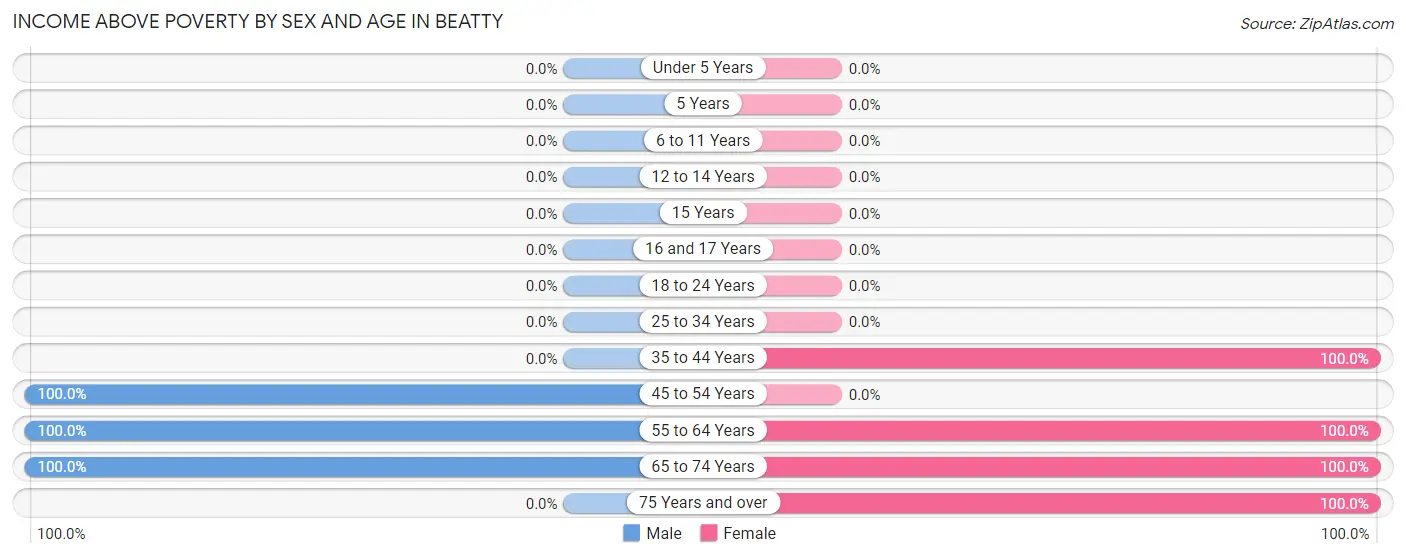
| Age Bracket | Male | Female |
| Under 5 Years | 0 (0.0%) | 0 (0.0%) |
| 5 Years | 0 (0.0%) | 0 (0.0%) |
| 6 to 11 Years | 0 (0.0%) | 0 (0.0%) |
| 12 to 14 Years | 0 (0.0%) | 0 (0.0%) |
| 15 Years | 0 (0.0%) | 0 (0.0%) |
| 16 and 17 Years | 0 (0.0%) | 0 (0.0%) |
| 18 to 24 Years | 0 (0.0%) | 0 (0.0%) |
| 25 to 34 Years | 0 (0.0%) | 0 (0.0%) |
| 35 to 44 Years | 0 (0.0%) | 49 (100.0%) |
| 45 to 54 Years | 51 (100.0%) | 0 (0.0%) |
| 55 to 64 Years | 78 (100.0%) | 79 (100.0%) |
| 65 to 74 Years | 127 (100.0%) | 109 (100.0%) |
| 75 Years and over | 0 (0.0%) | 41 (100.0%) |
| Total | 256 (92.7%) | 278 (86.9%) |
Income Below Poverty Among Married-Couple Families in Beatty
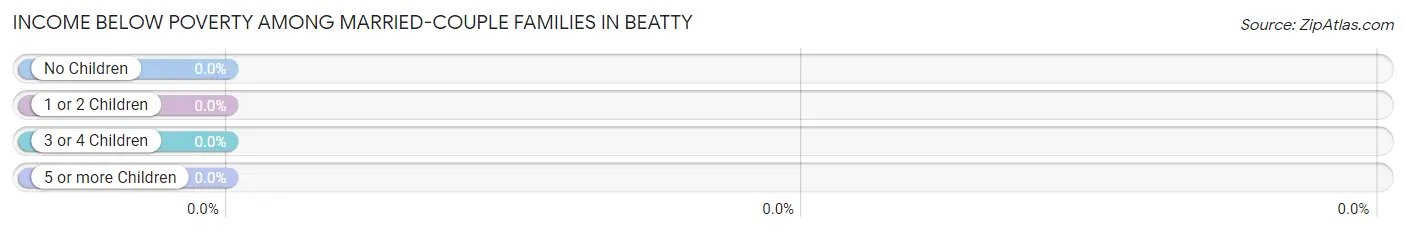
| Children | Above Poverty | Below Poverty |
| No Children | 109 (100.0%) | 0 (0.0%) |
| 1 or 2 Children | 0 (0.0%) | 0 (0.0%) |
| 3 or 4 Children | 0 (0.0%) | 0 (0.0%) |
| 5 or more Children | 0 (0.0%) | 0 (0.0%) |
| Total | 109 (100.0%) | 0 (0.0%) |
Income Below Poverty Among Single-Parent Households in Beatty
| Children | Single Father | Single Mother |
| No Children | 0 (0.0%) | 0 (0.0%) |
| 1 or 2 Children | 0 (0.0%) | 0 (0.0%) |
| 3 or 4 Children | 0 (0.0%) | 0 (0.0%) |
| 5 or more Children | 0 (0.0%) | 0 (0.0%) |
| Total | 0 (0.0%) | 0 (0.0%) |
Income Below Poverty Among Married-Couple vs Single-Parent Households in Beatty
| Children | Married-Couple Families | Single-Parent Households |
| No Children | 0 (0.0%) | 0 (0.0%) |
| 1 or 2 Children | 0 (0.0%) | 0 (0.0%) |
| 3 or 4 Children | 0 (0.0%) | 0 (0.0%) |
| 5 or more Children | 0 (0.0%) | 0 (0.0%) |
| Total | 0 (0.0%) | 0 (0.0%) |
Race in Beatty
The most populous races in Beatty are White / Caucasian (478 | 80.2%), Hispanic or Latino (120 | 20.1%), and Two or more Races (78 | 13.1%).
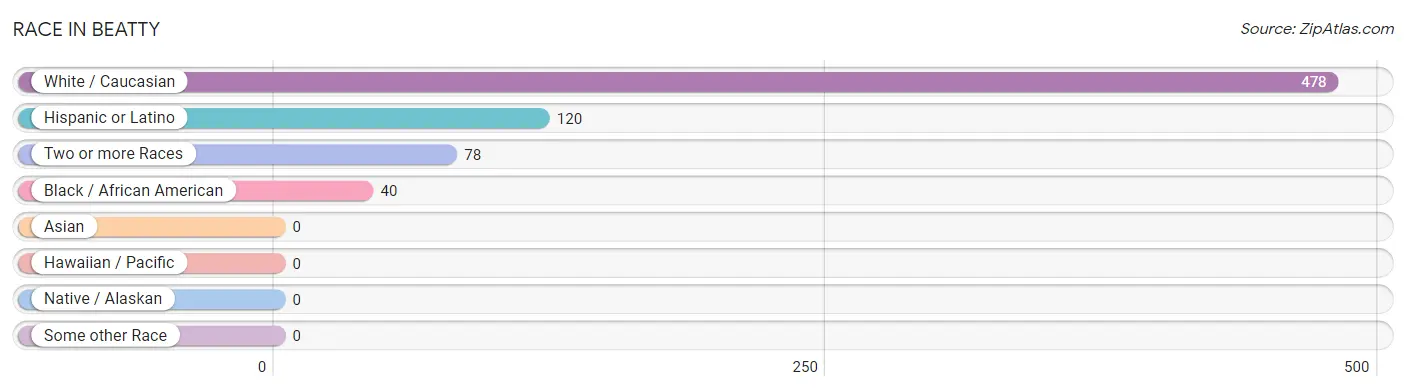
| Race | # Population | % Population |
| Asian | 0 | 0.0% |
| Black / African American | 40 | 6.7% |
| Hawaiian / Pacific | 0 | 0.0% |
| Hispanic or Latino | 120 | 20.1% |
| Native / Alaskan | 0 | 0.0% |
| White / Caucasian | 478 | 80.2% |
| Two or more Races | 78 | 13.1% |
| Some other Race | 0 | 0.0% |
| Total | 596 | 100.0% |
Ancestry in Beatty
The most populous ancestries reported in Beatty are Irish (196 | 32.9%), English (118 | 19.8%), Central American (78 | 13.1%), Guatemalan (78 | 13.1%), and German (69 | 11.6%), together accounting for 90.5% of all Beatty residents.
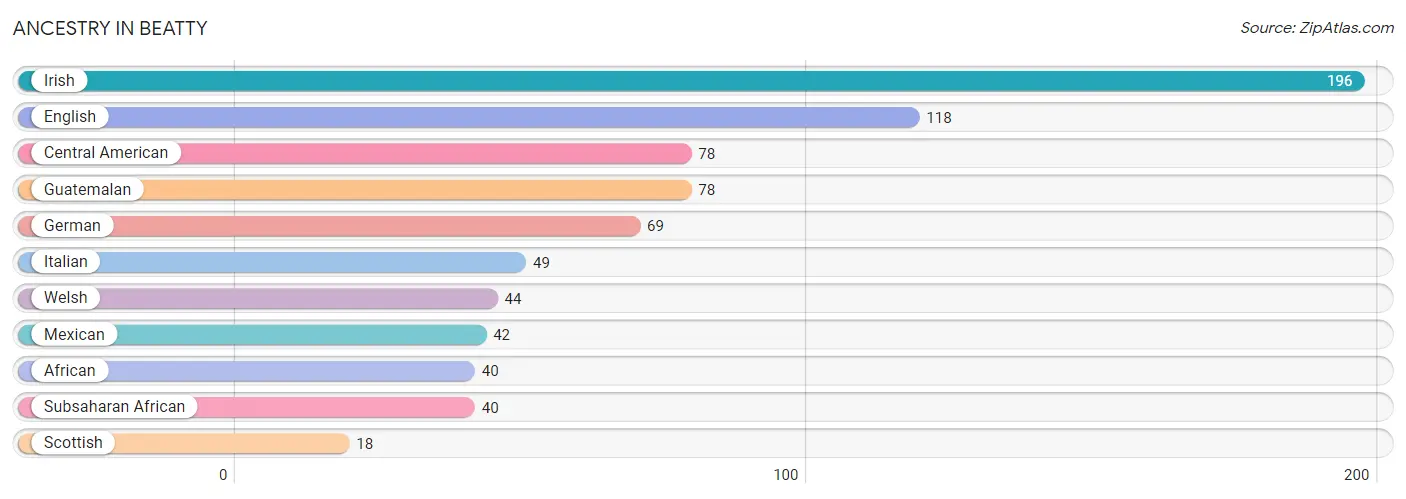
| Ancestry | # Population | % Population |
| African | 40 | 6.7% |
| Central American | 78 | 13.1% |
| English | 118 | 19.8% |
| German | 69 | 11.6% |
| Guatemalan | 78 | 13.1% |
| Irish | 196 | 32.9% |
| Italian | 49 | 8.2% |
| Mexican | 42 | 7.0% |
| Scottish | 18 | 3.0% |
| Subsaharan African | 40 | 6.7% |
| Welsh | 44 | 7.4% | View All 11 Rows |
Immigrants in Beatty
The most numerous immigrant groups reported in Beatty came from Latin America (113 | 19.0%), Central America (78 | 13.1%), Guatemala (78 | 13.1%), South America (35 | 5.9%), and Uruguay (35 | 5.9%), together accounting for 56.9% of all Beatty residents.
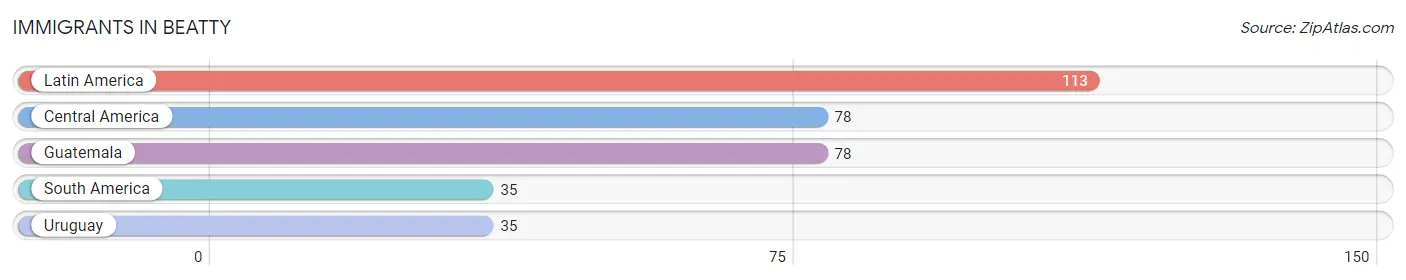
| Immigration Origin | # Population | % Population |
| Central America | 78 | 13.1% |
| Guatemala | 78 | 13.1% |
| Latin America | 113 | 19.0% |
| South America | 35 | 5.9% |
| Uruguay | 35 | 5.9% | View All 5 Rows |
Sex and Age in Beatty
Sex and Age in Beatty
The most populous age groups in Beatty are 65 to 69 Years (83 | 30.1%) for men and 70 to 74 Years (109 | 34.1%) for women.
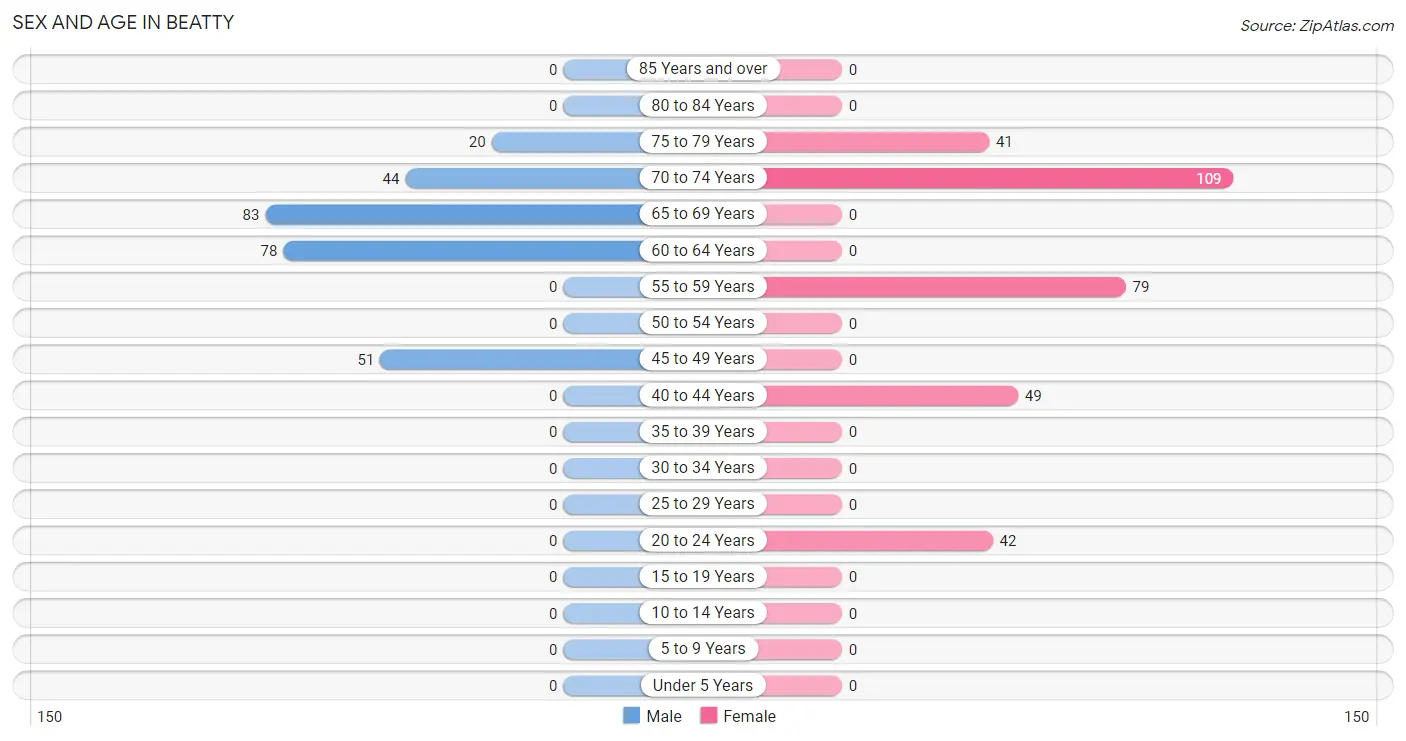
| Age Bracket | Male | Female |
| Under 5 Years | 0 (0.0%) | 0 (0.0%) |
| 5 to 9 Years | 0 (0.0%) | 0 (0.0%) |
| 10 to 14 Years | 0 (0.0%) | 0 (0.0%) |
| 15 to 19 Years | 0 (0.0%) | 0 (0.0%) |
| 20 to 24 Years | 0 (0.0%) | 42 (13.1%) |
| 25 to 29 Years | 0 (0.0%) | 0 (0.0%) |
| 30 to 34 Years | 0 (0.0%) | 0 (0.0%) |
| 35 to 39 Years | 0 (0.0%) | 0 (0.0%) |
| 40 to 44 Years | 0 (0.0%) | 49 (15.3%) |
| 45 to 49 Years | 51 (18.5%) | 0 (0.0%) |
| 50 to 54 Years | 0 (0.0%) | 0 (0.0%) |
| 55 to 59 Years | 0 (0.0%) | 79 (24.7%) |
| 60 to 64 Years | 78 (28.3%) | 0 (0.0%) |
| 65 to 69 Years | 83 (30.1%) | 0 (0.0%) |
| 70 to 74 Years | 44 (15.9%) | 109 (34.1%) |
| 75 to 79 Years | 20 (7.2%) | 41 (12.8%) |
| 80 to 84 Years | 0 (0.0%) | 0 (0.0%) |
| 85 Years and over | 0 (0.0%) | 0 (0.0%) |
| Total | 276 (100.0%) | 320 (100.0%) |
Families and Households in Beatty
Median Family Size in Beatty
The median family size in Beatty is 2.12 persons per family, with single male/father families (35 | 19.3%) accounting for the largest median family size of 2.2 persons per family. On the other hand, single female/mother families (37 | 20.4%) represent the smallest median family size with 1.89 persons per family.
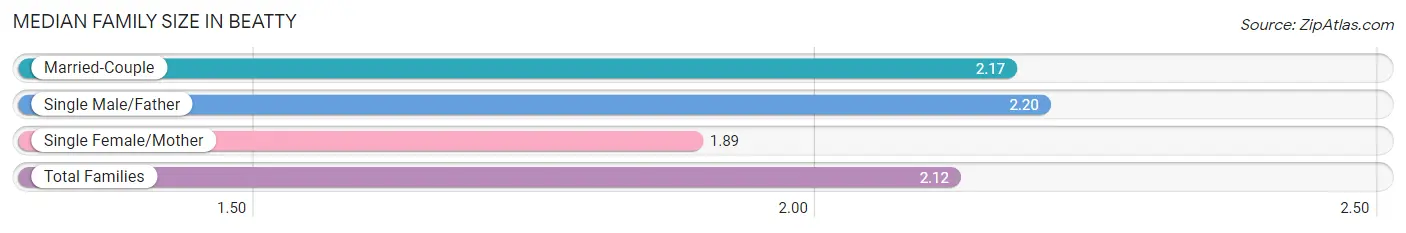
| Family Type | # Families | Family Size |
| Married-Couple | 109 (60.2%) | 2.17 |
| Single Male/Father | 35 (19.3%) | 2.20 |
| Single Female/Mother | 37 (20.4%) | 1.89 |
| Total Families | 181 (100.0%) | 2.12 |
Median Household Size in Beatty
The median household size in Beatty is 1.58 persons per household, with single male/father households (35 | 9.3%) accounting for the largest median household size of 2.2 persons per household. non-family households (197 | 52.1%) represent the smallest median household size with 1.08 persons per household.
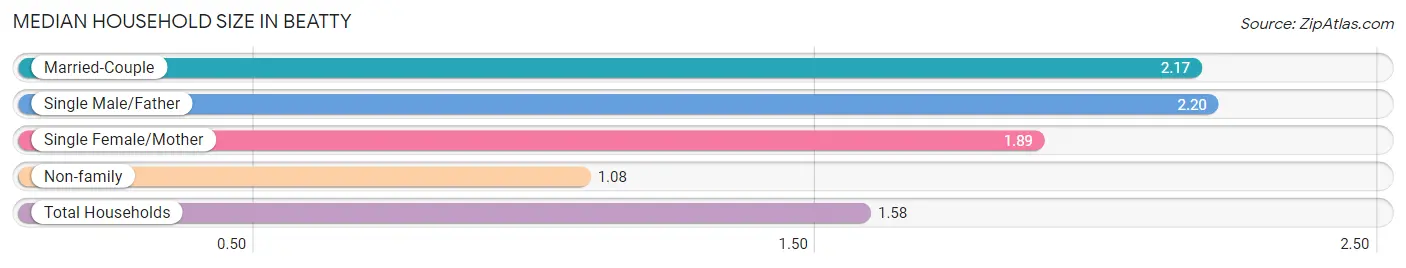
| Household Type | # Households | Household Size |
| Married-Couple | 109 (28.8%) | 2.17 |
| Single Male/Father | 35 (9.3%) | 2.20 |
| Single Female/Mother | 37 (9.8%) | 1.89 |
| Non-family | 197 (52.1%) | 1.08 |
| Total Households | 378 (100.0%) | 1.58 |
Household Size by Marriage Status in Beatty
Out of a total of 378 households in Beatty, 181 (47.9%) are family households, while 197 (52.1%) are nonfamily households. The most numerous type of family households are 2-person households, comprising 181, and the most common type of nonfamily households are 1-person households, comprising 181.
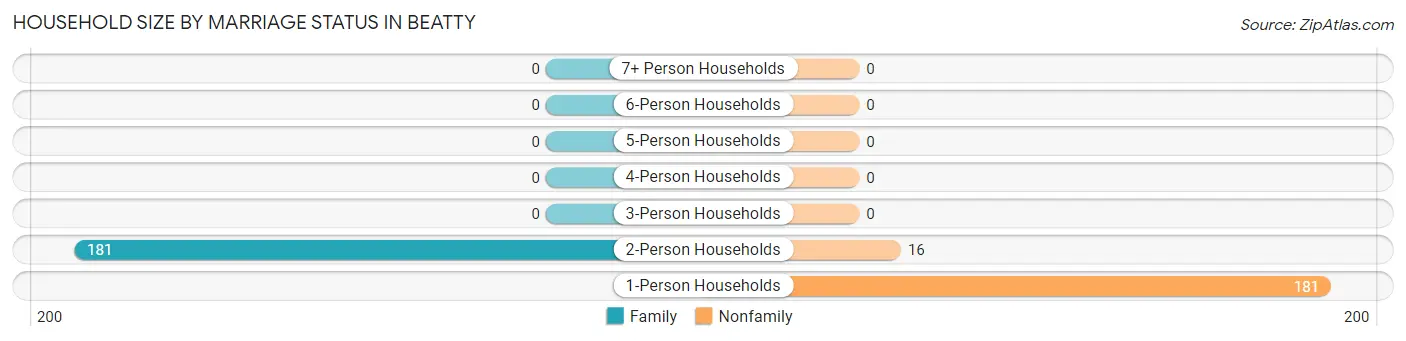
| Household Size | Family Households | Nonfamily Households |
| 1-Person Households | - | 181 (47.9%) |
| 2-Person Households | 181 (47.9%) | 16 (4.2%) |
| 3-Person Households | 0 (0.0%) | 0 (0.0%) |
| 4-Person Households | 0 (0.0%) | 0 (0.0%) |
| 5-Person Households | 0 (0.0%) | 0 (0.0%) |
| 6-Person Households | 0 (0.0%) | 0 (0.0%) |
| 7+ Person Households | 0 (0.0%) | 0 (0.0%) |
| Total | 181 (47.9%) | 197 (52.1%) |
Female Fertility in Beatty
Fertility by Age in Beatty
| Age Bracket | Women with Births | Births / 1,000 Women |
| 15 to 19 years | 0 (0.0%) | 0.0 |
| 20 to 34 years | 0 (0.0%) | 0.0 |
| 35 to 50 years | 0 (0.0%) | 0.0 |
| Total | 0 (0.0%) | 0.0 |
Fertility by Age by Marriage Status in Beatty
| Age Bracket | Married | Unmarried |
| 15 to 19 years | 0 (0.0%) | 0 (0.0%) |
| 20 to 34 years | 0 (0.0%) | 0 (0.0%) |
| 35 to 50 years | 0 (0.0%) | 0 (0.0%) |
| Total | 0 (0.0%) | 0 (0.0%) |
Fertility by Education in Beatty
| Educational Attainment | Women with Births | Births / 1,000 Women |
| Less than High School | 0 (0.0%) | 0.0 |
| High School Diploma | 0 (0.0%) | 0.0 |
| College or Associate's Degree | 0 (0.0%) | 0.0 |
| Bachelor's Degree | 0 (0.0%) | 0.0 |
| Graduate Degree | 0 (0.0%) | 0.0 |
| Total | 0 (0.0%) | 0.0 |
Fertility by Education by Marriage Status in Beatty
| Educational Attainment | Married | Unmarried |
| Less than High School | 0 (0.0%) | 0 (0.0%) |
| High School Diploma | 0 (0.0%) | 0 (0.0%) |
| College or Associate's Degree | 0 (0.0%) | 0 (0.0%) |
| Bachelor's Degree | 0 (0.0%) | 0 (0.0%) |
| Graduate Degree | 0 (0.0%) | 0 (0.0%) |
| Total | 0 (0.0%) | 0 (0.0%) |
Employment Characteristics in Beatty
Employment by Class of Employer in Beatty
Among the 262 employed individuals in Beatty, , and private company employees (262 | 100.0%) make up the most common classes of employment.
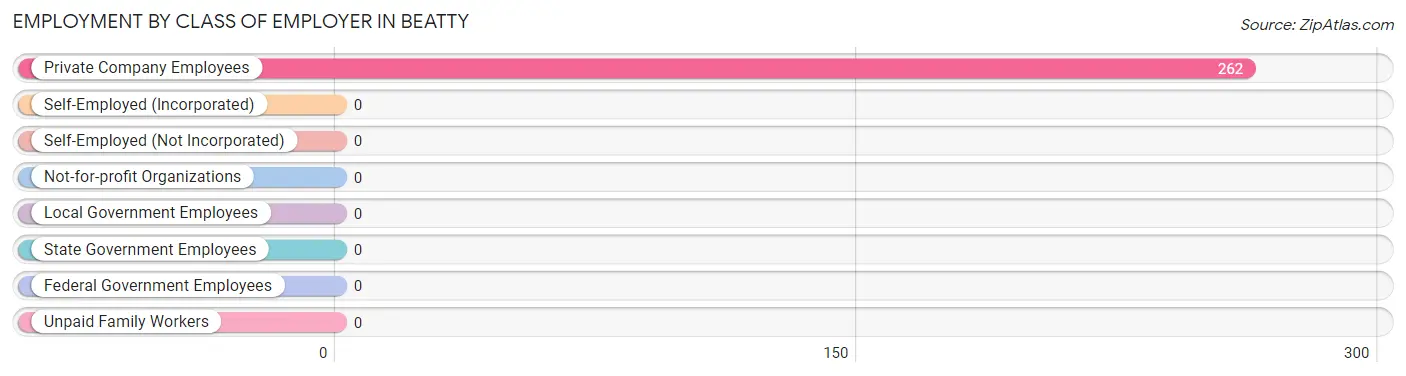
| Employer Class | # Employees | % Employees |
| Private Company Employees | 262 | 100.0% |
| Self-Employed (Incorporated) | 0 | 0.0% |
| Self-Employed (Not Incorporated) | 0 | 0.0% |
| Not-for-profit Organizations | 0 | 0.0% |
| Local Government Employees | 0 | 0.0% |
| State Government Employees | 0 | 0.0% |
| Federal Government Employees | 0 | 0.0% |
| Unpaid Family Workers | 0 | 0.0% |
| Total | 262 | 100.0% |
Employment Status by Age in Beatty
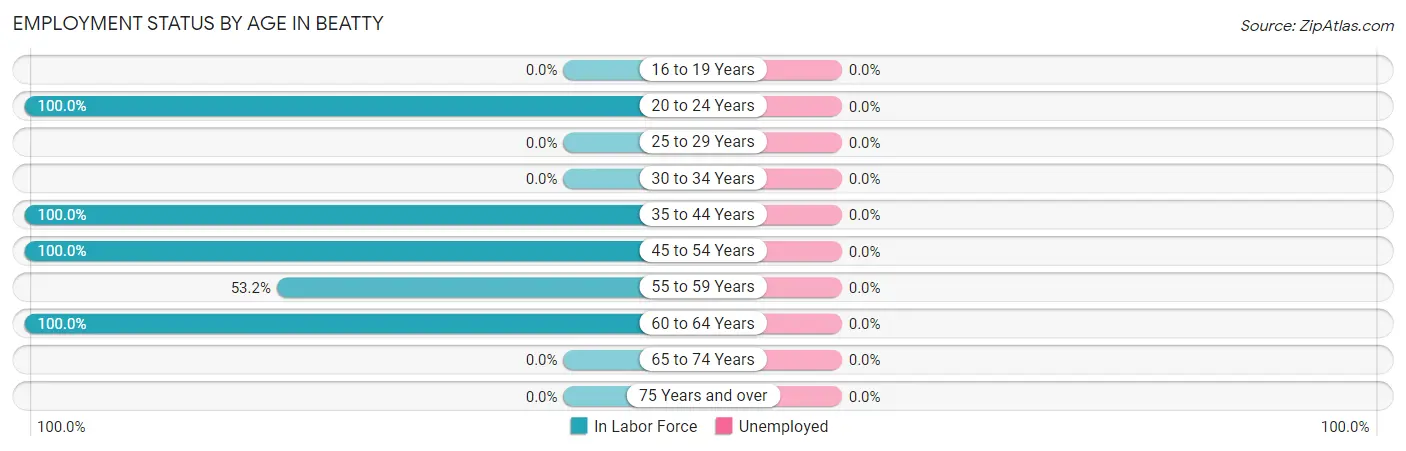
| Age Bracket | In Labor Force | Unemployed |
| 16 to 19 Years | 0 (0.0%) | 0 (0.0%) |
| 20 to 24 Years | 42 (100.0%) | 0 (0.0%) |
| 25 to 29 Years | 0 (0.0%) | 0 (0.0%) |
| 30 to 34 Years | 0 (0.0%) | 0 (0.0%) |
| 35 to 44 Years | 49 (100.0%) | 0 (0.0%) |
| 45 to 54 Years | 51 (100.0%) | 0 (0.0%) |
| 55 to 59 Years | 42 (53.2%) | 0 (0.0%) |
| 60 to 64 Years | 78 (100.0%) | 0 (0.0%) |
| 65 to 74 Years | 0 (0.0%) | 0 (0.0%) |
| 75 Years and over | 0 (0.0%) | 0 (0.0%) |
| Total | 262 (44.0%) | 0 (0.0%) |
Employment Status by Educational Attainment in Beatty
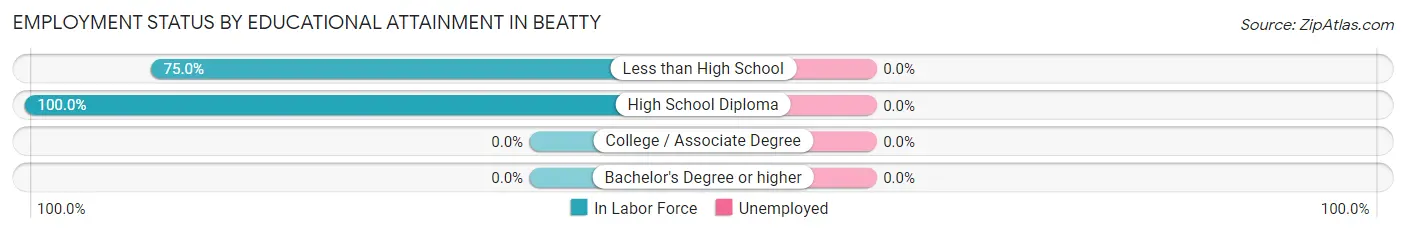
| Educational Attainment | In Labor Force | Unemployed |
| Less than High School | 111 (75.0%) | 0 (0.0%) |
| High School Diploma | 109 (100.0%) | 0 (0.0%) |
| College / Associate Degree | 0 (0.0%) | 0 (0.0%) |
| Bachelor's Degree or higher | 0 (0.0%) | 0 (0.0%) |
| Total | 220 (85.6%) | 0 (0.0%) |
Employment Occupations by Sex in Beatty
Management, Business, Science and Arts Occupations
The most common Management, Business, Science and Arts occupations in Beatty are Health Diagnosing & Treating (42 | 16.0%), and Management (16 | 6.1%).
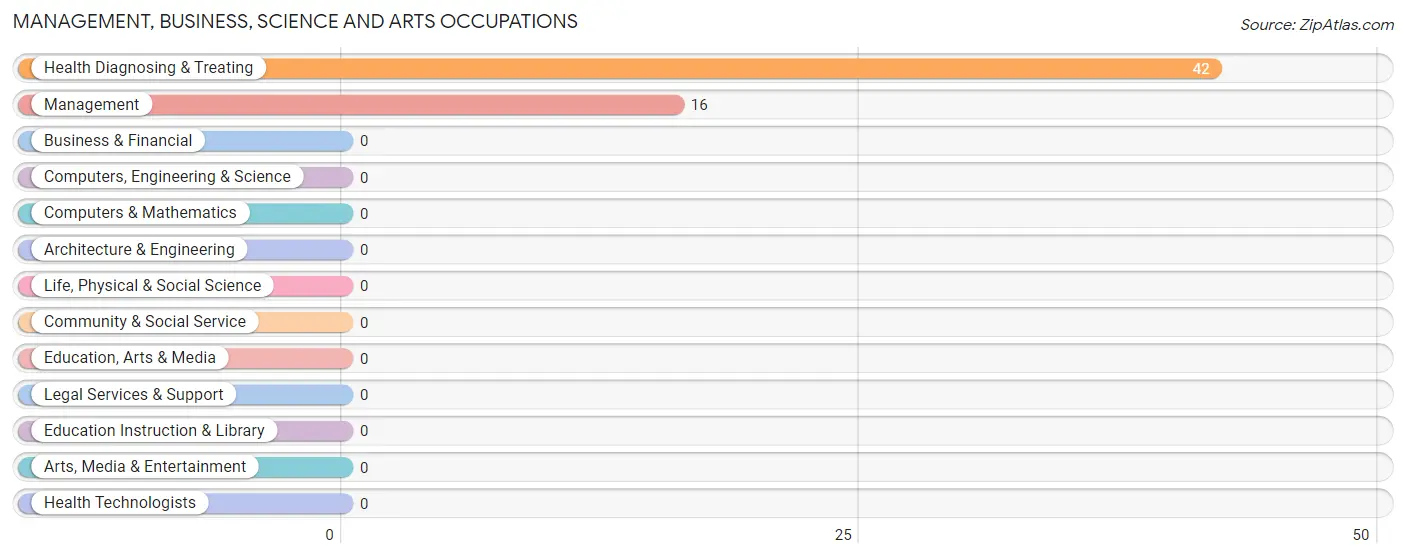
Management, Business, Science and Arts Occupations by Sex
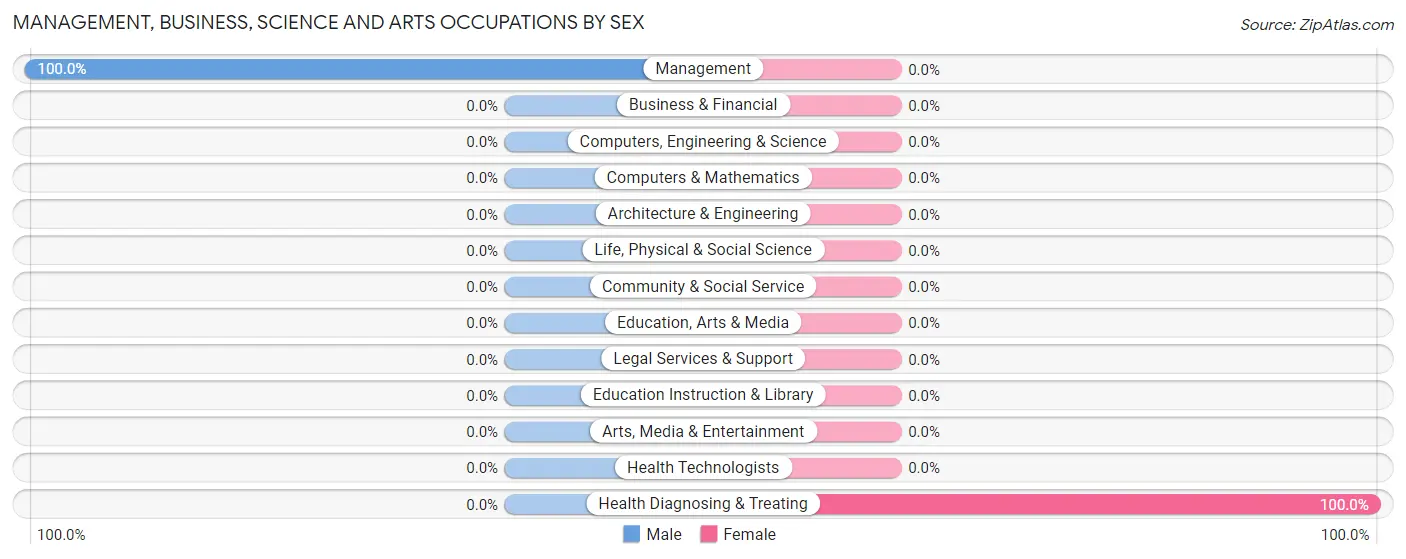
| Occupation | Male | Female |
| Management | 16 (100.0%) | 0 (0.0%) |
| Business & Financial | 0 (0.0%) | 0 (0.0%) |
| Computers, Engineering & Science | 0 (0.0%) | 0 (0.0%) |
| Computers & Mathematics | 0 (0.0%) | 0 (0.0%) |
| Architecture & Engineering | 0 (0.0%) | 0 (0.0%) |
| Life, Physical & Social Science | 0 (0.0%) | 0 (0.0%) |
| Community & Social Service | 0 (0.0%) | 0 (0.0%) |
| Education, Arts & Media | 0 (0.0%) | 0 (0.0%) |
| Legal Services & Support | 0 (0.0%) | 0 (0.0%) |
| Education Instruction & Library | 0 (0.0%) | 0 (0.0%) |
| Arts, Media & Entertainment | 0 (0.0%) | 0 (0.0%) |
| Health Diagnosing & Treating | 0 (0.0%) | 42 (100.0%) |
| Health Technologists | 0 (0.0%) | 0 (0.0%) |
| Total (Category) | 16 (27.6%) | 42 (72.4%) |
| Total (Overall) | 129 (49.2%) | 133 (50.8%) |
Services Occupations
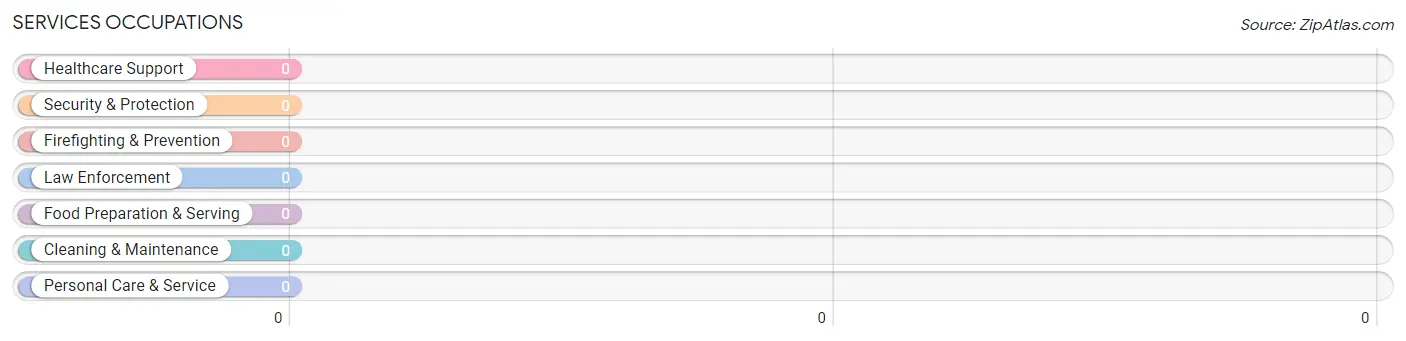
Services Occupations by Sex
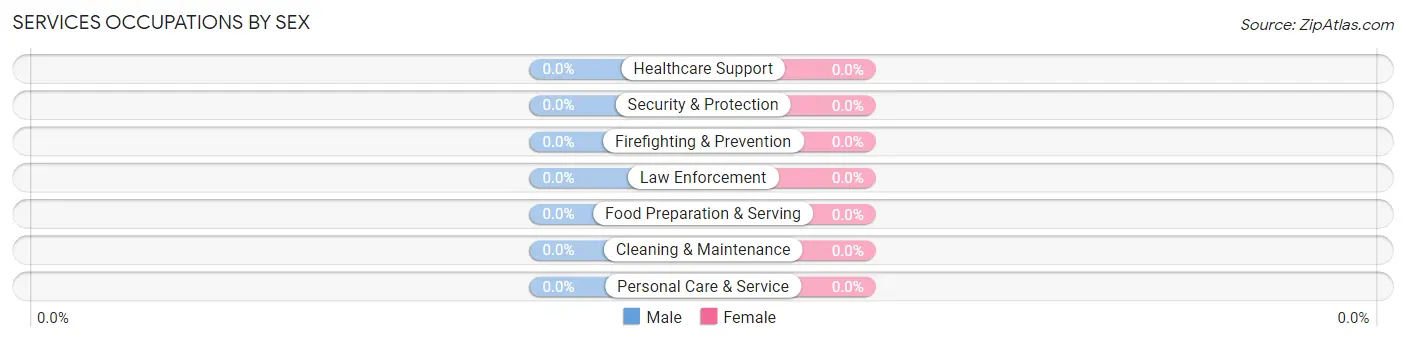
| Occupation | Male | Female |
| Healthcare Support | 0 (0.0%) | 0 (0.0%) |
| Security & Protection | 0 (0.0%) | 0 (0.0%) |
| Firefighting & Prevention | 0 (0.0%) | 0 (0.0%) |
| Law Enforcement | 0 (0.0%) | 0 (0.0%) |
| Food Preparation & Serving | 0 (0.0%) | 0 (0.0%) |
| Cleaning & Maintenance | 0 (0.0%) | 0 (0.0%) |
| Personal Care & Service | 0 (0.0%) | 0 (0.0%) |
| Total (Category) | 0 (0.0%) | 0 (0.0%) |
| Total (Overall) | 129 (49.2%) | 133 (50.8%) |
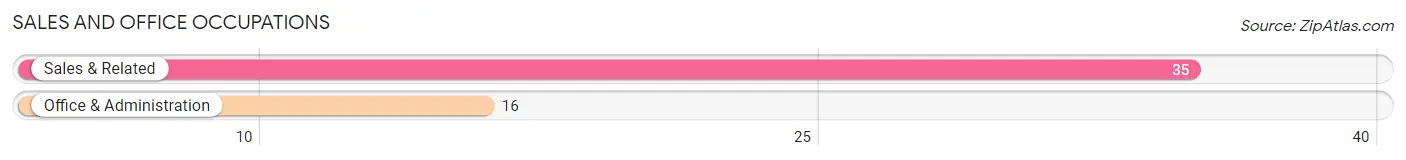
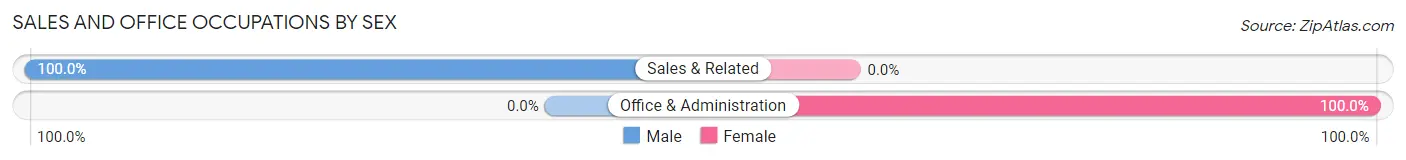
Sales and Office Occupations
The most common Sales and Office occupations in Beatty are Sales & Related (35 | 13.4%), and Office & Administration (16 | 6.1%).
Sales and Office Occupations by Sex
| Occupation | Male | Female |
| Sales & Related | 35 (100.0%) | 0 (0.0%) |
| Office & Administration | 0 (0.0%) | 16 (100.0%) |
| Total (Category) | 35 (68.6%) | 16 (31.4%) |
| Total (Overall) | 129 (49.2%) | 133 (50.8%) |
Natural Resources, Construction and Maintenance Occupations
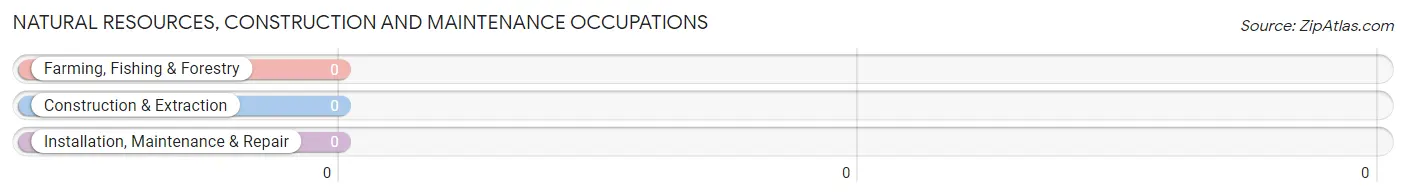
Natural Resources, Construction and Maintenance Occupations by Sex
| Occupation | Male | Female |
| Farming, Fishing & Forestry | 0 (0.0%) | 0 (0.0%) |
| Construction & Extraction | 0 (0.0%) | 0 (0.0%) |
| Installation, Maintenance & Repair | 0 (0.0%) | 0 (0.0%) |
| Total (Category) | 0 (0.0%) | 0 (0.0%) |
| Total (Overall) | 129 (49.2%) | 133 (50.8%) |
Production, Transportation and Moving Occupations
The most common Production, Transportation and Moving occupations in Beatty are , and Production (153 | 58.4%).
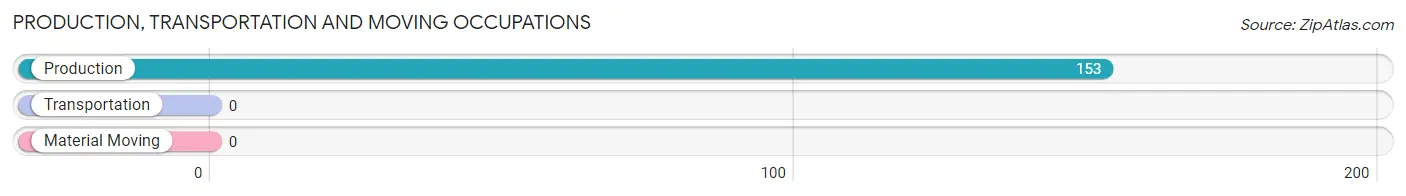
Production, Transportation and Moving Occupations by Sex
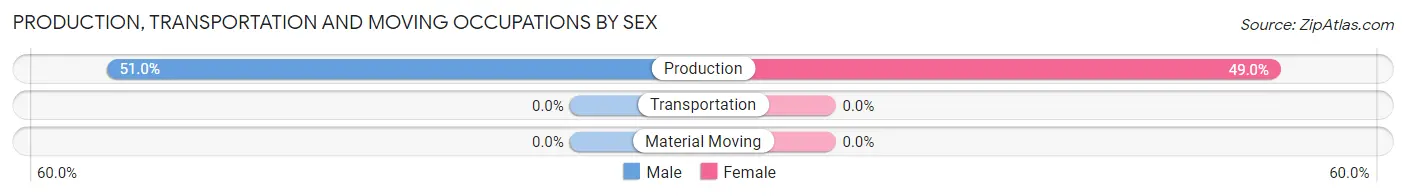
| Occupation | Male | Female |
| Production | 78 (51.0%) | 75 (49.0%) |
| Transportation | 0 (0.0%) | 0 (0.0%) |
| Material Moving | 0 (0.0%) | 0 (0.0%) |
| Total (Category) | 78 (51.0%) | 75 (49.0%) |
| Total (Overall) | 129 (49.2%) | 133 (50.8%) |
Employment Industries by Sex in Beatty
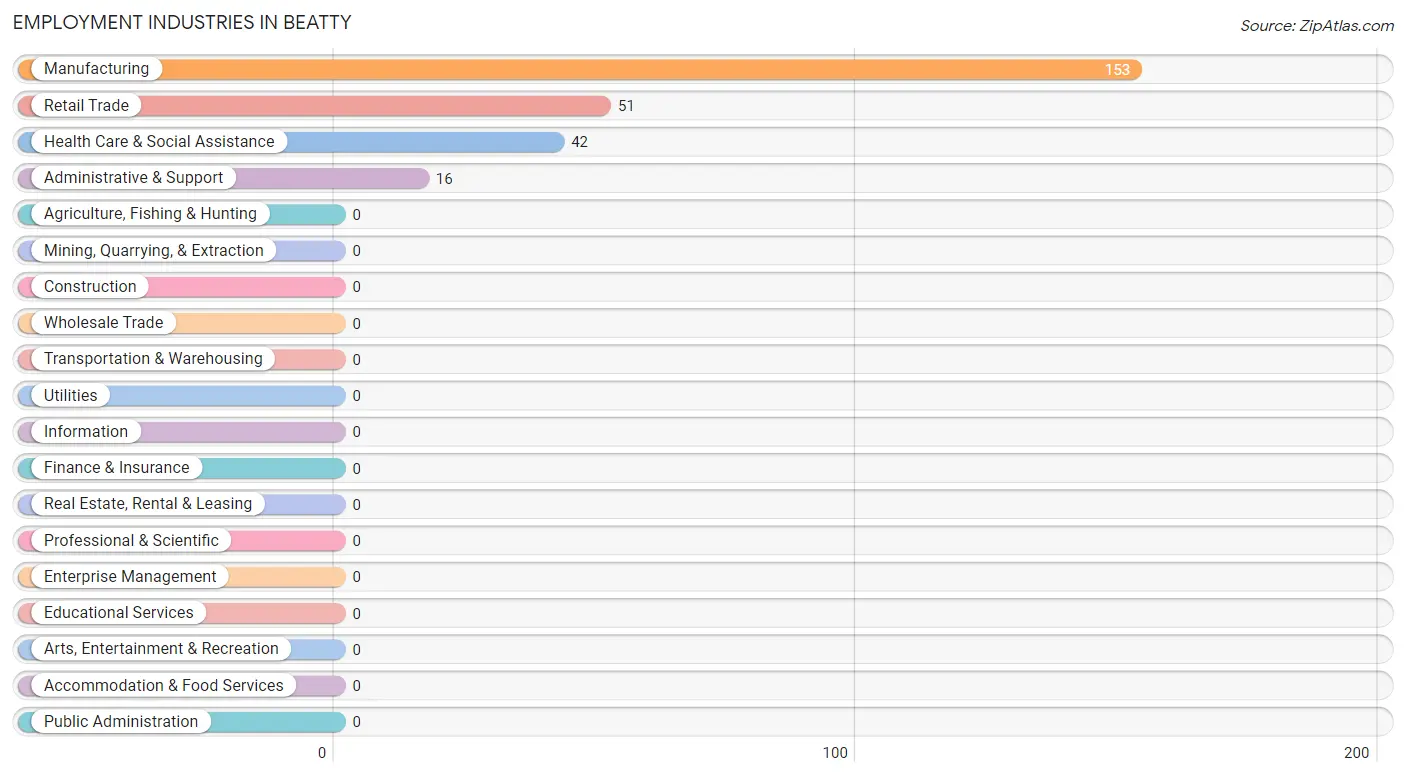
Employment Industries in Beatty
The major employment industries in Beatty include Manufacturing (153 | 58.4%), Retail Trade (51 | 19.5%), Health Care & Social Assistance (42 | 16.0%), and Administrative & Support (16 | 6.1%).
Employment Industries by Sex in Beatty
The Beatty industries that see more men than women are Administrative & Support (100.0%), Retail Trade (68.6%), and Manufacturing (51.0%), whereas the industries that tend to have a higher number of women are Health Care & Social Assistance (100.0%), Manufacturing (49.0%), and Retail Trade (31.4%).
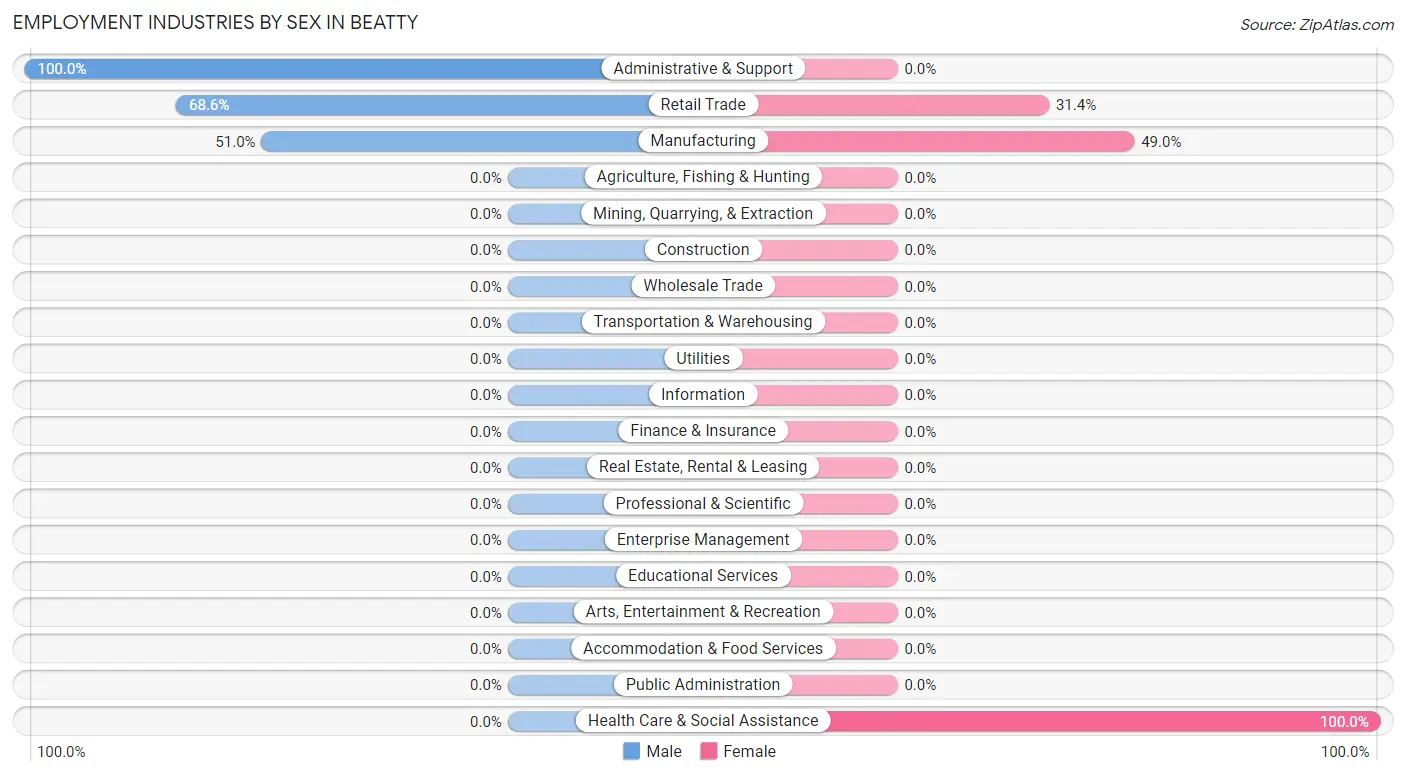
| Industry | Male | Female |
| Agriculture, Fishing & Hunting | 0 (0.0%) | 0 (0.0%) |
| Mining, Quarrying, & Extraction | 0 (0.0%) | 0 (0.0%) |
| Construction | 0 (0.0%) | 0 (0.0%) |
| Manufacturing | 78 (51.0%) | 75 (49.0%) |
| Wholesale Trade | 0 (0.0%) | 0 (0.0%) |
| Retail Trade | 35 (68.6%) | 16 (31.4%) |
| Transportation & Warehousing | 0 (0.0%) | 0 (0.0%) |
| Utilities | 0 (0.0%) | 0 (0.0%) |
| Information | 0 (0.0%) | 0 (0.0%) |
| Finance & Insurance | 0 (0.0%) | 0 (0.0%) |
| Real Estate, Rental & Leasing | 0 (0.0%) | 0 (0.0%) |
| Professional & Scientific | 0 (0.0%) | 0 (0.0%) |
| Enterprise Management | 0 (0.0%) | 0 (0.0%) |
| Administrative & Support | 16 (100.0%) | 0 (0.0%) |
| Educational Services | 0 (0.0%) | 0 (0.0%) |
| Health Care & Social Assistance | 0 (0.0%) | 42 (100.0%) |
| Arts, Entertainment & Recreation | 0 (0.0%) | 0 (0.0%) |
| Accommodation & Food Services | 0 (0.0%) | 0 (0.0%) |
| Public Administration | 0 (0.0%) | 0 (0.0%) |
| Total | 129 (49.2%) | 133 (50.8%) |
Education in Beatty
School Enrollment in Beatty
| School Level | # Students | % Students |
| Nursery / Preschool | 0 | 0.0% |
| Kindergarten | 0 | 0.0% |
| Elementary School | 0 | 0.0% |
| Middle School | 0 | 0.0% |
| High School | 0 | 0.0% |
| College / Undergraduate | 0 | 0.0% |
| Graduate / Professional | 0 | 0.0% |
| Total | 0 | 0.0% |
School Enrollment by Age by Funding Source in Beatty
| Age Bracket | Public School | Private School |
| 3 to 4 Year Olds | 0 (0.0%) | 0 (0.0%) |
| 5 to 9 Year Old | 0 (0.0%) | 0 (0.0%) |
| 10 to 14 Year Olds | 0 (0.0%) | 0 (0.0%) |
| 15 to 17 Year Olds | 0 (0.0%) | 0 (0.0%) |
| 18 to 19 Year Olds | 0 (0.0%) | 0 (0.0%) |
| 20 to 24 Year Olds | 0 (0.0%) | 0 (0.0%) |
| 25 to 34 Year Olds | 0 (0.0%) | 0 (0.0%) |
| 35 Years and over | 0 (0.0%) | 0 (0.0%) |
| Total | 0 (0.0%) | 0 (0.0%) |
Educational Attainment by Field of Study in Beatty
Business (40 | 53.3%), and education (35 | 46.7%) are the most common fields of study among 75 individuals in Beatty who have obtained a bachelor's degree or higher.
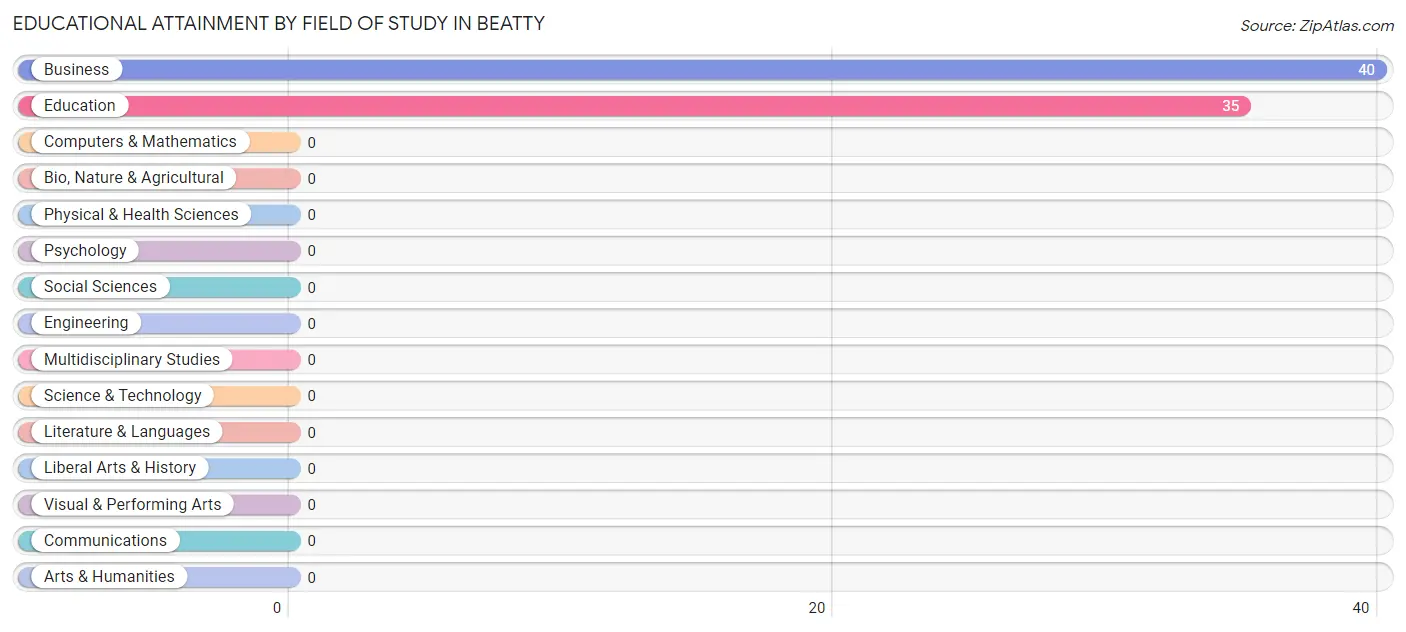
| Field of Study | # Graduates | % Graduates |
| Computers & Mathematics | 0 | 0.0% |
| Bio, Nature & Agricultural | 0 | 0.0% |
| Physical & Health Sciences | 0 | 0.0% |
| Psychology | 0 | 0.0% |
| Social Sciences | 0 | 0.0% |
| Engineering | 0 | 0.0% |
| Multidisciplinary Studies | 0 | 0.0% |
| Science & Technology | 0 | 0.0% |
| Business | 40 | 53.3% |
| Education | 35 | 46.7% |
| Literature & Languages | 0 | 0.0% |
| Liberal Arts & History | 0 | 0.0% |
| Visual & Performing Arts | 0 | 0.0% |
| Communications | 0 | 0.0% |
| Arts & Humanities | 0 | 0.0% |
| Total | 75 | 100.0% |
Transportation & Commute in Beatty
Vehicle Availability by Sex in Beatty
The most prevalent vehicle ownership categories in Beatty are males with 1 vehicle (78, accounting for 60.5%) and females with 1 vehicle (42, making up 58.7%).
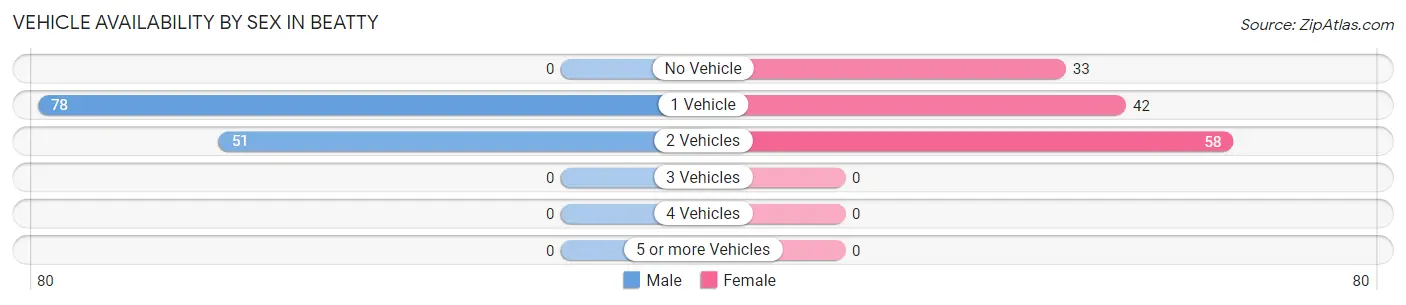
| Vehicles Available | Male | Female |
| No Vehicle | 0 (0.0%) | 33 (24.8%) |
| 1 Vehicle | 78 (60.5%) | 42 (31.6%) |
| 2 Vehicles | 51 (39.5%) | 58 (43.6%) |
| 3 Vehicles | 0 (0.0%) | 0 (0.0%) |
| 4 Vehicles | 0 (0.0%) | 0 (0.0%) |
| 5 or more Vehicles | 0 (0.0%) | 0 (0.0%) |
| Total | 129 (100.0%) | 133 (100.0%) |
Commute Time in Beatty
The most frequently occuring commute durations in Beatty are 10 to 14 minutes (111 commuters, 42.4%), 5 to 9 minutes (100 commuters, 38.2%), and less than 5 minutes (35 commuters, 13.4%).
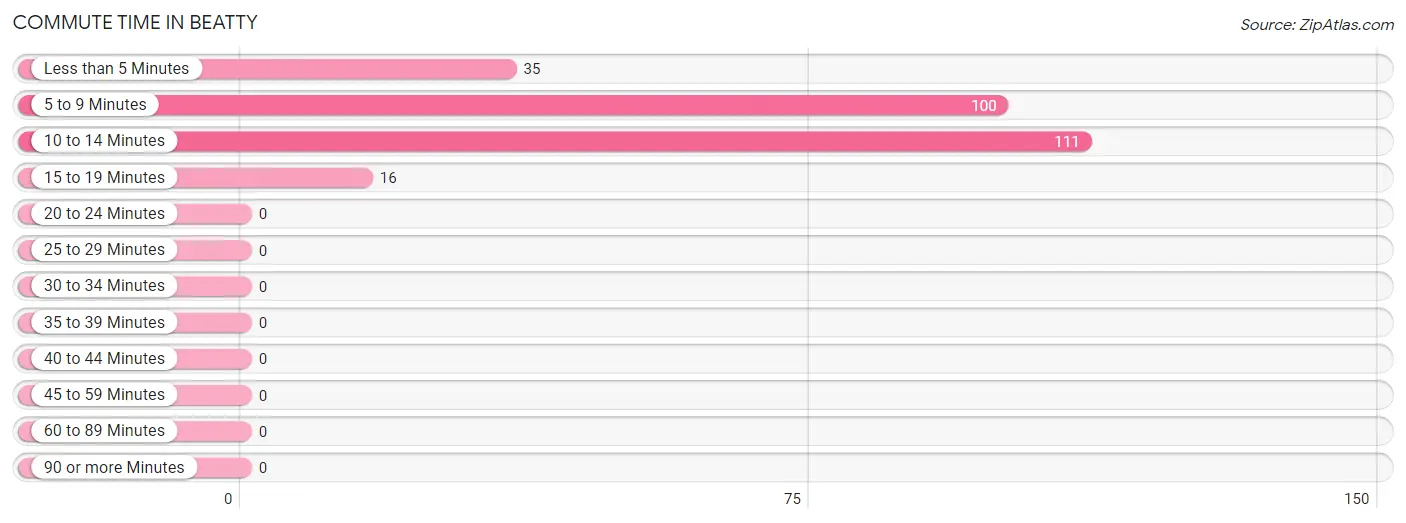
| Commute Time | # Commuters | % Commuters |
| Less than 5 Minutes | 35 | 13.4% |
| 5 to 9 Minutes | 100 | 38.2% |
| 10 to 14 Minutes | 111 | 42.4% |
| 15 to 19 Minutes | 16 | 6.1% |
| 20 to 24 Minutes | 0 | 0.0% |
| 25 to 29 Minutes | 0 | 0.0% |
| 30 to 34 Minutes | 0 | 0.0% |
| 35 to 39 Minutes | 0 | 0.0% |
| 40 to 44 Minutes | 0 | 0.0% |
| 45 to 59 Minutes | 0 | 0.0% |
| 60 to 89 Minutes | 0 | 0.0% |
| 90 or more Minutes | 0 | 0.0% |
Commute Time by Sex in Beatty
The most common commute times in Beatty are 10 to 14 minutes (78 commuters, 60.5%) for males and 5 to 9 minutes (100 commuters, 75.2%) for females.
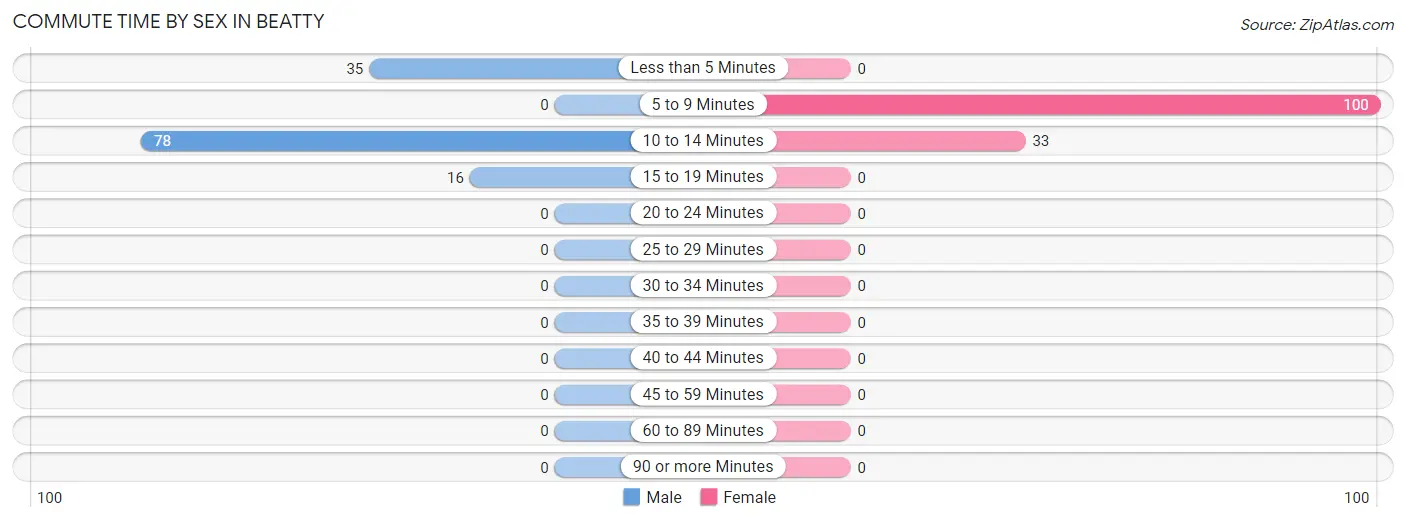
| Commute Time | Male | Female |
| Less than 5 Minutes | 35 (27.1%) | 0 (0.0%) |
| 5 to 9 Minutes | 0 (0.0%) | 100 (75.2%) |
| 10 to 14 Minutes | 78 (60.5%) | 33 (24.8%) |
| 15 to 19 Minutes | 16 (12.4%) | 0 (0.0%) |
| 20 to 24 Minutes | 0 (0.0%) | 0 (0.0%) |
| 25 to 29 Minutes | 0 (0.0%) | 0 (0.0%) |
| 30 to 34 Minutes | 0 (0.0%) | 0 (0.0%) |
| 35 to 39 Minutes | 0 (0.0%) | 0 (0.0%) |
| 40 to 44 Minutes | 0 (0.0%) | 0 (0.0%) |
| 45 to 59 Minutes | 0 (0.0%) | 0 (0.0%) |
| 60 to 89 Minutes | 0 (0.0%) | 0 (0.0%) |
| 90 or more Minutes | 0 (0.0%) | 0 (0.0%) |
Time of Departure to Work by Sex in Beatty
The most frequent times of departure to work in Beatty are 4:00 PM to 11:59 PM (78, 60.5%) for males and 7:00 AM to 7:29 AM (42, 31.6%) for females.
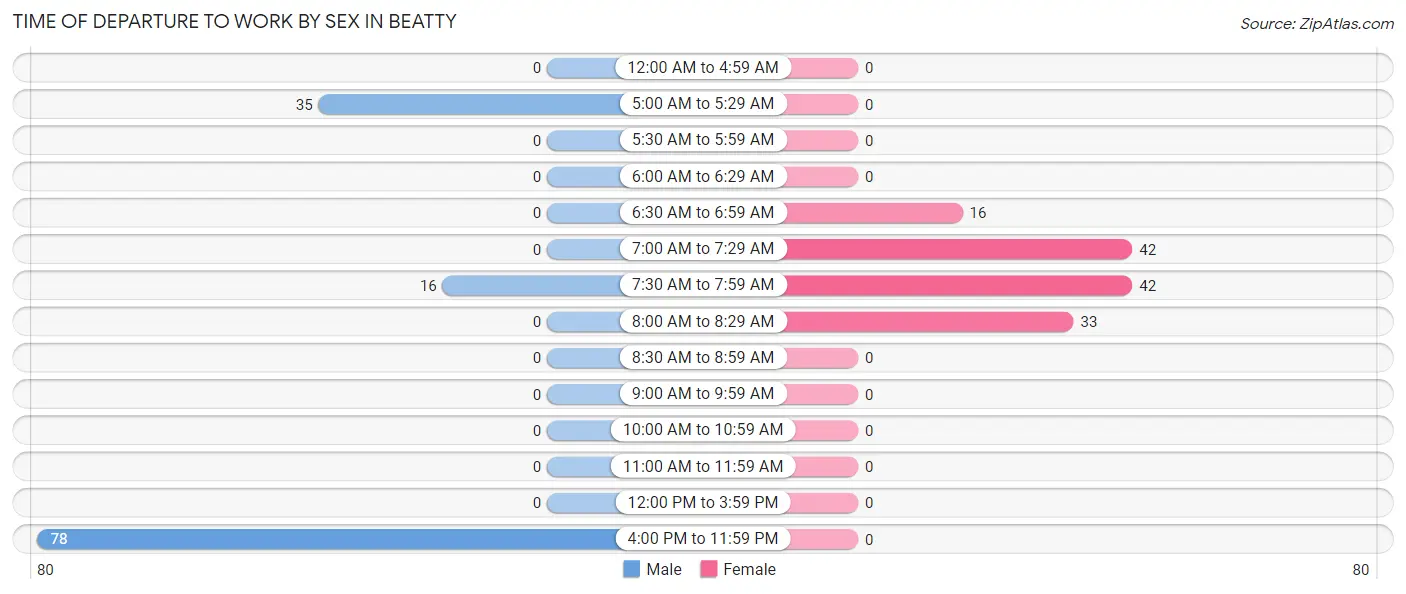
| Time of Departure | Male | Female |
| 12:00 AM to 4:59 AM | 0 (0.0%) | 0 (0.0%) |
| 5:00 AM to 5:29 AM | 35 (27.1%) | 0 (0.0%) |
| 5:30 AM to 5:59 AM | 0 (0.0%) | 0 (0.0%) |
| 6:00 AM to 6:29 AM | 0 (0.0%) | 0 (0.0%) |
| 6:30 AM to 6:59 AM | 0 (0.0%) | 16 (12.0%) |
| 7:00 AM to 7:29 AM | 0 (0.0%) | 42 (31.6%) |
| 7:30 AM to 7:59 AM | 16 (12.4%) | 42 (31.6%) |
| 8:00 AM to 8:29 AM | 0 (0.0%) | 33 (24.8%) |
| 8:30 AM to 8:59 AM | 0 (0.0%) | 0 (0.0%) |
| 9:00 AM to 9:59 AM | 0 (0.0%) | 0 (0.0%) |
| 10:00 AM to 10:59 AM | 0 (0.0%) | 0 (0.0%) |
| 11:00 AM to 11:59 AM | 0 (0.0%) | 0 (0.0%) |
| 12:00 PM to 3:59 PM | 0 (0.0%) | 0 (0.0%) |
| 4:00 PM to 11:59 PM | 78 (60.5%) | 0 (0.0%) |
| Total | 129 (100.0%) | 133 (100.0%) |
Housing Occupancy in Beatty
Occupancy by Ownership in Beatty
Of the total 378 dwellings in Beatty, owner-occupied units account for 167 (44.2%), while renter-occupied units make up 211 (55.8%).
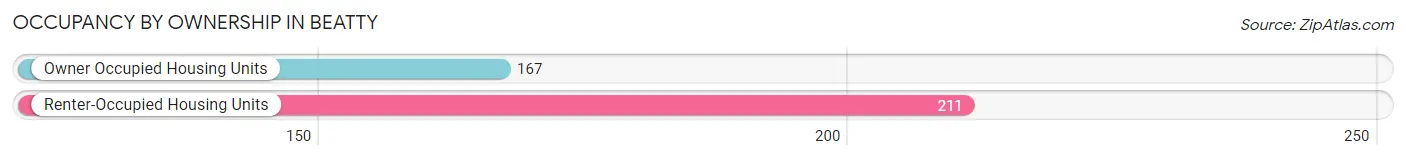
| Occupancy | # Housing Units | % Housing Units |
| Owner Occupied Housing Units | 167 | 44.2% |
| Renter-Occupied Housing Units | 211 | 55.8% |
| Total Occupied Housing Units | 378 | 100.0% |
Occupancy by Household Size in Beatty
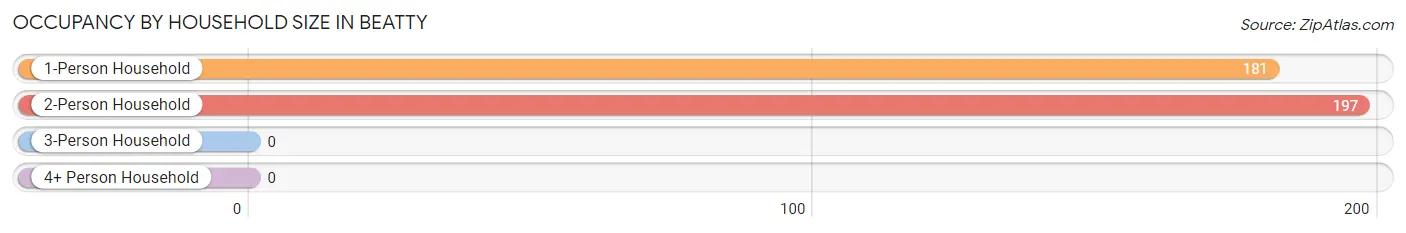
| Household Size | # Housing Units | % Housing Units |
| 1-Person Household | 181 | 47.9% |
| 2-Person Household | 197 | 52.1% |
| 3-Person Household | 0 | 0.0% |
| 4+ Person Household | 0 | 0.0% |
| Total Housing Units | 378 | 100.0% |
Occupancy by Ownership by Household Size in Beatty
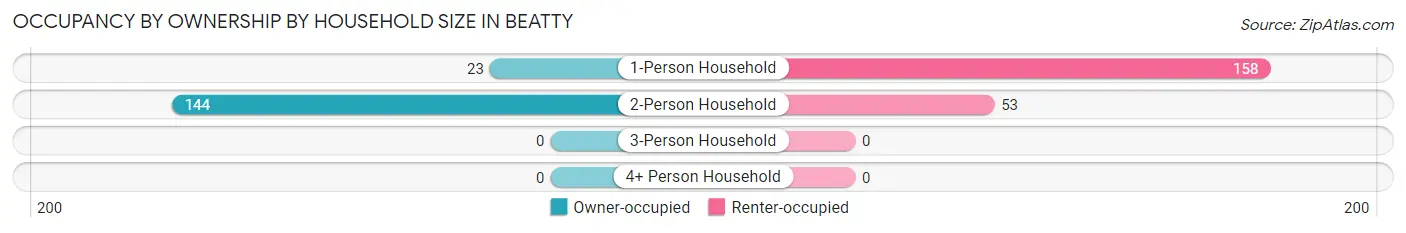
| Household Size | Owner-occupied | Renter-occupied |
| 1-Person Household | 23 (12.7%) | 158 (87.3%) |
| 2-Person Household | 144 (73.1%) | 53 (26.9%) |
| 3-Person Household | 0 (0.0%) | 0 (0.0%) |
| 4+ Person Household | 0 (0.0%) | 0 (0.0%) |
| Total Housing Units | 167 (44.2%) | 211 (55.8%) |
Occupancy by Educational Attainment in Beatty
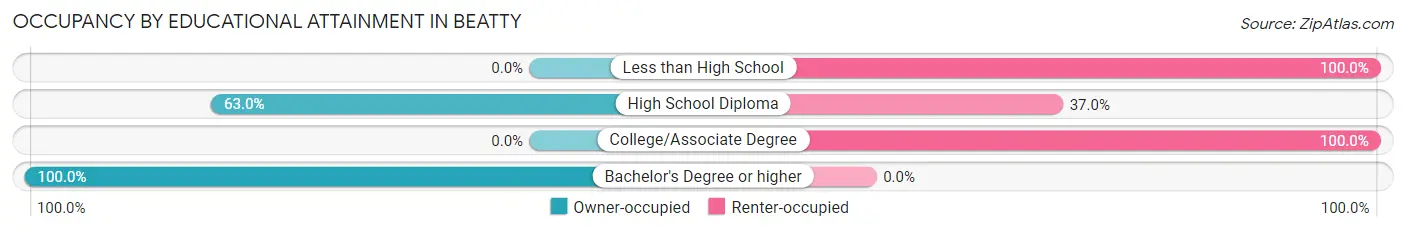
| Household Size | Owner-occupied | Renter-occupied |
| Less than High School | 0 (0.0%) | 115 (100.0%) |
| High School Diploma | 92 (63.0%) | 54 (37.0%) |
| College/Associate Degree | 0 (0.0%) | 42 (100.0%) |
| Bachelor's Degree or higher | 75 (100.0%) | 0 (0.0%) |
Occupancy by Age of Householder in Beatty
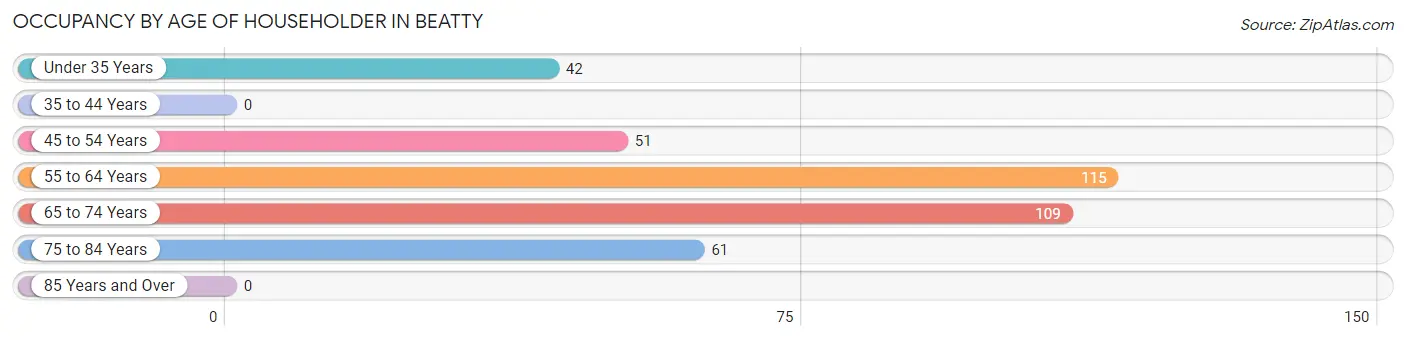
| Age Bracket | # Households | % Households |
| Under 35 Years | 42 | 11.1% |
| 35 to 44 Years | 0 | 0.0% |
| 45 to 54 Years | 51 | 13.5% |
| 55 to 64 Years | 115 | 30.4% |
| 65 to 74 Years | 109 | 28.8% |
| 75 to 84 Years | 61 | 16.1% |
| 85 Years and Over | 0 | 0.0% |
| Total | 378 | 100.0% |
Housing Finances in Beatty
Median Income by Occupancy in Beatty
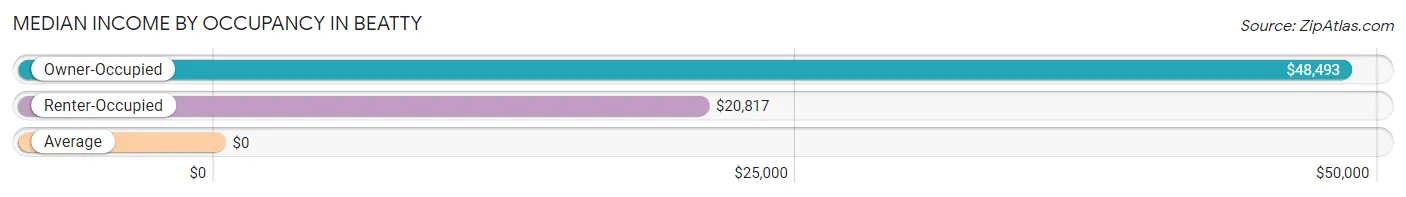
| Occupancy Type | # Households | Median Income |
| Owner-Occupied | 167 (44.2%) | $48,493 |
| Renter-Occupied | 211 (55.8%) | $20,817 |
| Average | 378 (100.0%) | $0 |
Occupancy by Householder Income Bracket in Beatty
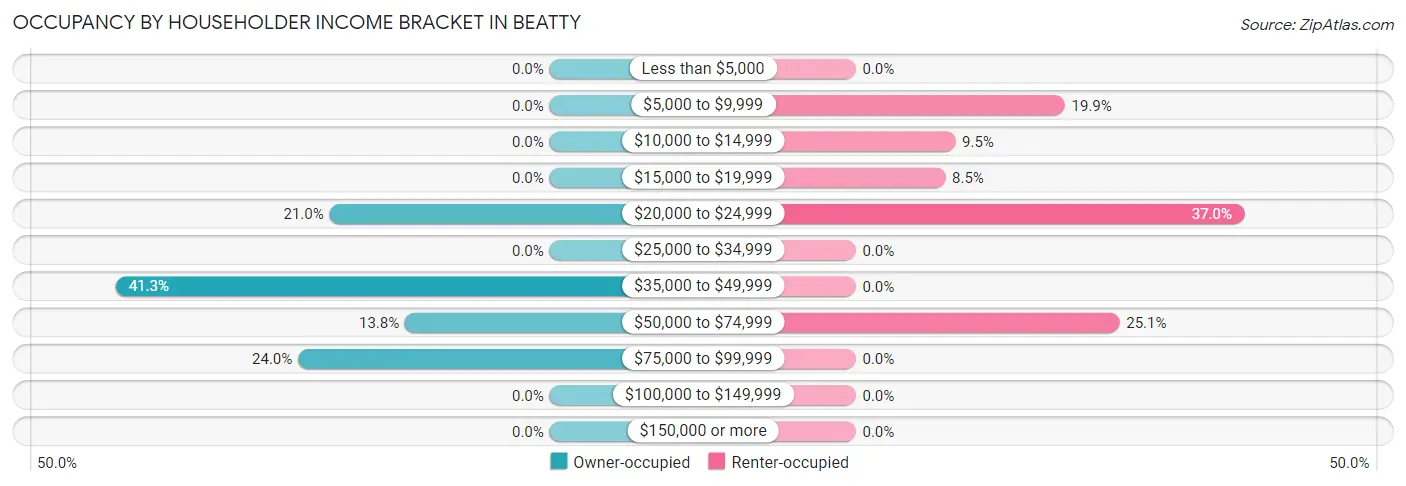
| Income Bracket | Owner-occupied | Renter-occupied |
| Less than $5,000 | 0 (0.0%) | 0 (0.0%) |
| $5,000 to $9,999 | 0 (0.0%) | 42 (19.9%) |
| $10,000 to $14,999 | 0 (0.0%) | 20 (9.5%) |
| $15,000 to $19,999 | 0 (0.0%) | 18 (8.5%) |
| $20,000 to $24,999 | 35 (21.0%) | 78 (37.0%) |
| $25,000 to $34,999 | 0 (0.0%) | 0 (0.0%) |
| $35,000 to $49,999 | 69 (41.3%) | 0 (0.0%) |
| $50,000 to $74,999 | 23 (13.8%) | 53 (25.1%) |
| $75,000 to $99,999 | 40 (23.9%) | 0 (0.0%) |
| $100,000 to $149,999 | 0 (0.0%) | 0 (0.0%) |
| $150,000 or more | 0 (0.0%) | 0 (0.0%) |
| Total | 167 (100.0%) | 211 (100.0%) |
Monthly Housing Cost Tiers in Beatty
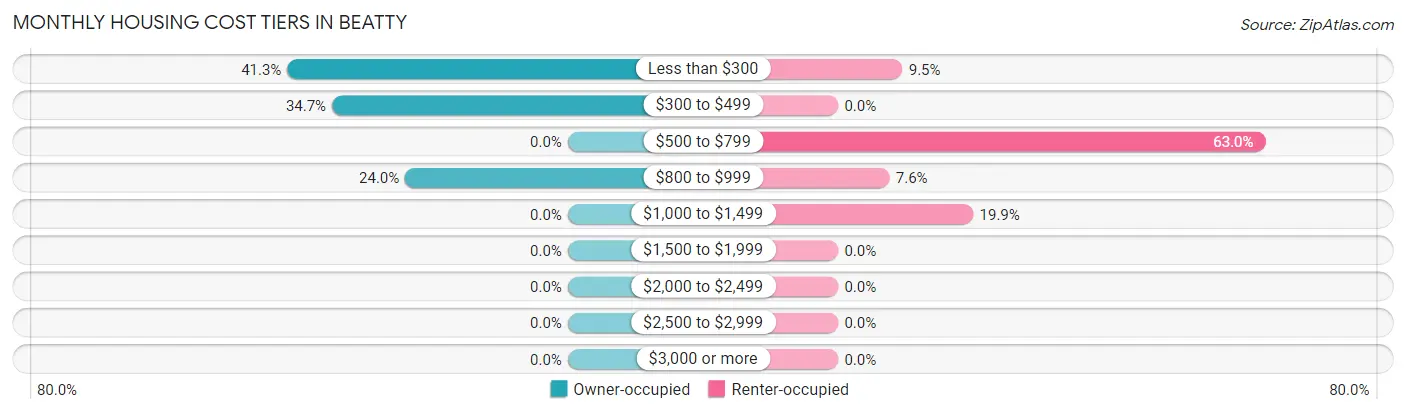
| Monthly Cost | Owner-occupied | Renter-occupied |
| Less than $300 | 69 (41.3%) | 20 (9.5%) |
| $300 to $499 | 58 (34.7%) | 0 (0.0%) |
| $500 to $799 | 0 (0.0%) | 133 (63.0%) |
| $800 to $999 | 40 (23.9%) | 16 (7.6%) |
| $1,000 to $1,499 | 0 (0.0%) | 42 (19.9%) |
| $1,500 to $1,999 | 0 (0.0%) | 0 (0.0%) |
| $2,000 to $2,499 | 0 (0.0%) | 0 (0.0%) |
| $2,500 to $2,999 | 0 (0.0%) | 0 (0.0%) |
| $3,000 or more | 0 (0.0%) | 0 (0.0%) |
| Total | 167 (100.0%) | 211 (100.0%) |
Physical Housing Characteristics in Beatty
Housing Structures in Beatty
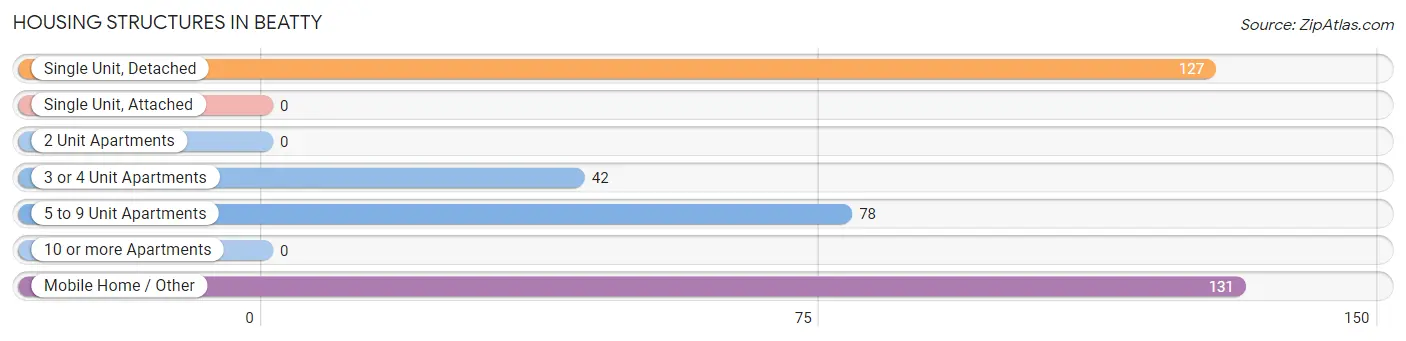
| Structure Type | # Housing Units | % Housing Units |
| Single Unit, Detached | 127 | 33.6% |
| Single Unit, Attached | 0 | 0.0% |
| 2 Unit Apartments | 0 | 0.0% |
| 3 or 4 Unit Apartments | 42 | 11.1% |
| 5 to 9 Unit Apartments | 78 | 20.6% |
| 10 or more Apartments | 0 | 0.0% |
| Mobile Home / Other | 131 | 34.7% |
| Total | 378 | 100.0% |
Housing Structures by Occupancy in Beatty
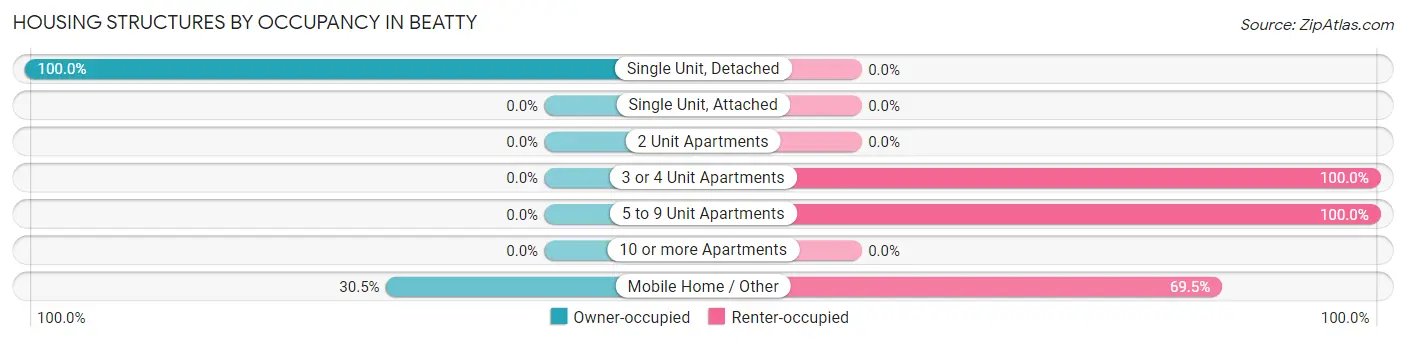
| Structure Type | Owner-occupied | Renter-occupied |
| Single Unit, Detached | 127 (100.0%) | 0 (0.0%) |
| Single Unit, Attached | 0 (0.0%) | 0 (0.0%) |
| 2 Unit Apartments | 0 (0.0%) | 0 (0.0%) |
| 3 or 4 Unit Apartments | 0 (0.0%) | 42 (100.0%) |
| 5 to 9 Unit Apartments | 0 (0.0%) | 78 (100.0%) |
| 10 or more Apartments | 0 (0.0%) | 0 (0.0%) |
| Mobile Home / Other | 40 (30.5%) | 91 (69.5%) |
| Total | 167 (44.2%) | 211 (55.8%) |
Housing Structures by Number of Rooms in Beatty
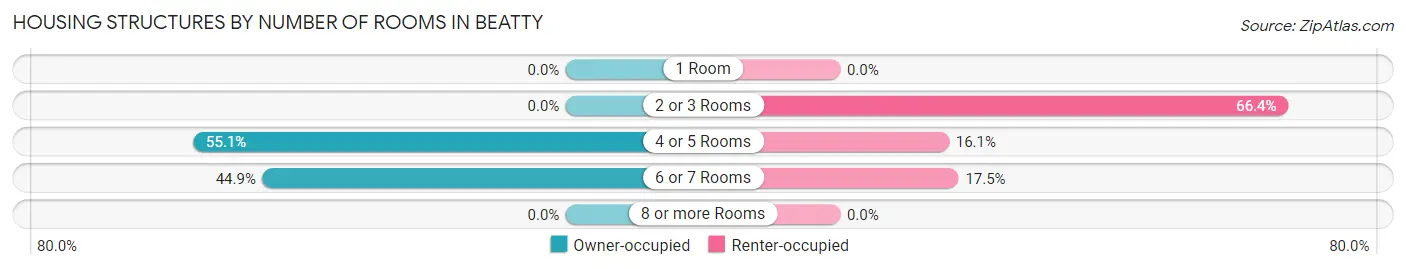
| Number of Rooms | Owner-occupied | Renter-occupied |
| 1 Room | 0 (0.0%) | 0 (0.0%) |
| 2 or 3 Rooms | 0 (0.0%) | 140 (66.3%) |
| 4 or 5 Rooms | 92 (55.1%) | 34 (16.1%) |
| 6 or 7 Rooms | 75 (44.9%) | 37 (17.5%) |
| 8 or more Rooms | 0 (0.0%) | 0 (0.0%) |
| Total | 167 (100.0%) | 211 (100.0%) |
Housing Structure by Heating Type in Beatty
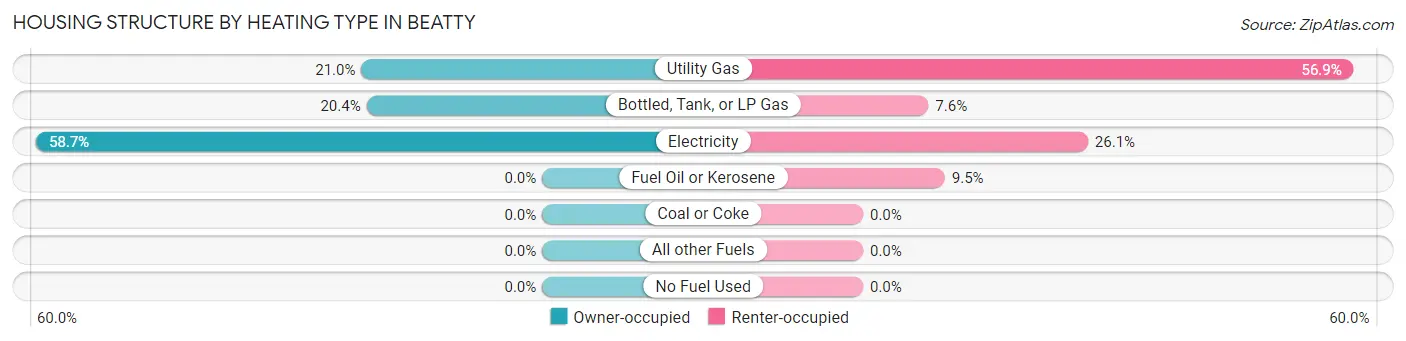
| Heating Type | Owner-occupied | Renter-occupied |
| Utility Gas | 35 (21.0%) | 120 (56.9%) |
| Bottled, Tank, or LP Gas | 34 (20.4%) | 16 (7.6%) |
| Electricity | 98 (58.7%) | 55 (26.1%) |
| Fuel Oil or Kerosene | 0 (0.0%) | 20 (9.5%) |
| Coal or Coke | 0 (0.0%) | 0 (0.0%) |
| All other Fuels | 0 (0.0%) | 0 (0.0%) |
| No Fuel Used | 0 (0.0%) | 0 (0.0%) |
| Total | 167 (100.0%) | 211 (100.0%) |
Household Vehicle Usage in Beatty
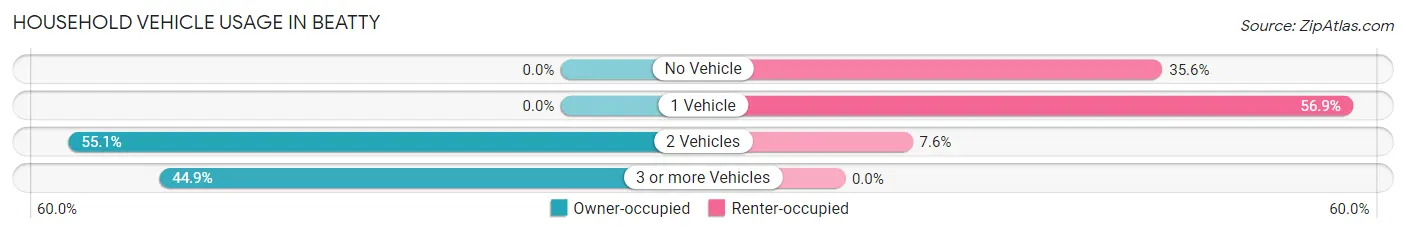
| Vehicles per Household | Owner-occupied | Renter-occupied |
| No Vehicle | 0 (0.0%) | 75 (35.5%) |
| 1 Vehicle | 0 (0.0%) | 120 (56.9%) |
| 2 Vehicles | 92 (55.1%) | 16 (7.6%) |
| 3 or more Vehicles | 75 (44.9%) | 0 (0.0%) |
| Total | 167 (100.0%) | 211 (100.0%) |
Real Estate & Mortgages in Beatty
Real Estate and Mortgage Overview in Beatty
| Characteristic | Without Mortgage | With Mortgage |
| Housing Units | 127 | 40 |
| Median Property Value | - | - |
| Median Household Income | $44,536 | $0 |
| Monthly Housing Costs | $296 | $0 |
| Real Estate Taxes | - | - |
Property Value by Mortgage Status in Beatty
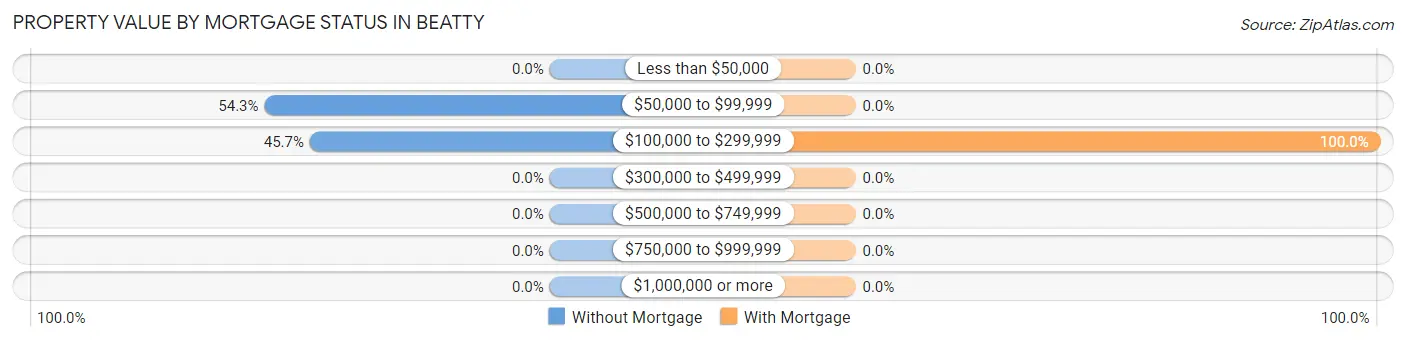
| Property Value | Without Mortgage | With Mortgage |
| Less than $50,000 | 0 (0.0%) | 0 (0.0%) |
| $50,000 to $99,999 | 69 (54.3%) | 0 (0.0%) |
| $100,000 to $299,999 | 58 (45.7%) | 40 (100.0%) |
| $300,000 to $499,999 | 0 (0.0%) | 0 (0.0%) |
| $500,000 to $749,999 | 0 (0.0%) | 0 (0.0%) |
| $750,000 to $999,999 | 0 (0.0%) | 0 (0.0%) |
| $1,000,000 or more | 0 (0.0%) | 0 (0.0%) |
| Total | 127 (100.0%) | 40 (100.0%) |
Household Income by Mortgage Status in Beatty
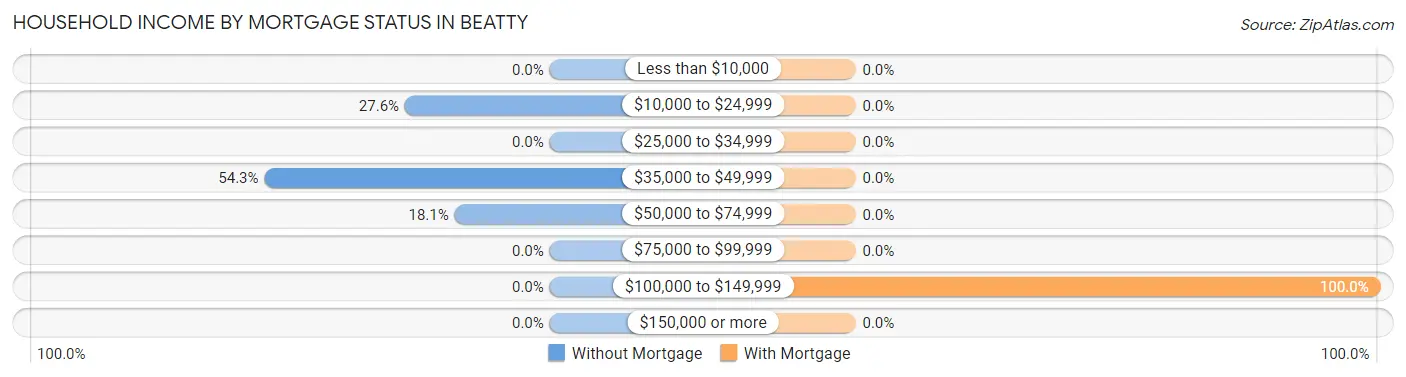
| Household Income | Without Mortgage | With Mortgage |
| Less than $10,000 | 0 (0.0%) | 0 (0.0%) |
| $10,000 to $24,999 | 35 (27.6%) | 0 (0.0%) |
| $25,000 to $34,999 | 0 (0.0%) | 0 (0.0%) |
| $35,000 to $49,999 | 69 (54.3%) | 0 (0.0%) |
| $50,000 to $74,999 | 23 (18.1%) | 0 (0.0%) |
| $75,000 to $99,999 | 0 (0.0%) | 0 (0.0%) |
| $100,000 to $149,999 | 0 (0.0%) | 40 (100.0%) |
| $150,000 or more | 0 (0.0%) | 0 (0.0%) |
| Total | 127 (100.0%) | 40 (100.0%) |
Property Value to Household Income Ratio in Beatty
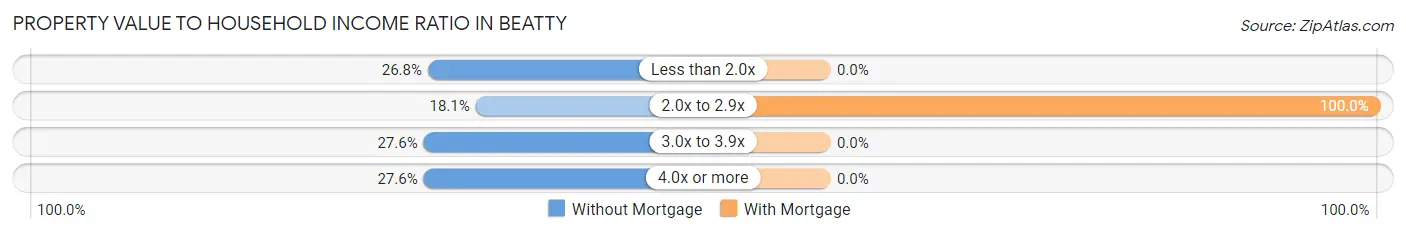
| Value-to-Income Ratio | Without Mortgage | With Mortgage |
| Less than 2.0x | 34 (26.8%) | 0 (0.0%) |
| 2.0x to 2.9x | 23 (18.1%) | 40 (100.0%) |
| 3.0x to 3.9x | 35 (27.6%) | 0 (0.0%) |
| 4.0x or more | 35 (27.6%) | 0 (0.0%) |
| Total | 127 (100.0%) | 40 (100.0%) |
Real Estate Taxes by Mortgage Status in Beatty
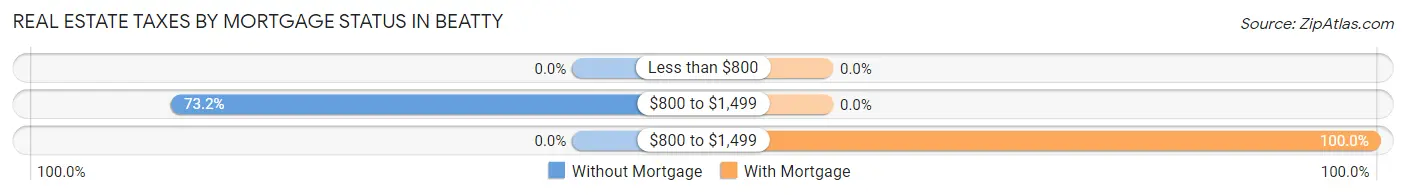
| Property Taxes | Without Mortgage | With Mortgage |
| Less than $800 | 0 (0.0%) | 0 (0.0%) |
| $800 to $1,499 | 93 (73.2%) | 0 (0.0%) |
| $800 to $1,499 | 0 (0.0%) | 40 (100.0%) |
| Total | 127 (100.0%) | 40 (100.0%) |
Health & Disability in Beatty
Health Insurance Coverage by Age in Beatty
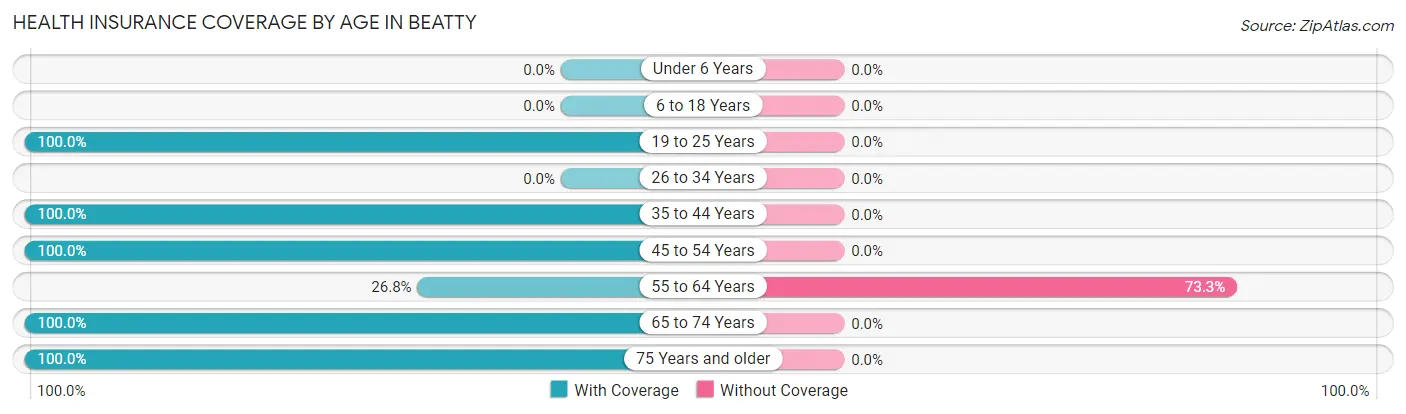
| Age Bracket | With Coverage | Without Coverage |
| Under 6 Years | 0 (0.0%) | 0 (0.0%) |
| 6 to 18 Years | 0 (0.0%) | 0 (0.0%) |
| 19 to 25 Years | 42 (100.0%) | 0 (0.0%) |
| 26 to 34 Years | 0 (0.0%) | 0 (0.0%) |
| 35 to 44 Years | 49 (100.0%) | 0 (0.0%) |
| 45 to 54 Years | 51 (100.0%) | 0 (0.0%) |
| 55 to 64 Years | 42 (26.8%) | 115 (73.3%) |
| 65 to 74 Years | 236 (100.0%) | 0 (0.0%) |
| 75 Years and older | 61 (100.0%) | 0 (0.0%) |
| Total | 481 (80.7%) | 115 (19.3%) |
Health Insurance Coverage by Citizenship Status in Beatty
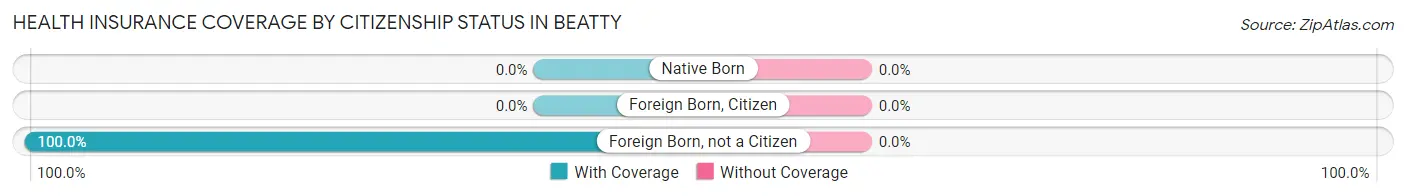
| Citizenship Status | With Coverage | Without Coverage |
| Native Born | 0 (0.0%) | 0 (0.0%) |
| Foreign Born, Citizen | 0 (0.0%) | 0 (0.0%) |
| Foreign Born, not a Citizen | 42 (100.0%) | 0 (0.0%) |
Health Insurance Coverage by Household Income in Beatty
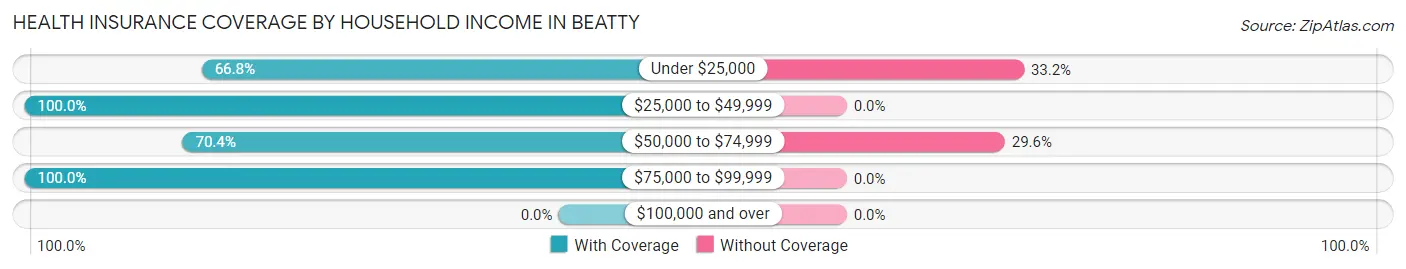
| Household Income | With Coverage | Without Coverage |
| Under $25,000 | 157 (66.8%) | 78 (33.2%) |
| $25,000 to $49,999 | 157 (100.0%) | 0 (0.0%) |
| $50,000 to $74,999 | 88 (70.4%) | 37 (29.6%) |
| $75,000 to $99,999 | 79 (100.0%) | 0 (0.0%) |
| $100,000 and over | 0 (0.0%) | 0 (0.0%) |
Public vs Private Health Insurance Coverage by Age in Beatty
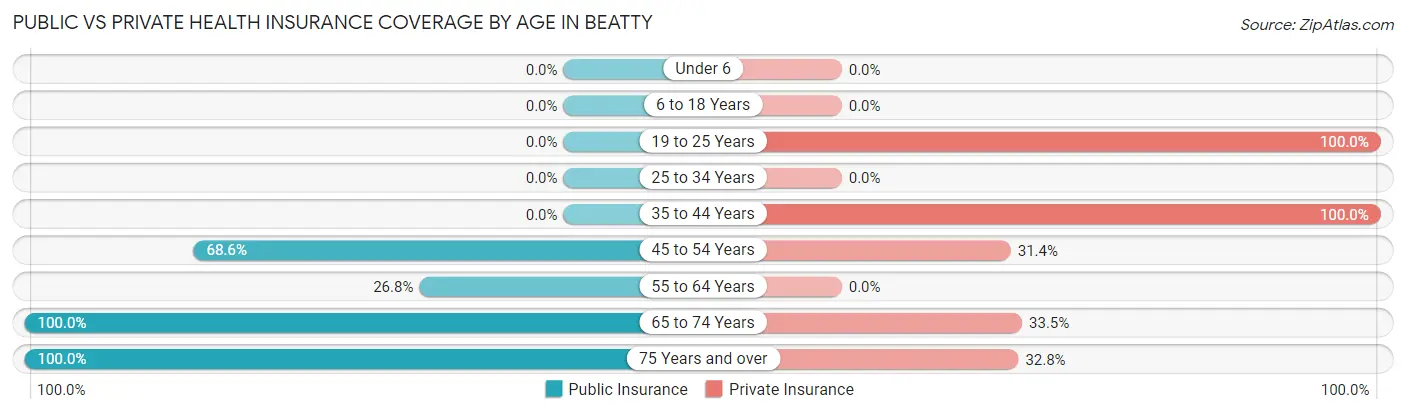
| Age Bracket | Public Insurance | Private Insurance |
| Under 6 | 0 (0.0%) | 0 (0.0%) |
| 6 to 18 Years | 0 (0.0%) | 0 (0.0%) |
| 19 to 25 Years | 0 (0.0%) | 42 (100.0%) |
| 25 to 34 Years | 0 (0.0%) | 0 (0.0%) |
| 35 to 44 Years | 0 (0.0%) | 49 (100.0%) |
| 45 to 54 Years | 35 (68.6%) | 16 (31.4%) |
| 55 to 64 Years | 42 (26.8%) | 0 (0.0%) |
| 65 to 74 Years | 236 (100.0%) | 79 (33.5%) |
| 75 Years and over | 61 (100.0%) | 20 (32.8%) |
| Total | 374 (62.7%) | 206 (34.6%) |
Disability Status by Sex by Age in Beatty
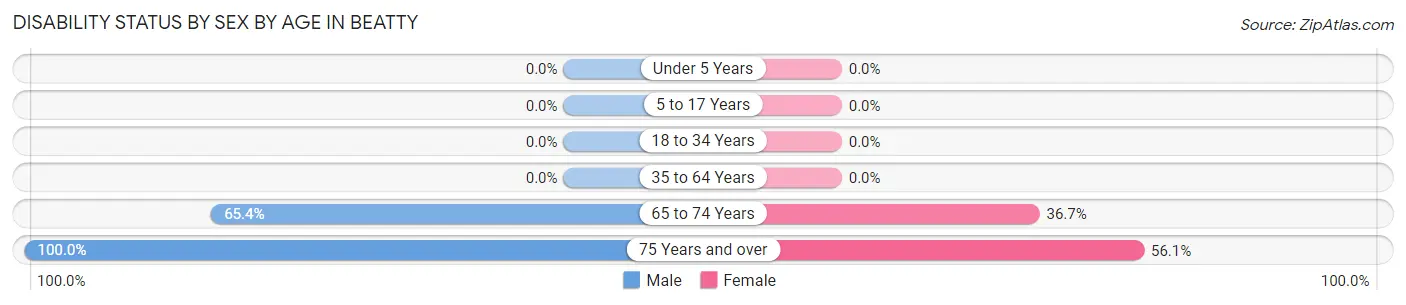
| Age Bracket | Male | Female |
| Under 5 Years | 0 (0.0%) | 0 (0.0%) |
| 5 to 17 Years | 0 (0.0%) | 0 (0.0%) |
| 18 to 34 Years | 0 (0.0%) | 0 (0.0%) |
| 35 to 64 Years | 0 (0.0%) | 0 (0.0%) |
| 65 to 74 Years | 83 (65.3%) | 40 (36.7%) |
| 75 Years and over | 20 (100.0%) | 23 (56.1%) |
Disability Class by Sex by Age in Beatty
Disability Class: Hearing Difficulty
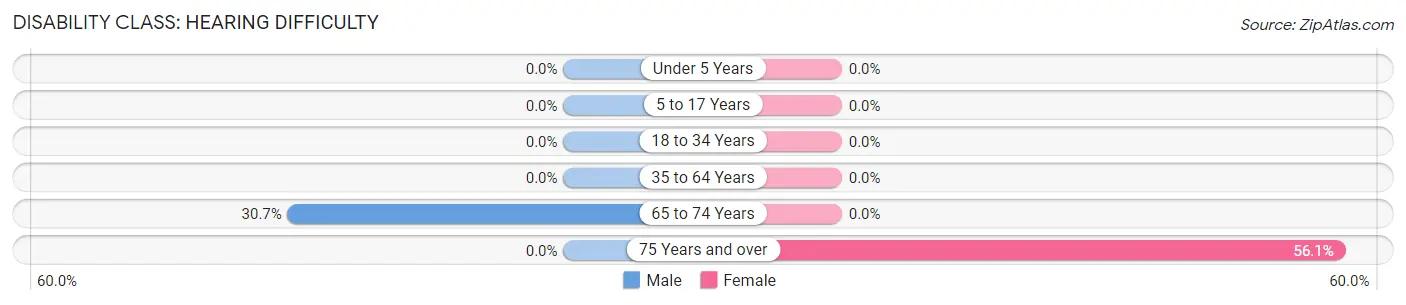
| Age Bracket | Male | Female |
| Under 5 Years | 0 (0.0%) | 0 (0.0%) |
| 5 to 17 Years | 0 (0.0%) | 0 (0.0%) |
| 18 to 34 Years | 0 (0.0%) | 0 (0.0%) |
| 35 to 64 Years | 0 (0.0%) | 0 (0.0%) |
| 65 to 74 Years | 39 (30.7%) | 0 (0.0%) |
| 75 Years and over | 0 (0.0%) | 23 (56.1%) |
Disability Class: Vision Difficulty
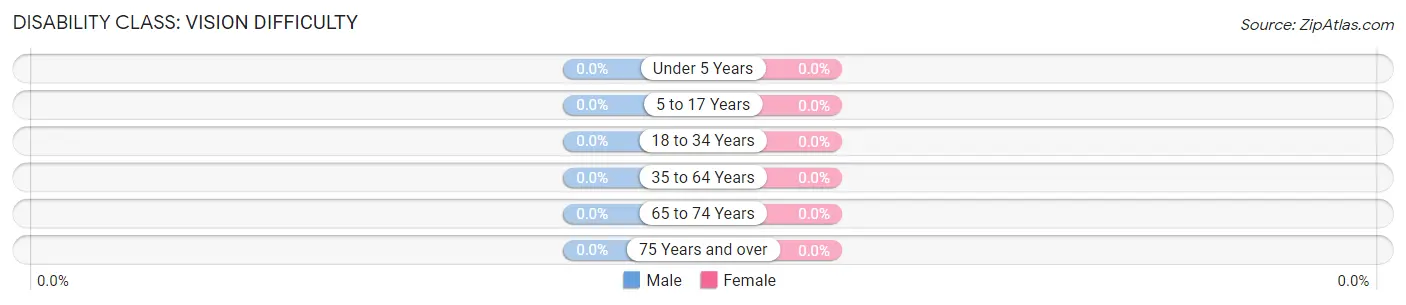
| Age Bracket | Male | Female |
| Under 5 Years | 0 (0.0%) | 0 (0.0%) |
| 5 to 17 Years | 0 (0.0%) | 0 (0.0%) |
| 18 to 34 Years | 0 (0.0%) | 0 (0.0%) |
| 35 to 64 Years | 0 (0.0%) | 0 (0.0%) |
| 65 to 74 Years | 0 (0.0%) | 0 (0.0%) |
| 75 Years and over | 0 (0.0%) | 0 (0.0%) |
Disability Class: Cognitive Difficulty
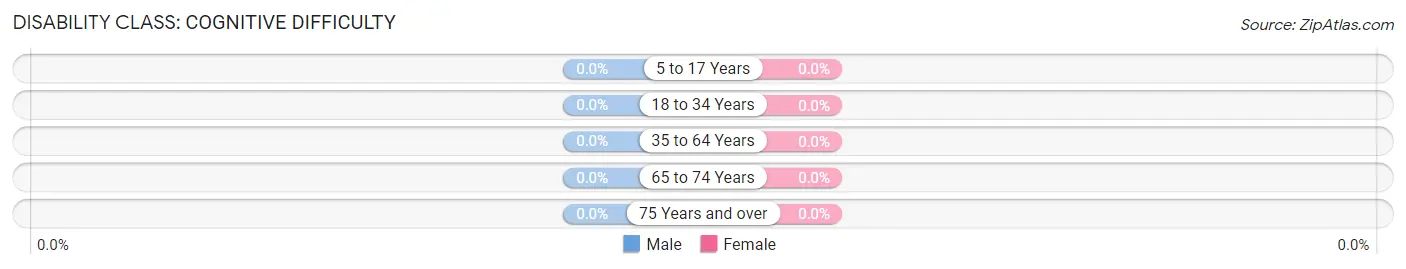
| Age Bracket | Male | Female |
| 5 to 17 Years | 0 (0.0%) | 0 (0.0%) |
| 18 to 34 Years | 0 (0.0%) | 0 (0.0%) |
| 35 to 64 Years | 0 (0.0%) | 0 (0.0%) |
| 65 to 74 Years | 0 (0.0%) | 0 (0.0%) |
| 75 Years and over | 0 (0.0%) | 0 (0.0%) |
Disability Class: Ambulatory Difficulty
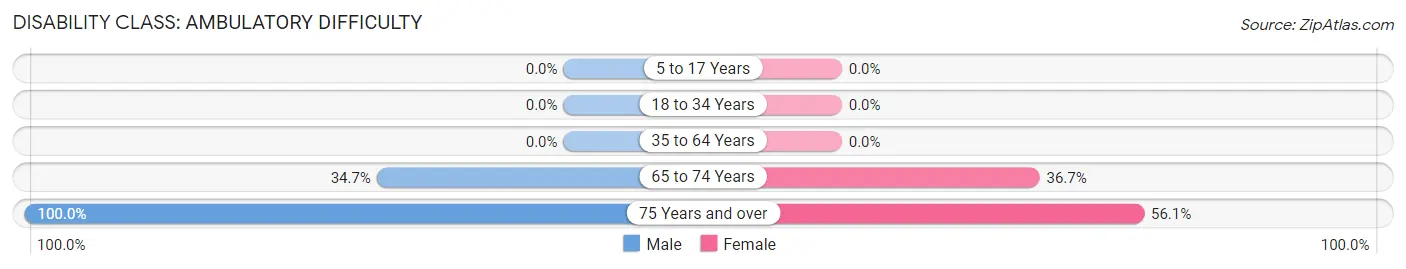
| Age Bracket | Male | Female |
| 5 to 17 Years | 0 (0.0%) | 0 (0.0%) |
| 18 to 34 Years | 0 (0.0%) | 0 (0.0%) |
| 35 to 64 Years | 0 (0.0%) | 0 (0.0%) |
| 65 to 74 Years | 44 (34.6%) | 40 (36.7%) |
| 75 Years and over | 20 (100.0%) | 23 (56.1%) |
Disability Class: Self-Care Difficulty
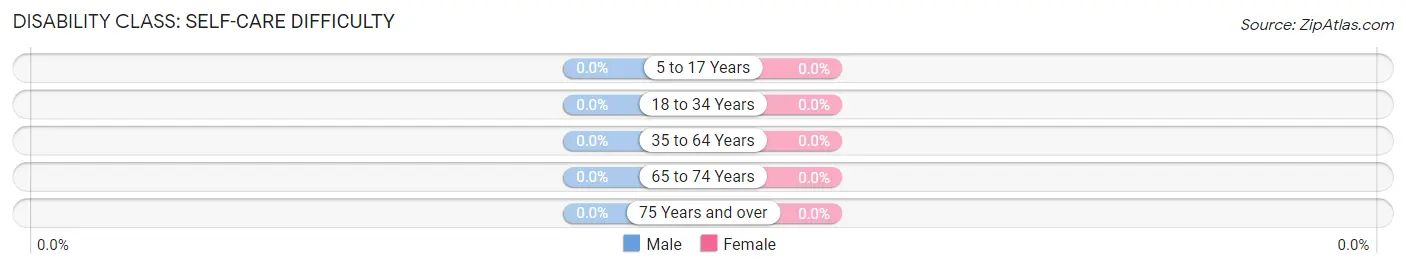
| Age Bracket | Male | Female |
| 5 to 17 Years | 0 (0.0%) | 0 (0.0%) |
| 18 to 34 Years | 0 (0.0%) | 0 (0.0%) |
| 35 to 64 Years | 0 (0.0%) | 0 (0.0%) |
| 65 to 74 Years | 0 (0.0%) | 0 (0.0%) |
| 75 Years and over | 0 (0.0%) | 0 (0.0%) |
Technology Access in Beatty
Computing Device Access in Beatty
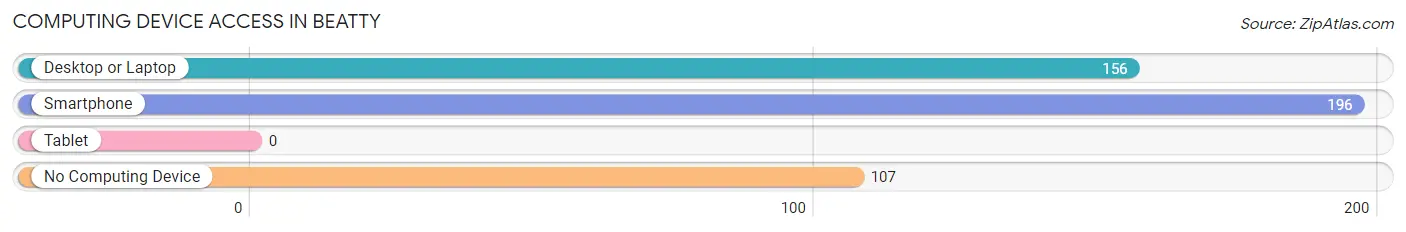
| Device Type | # Households | % Households |
| Desktop or Laptop | 156 | 41.3% |
| Smartphone | 196 | 51.8% |
| Tablet | 0 | 0.0% |
| No Computing Device | 107 | 28.3% |
| Total | 378 | 100.0% |
Internet Access in Beatty
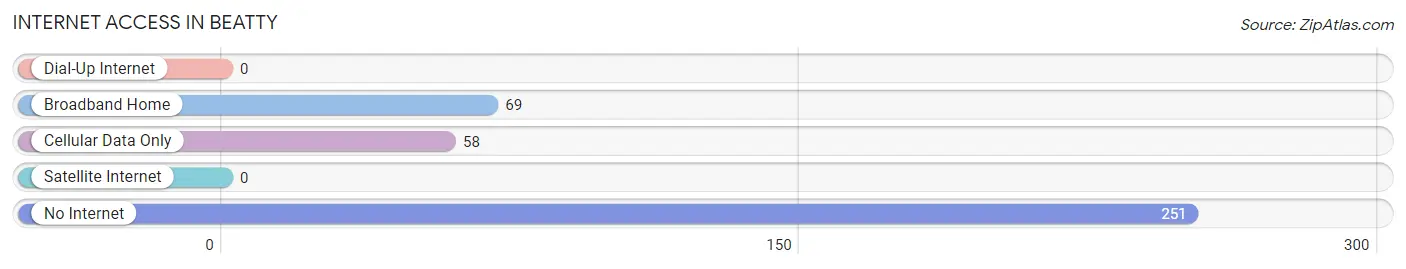
| Internet Type | # Households | % Households |
| Dial-Up Internet | 0 | 0.0% |
| Broadband Home | 69 | 18.2% |
| Cellular Data Only | 58 | 15.3% |
| Satellite Internet | 0 | 0.0% |
| No Internet | 251 | 66.4% |
| Total | 378 | 100.0% |
Beatty Summary
Beatty, Nevada is a small town located in Nye County, Nevada, United States. It is situated in the Amargosa Valley, approximately 120 miles northwest of Las Vegas. The town was founded in 1905 and was named after Montillus “Old Man” Beatty, a local rancher. Beatty is the gateway to Death Valley National Park, and is a popular tourist destination.
Geography
Beatty is located in the Amargosa Valley, a large desert valley in southern Nevada. The valley is bordered by the Amargosa Range to the east and the Nopah Range to the west. The town is situated at an elevation of 2,073 feet (631 m). The climate in Beatty is hot and dry, with temperatures ranging from the mid-90s in the summer to the mid-50s in the winter.
Economy
Beatty’s economy is largely based on tourism. The town is a popular destination for visitors to Death Valley National Park, and is home to several hotels, restaurants, and other tourist attractions. Beatty is also home to a number of mining operations, including gold, silver, and copper mines. The town is also home to a number of small businesses, including a gas station, a grocery store, and a post office.
Demographics
As of the 2010 census, the population of Beatty was 1,040. The racial makeup of the town was 94.2% White, 0.7% African American, 0.7% Native American, 0.7% Asian, 0.2% Pacific Islander, 1.7% from other races, and 2.1% from two or more races. Hispanic or Latino of any race were 5.2% of the population.
The median income for a household in Beatty was $31,250, and the median income for a family was $37,500. The per capita income for the town was $17,845. About 11.2% of families and 14.2% of the population were below the poverty line, including 18.2% of those under age 18 and none of those age 65 or over.
Conclusion
Beatty, Nevada is a small town located in Nye County, Nevada, United States. It is situated in the Amargosa Valley, approximately 120 miles northwest of Las Vegas. The town was founded in 1905 and was named after Montillus “Old Man” Beatty, a local rancher. Beatty is the gateway to Death Valley National Park, and is a popular tourist destination. The town’s economy is largely based on tourism, and it is home to several mining operations as well as a number of small businesses. As of the 2010 census, the population of Beatty was 1,040. The median income for a household in Beatty was $31,250, and the median income for a family was $37,500.
Common Questions
What is Per Capita Income in Beatty?
Per Capita income in Beatty is $24,844.
What is the Median Family Income in Beatty?
Median Family Income in Beatty is $49,007.
What is Income or Wage Gap in Beatty?
Income or Wage Gap in Beatty is 33.4%.
Women in Beatty earn 66.6 cents for every dollar earned by a man.
What is Inequality or Gini Index in Beatty?
Inequality or Gini Index in Beatty is 0.34.
What is the Total Population of Beatty?
Total Population of Beatty is 596.
What is the Total Male Population of Beatty?
Total Male Population of Beatty is 276.
What is the Total Female Population of Beatty?
Total Female Population of Beatty is 320.
What is the Ratio of Males per 100 Females in Beatty?
There are 86.25 Males per 100 Females in Beatty.
What is the Ratio of Females per 100 Males in Beatty?
There are 115.94 Females per 100 Males in Beatty.
What is the Median Population Age in Beatty?
Median Population Age in Beatty is 61.0 Years.
What is the Average Family Size in Beatty
Average Family Size in Beatty is 2.1 People.
What is the Average Household Size in Beatty
Average Household Size in Beatty is 1.6 People.
How Large is the Labor Force in Beatty?
There are 262 People in the Labor Forcein in Beatty.
What is the Percentage of People in the Labor Force in Beatty?
44.0% of People are in the Labor Force in Beatty.