Blodgett Landing, NH Map & Demographics
Blodgett Landing Map
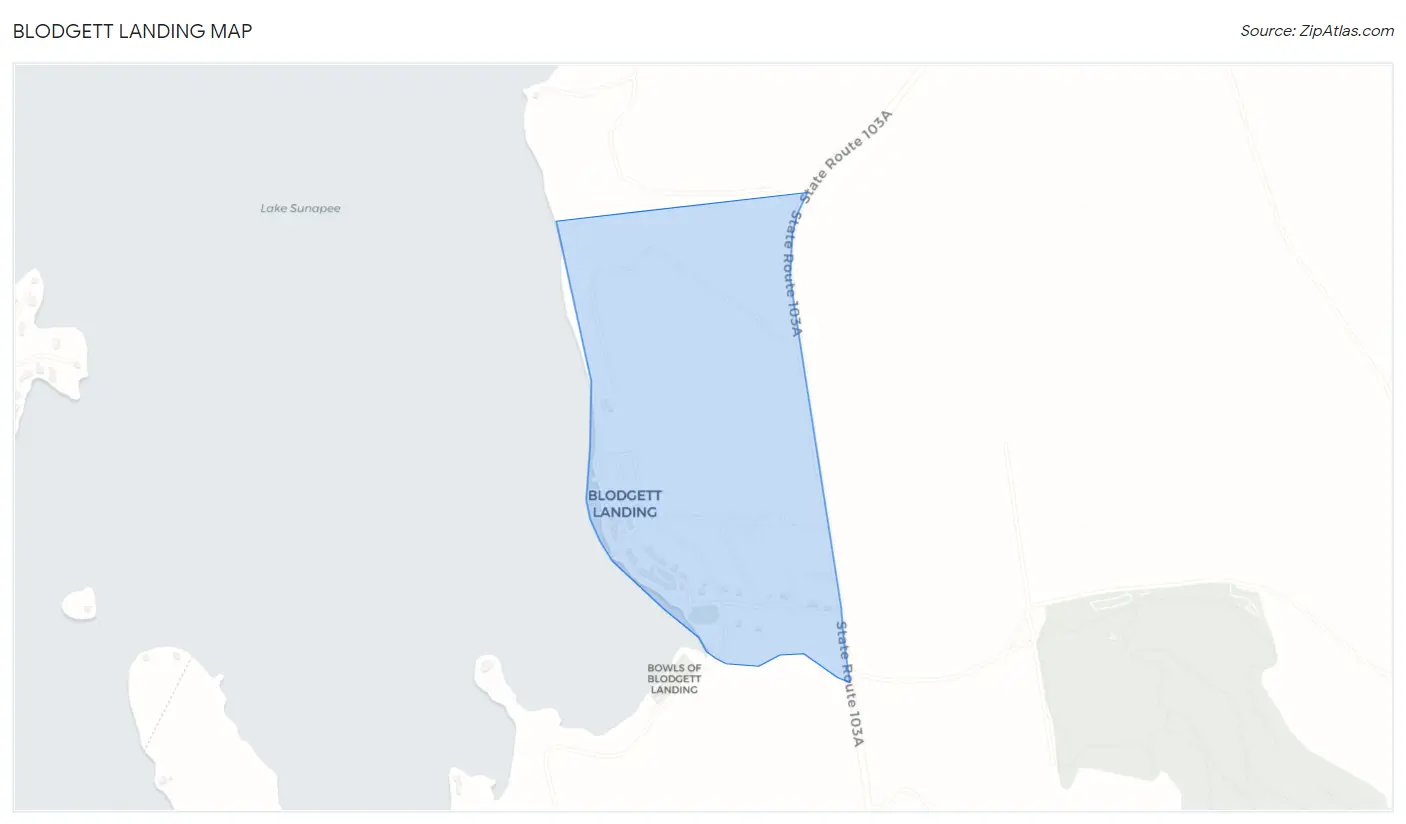
Blodgett Landing Overview
$73,142
PER CAPITA INCOME
0.35
INEQUALITY / GINI INDEX
103
TOTAL POPULATION
44
MALE POPULATION
59
FEMALE POPULATION
74.58
MALES / 100 FEMALES
134.09
FEMALES / 100 MALES
43.0
MEDIAN AGE
3.8
AVG FAMILY SIZE
2.5
AVG HOUSEHOLD SIZE
66
LABOR FORCE [ PEOPLE ]
91.7%
PERCENT IN LABOR FORCE
9.1%
UNEMPLOYMENT RATE
Income in Blodgett Landing
Income Overview in Blodgett Landing
| Characteristic | Number | Measure |
| Per Capita Income | 103 | $73,142 |
| Median Family Income | 20 | $0 |
| Mean Family Income | 20 | $0 |
| Median Household Income | 42 | $0 |
| Mean Household Income | 42 | $181,560 |
| Income Deficit | 20 | $0 |
| Wage / Income Gap (%) | 103 | 0.00% |
| Wage / Income Gap ($) | 103 | 100.00¢ per $1 |
| Gini / Inequality Index | 103 | 0.35 |
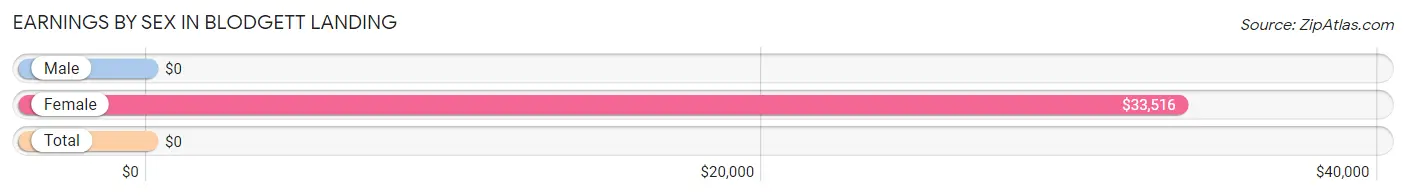
Earnings by Sex in Blodgett Landing
| Sex | Number | Average Earnings |
| Male | 29 (48.3%) | $0 |
| Female | 31 (51.7%) | $33,516 |
| Total | 60 (100.0%) | $0 |
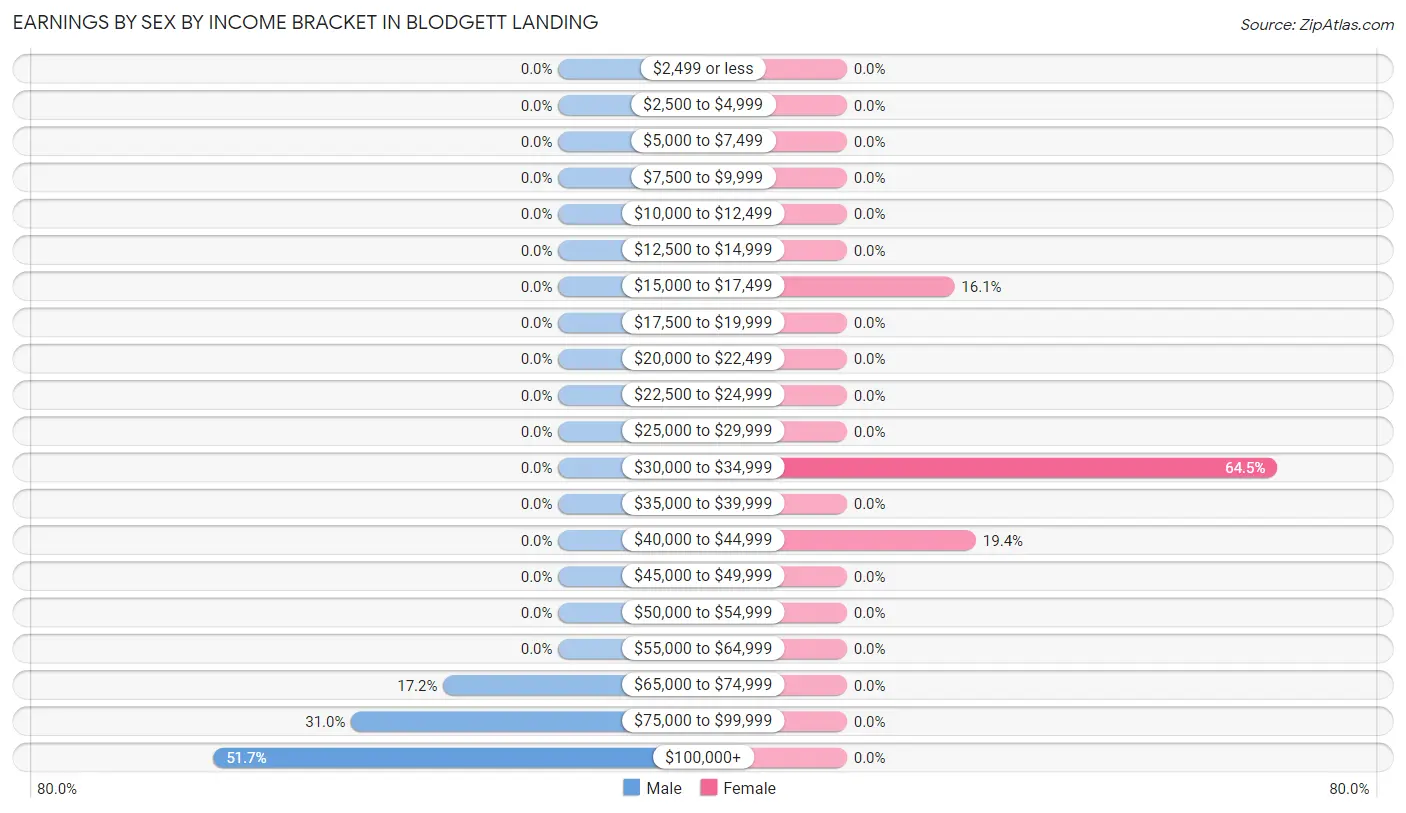
Earnings by Sex by Income Bracket in Blodgett Landing
The most common earnings brackets in Blodgett Landing are $100,000+ for men (15 | 51.7%) and $30,000 to $34,999 for women (20 | 64.5%).
| Income | Male | Female |
| $2,499 or less | 0 (0.0%) | 0 (0.0%) |
| $2,500 to $4,999 | 0 (0.0%) | 0 (0.0%) |
| $5,000 to $7,499 | 0 (0.0%) | 0 (0.0%) |
| $7,500 to $9,999 | 0 (0.0%) | 0 (0.0%) |
| $10,000 to $12,499 | 0 (0.0%) | 0 (0.0%) |
| $12,500 to $14,999 | 0 (0.0%) | 0 (0.0%) |
| $15,000 to $17,499 | 0 (0.0%) | 5 (16.1%) |
| $17,500 to $19,999 | 0 (0.0%) | 0 (0.0%) |
| $20,000 to $22,499 | 0 (0.0%) | 0 (0.0%) |
| $22,500 to $24,999 | 0 (0.0%) | 0 (0.0%) |
| $25,000 to $29,999 | 0 (0.0%) | 0 (0.0%) |
| $30,000 to $34,999 | 0 (0.0%) | 20 (64.5%) |
| $35,000 to $39,999 | 0 (0.0%) | 0 (0.0%) |
| $40,000 to $44,999 | 0 (0.0%) | 6 (19.4%) |
| $45,000 to $49,999 | 0 (0.0%) | 0 (0.0%) |
| $50,000 to $54,999 | 0 (0.0%) | 0 (0.0%) |
| $55,000 to $64,999 | 0 (0.0%) | 0 (0.0%) |
| $65,000 to $74,999 | 5 (17.2%) | 0 (0.0%) |
| $75,000 to $99,999 | 9 (31.0%) | 0 (0.0%) |
| $100,000+ | 15 (51.7%) | 0 (0.0%) |
| Total | 29 (100.0%) | 31 (100.0%) |
Earnings by Sex by Educational Attainment in Blodgett Landing
| Educational Attainment | Male Income | Female Income |
| Less than High School | - | - |
| High School Diploma | - | - |
| College or Associate's Degree | - | - |
| Bachelor's Degree | - | - |
| Graduate Degree | - | - |
| Total | - | - |
Family Income in Blodgett Landing
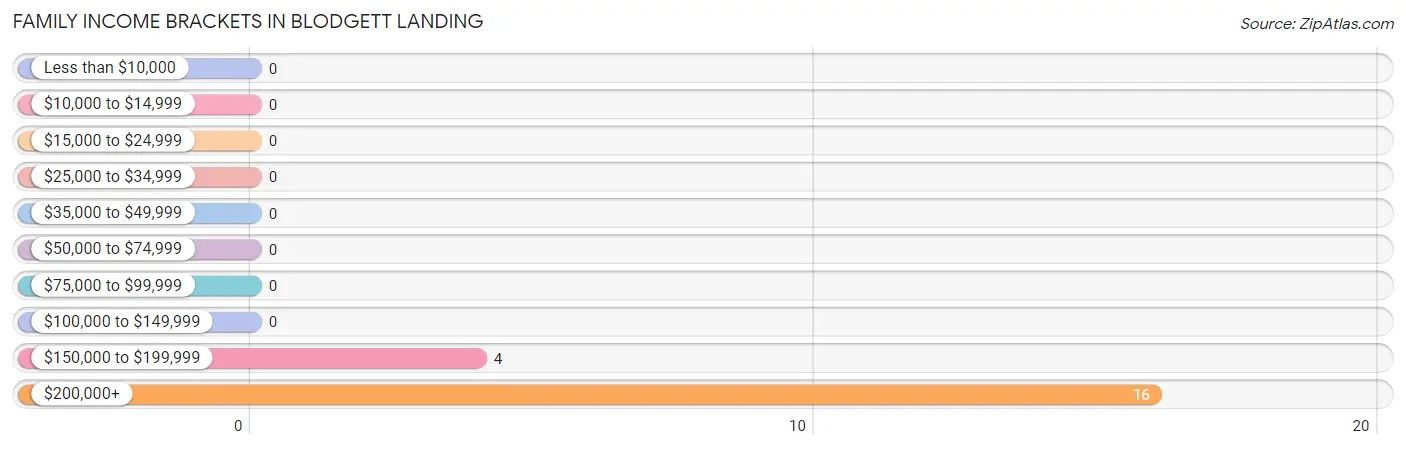
Family Income Brackets in Blodgett Landing
According to the Blodgett Landing family income data, there are 16 families falling into the $200,000+ income range, which is the most common income bracket and makes up 80.0% of all families.
| Income Bracket | # Families | % Families |
| Less than $10,000 | 0 | 0.0% |
| $10,000 to $14,999 | 0 | 0.0% |
| $15,000 to $24,999 | 0 | 0.0% |
| $25,000 to $34,999 | 0 | 0.0% |
| $35,000 to $49,999 | 0 | 0.0% |
| $50,000 to $74,999 | 0 | 0.0% |
| $75,000 to $99,999 | 0 | 0.0% |
| $100,000 to $149,999 | 0 | 0.0% |
| $150,000 to $199,999 | 4 | 20.0% |
| $200,000+ | 16 | 80.0% |
Family Income by Famaliy Size in Blodgett Landing
| Income Bracket | # Families | Median Income |
| 2-Person Families | 0 (0.0%) | $0 |
| 3-Person Families | 4 (20.0%) | $0 |
| 4-Person Families | 16 (80.0%) | $0 |
| 5-Person Families | 0 (0.0%) | $0 |
| 6-Person Families | 0 (0.0%) | $0 |
| 7+ Person Families | 0 (0.0%) | $0 |
| Total | 20 (100.0%) | $0 |
Family Income by Number of Earners in Blodgett Landing
| Number of Earners | # Families | Median Income |
| No Earners | 0 (0.0%) | $0 |
| 1 Earner | 0 (0.0%) | $0 |
| 2 Earners | 16 (80.0%) | $0 |
| 3+ Earners | 4 (20.0%) | $0 |
| Total | 20 (100.0%) | $0 |
Household Income in Blodgett Landing
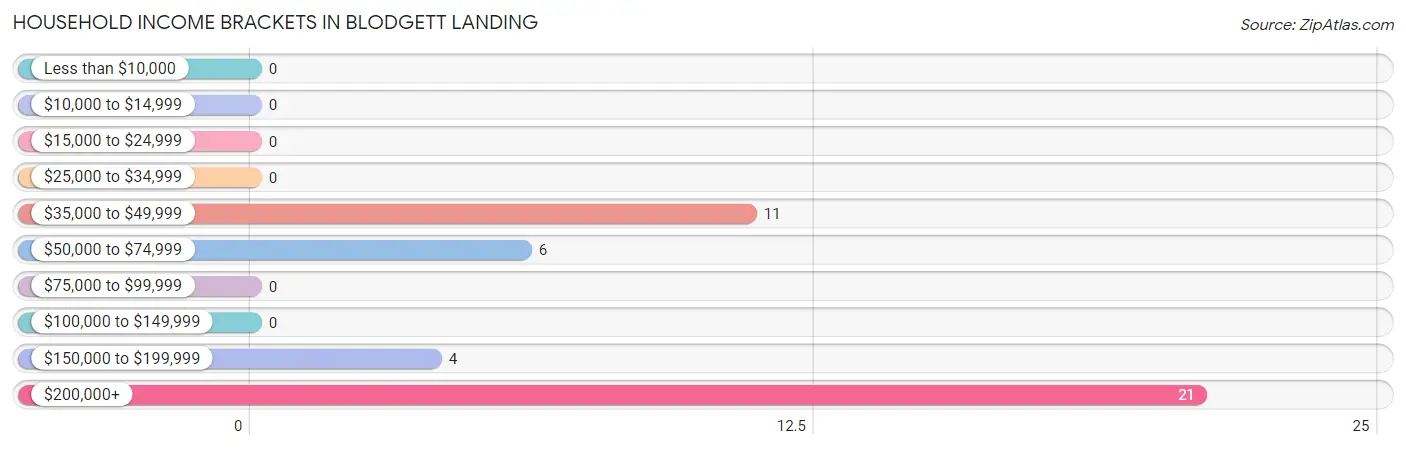
Household Income Brackets in Blodgett Landing
With 21 households falling in the category, the $200,000+ income range is the most frequent in Blodgett Landing, accounting for 50.0% of all households.
| Income Bracket | # Households | % Households |
| Less than $10,000 | 0 | 0.0% |
| $10,000 to $14,999 | 0 | 0.0% |
| $15,000 to $24,999 | 0 | 0.0% |
| $25,000 to $34,999 | 0 | 0.0% |
| $35,000 to $49,999 | 11 | 26.2% |
| $50,000 to $74,999 | 6 | 14.3% |
| $75,000 to $99,999 | 0 | 0.0% |
| $100,000 to $149,999 | 0 | 0.0% |
| $150,000 to $199,999 | 4 | 9.5% |
| $200,000+ | 21 | 50.0% |
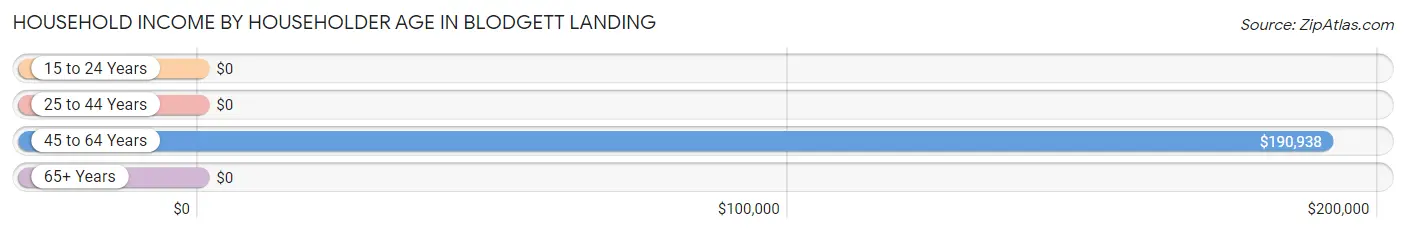
Household Income by Householder Age in Blodgett Landing
The median household income in Blodgett Landing is $0, with the highest median household income of $190,938 found in the 45 to 64 years age bracket for the primary householder. A total of 15 households (35.7%) fall into this category.
| Income Bracket | # Households | Median Income |
| 15 to 24 Years | 0 (0.0%) | $0 |
| 25 to 44 Years | 16 (38.1%) | $0 |
| 45 to 64 Years | 15 (35.7%) | $190,938 |
| 65+ Years | 11 (26.2%) | $0 |
| Total | 42 (100.0%) | $0 |
Poverty in Blodgett Landing
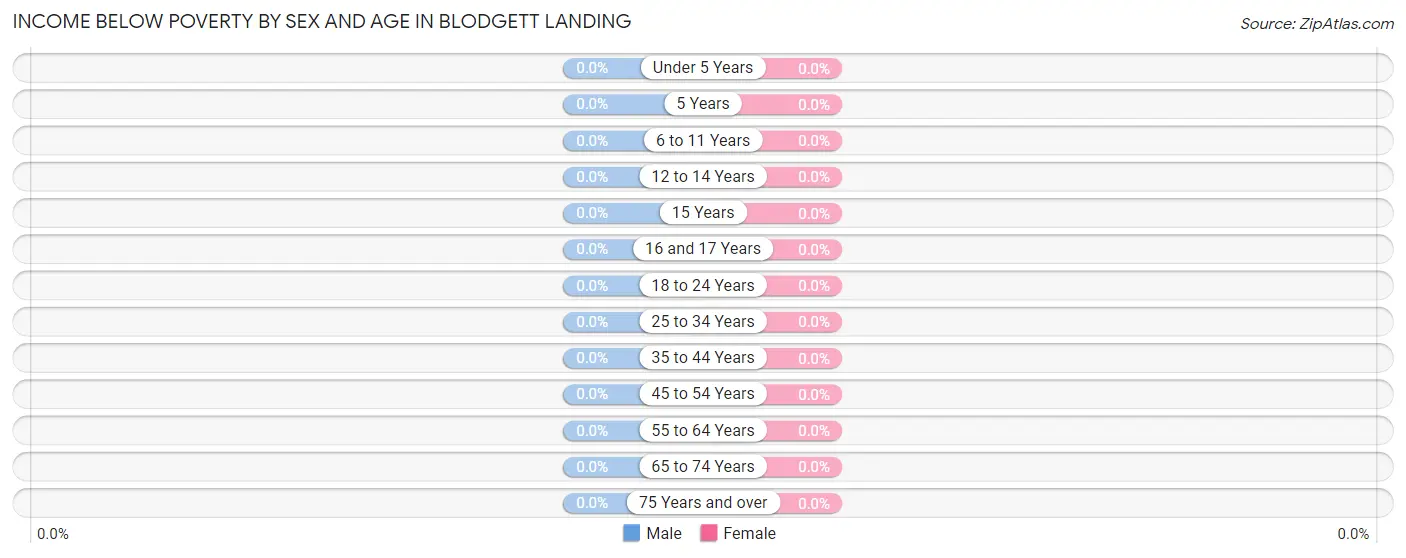
Income Below Poverty by Sex and Age in Blodgett Landing
| Age Bracket | Male | Female |
| Under 5 Years | 0 (0.0%) | 0 (0.0%) |
| 5 Years | 0 (0.0%) | 0 (0.0%) |
| 6 to 11 Years | 0 (0.0%) | 0 (0.0%) |
| 12 to 14 Years | 0 (0.0%) | 0 (0.0%) |
| 15 Years | 0 (0.0%) | 0 (0.0%) |
| 16 and 17 Years | 0 (0.0%) | 0 (0.0%) |
| 18 to 24 Years | 0 (0.0%) | 0 (0.0%) |
| 25 to 34 Years | 0 (0.0%) | 0 (0.0%) |
| 35 to 44 Years | 0 (0.0%) | 0 (0.0%) |
| 45 to 54 Years | 0 (0.0%) | 0 (0.0%) |
| 55 to 64 Years | 0 (0.0%) | 0 (0.0%) |
| 65 to 74 Years | 0 (0.0%) | 0 (0.0%) |
| 75 Years and over | 0 (0.0%) | 0 (0.0%) |
| Total | 0 (0.0%) | 0 (0.0%) |
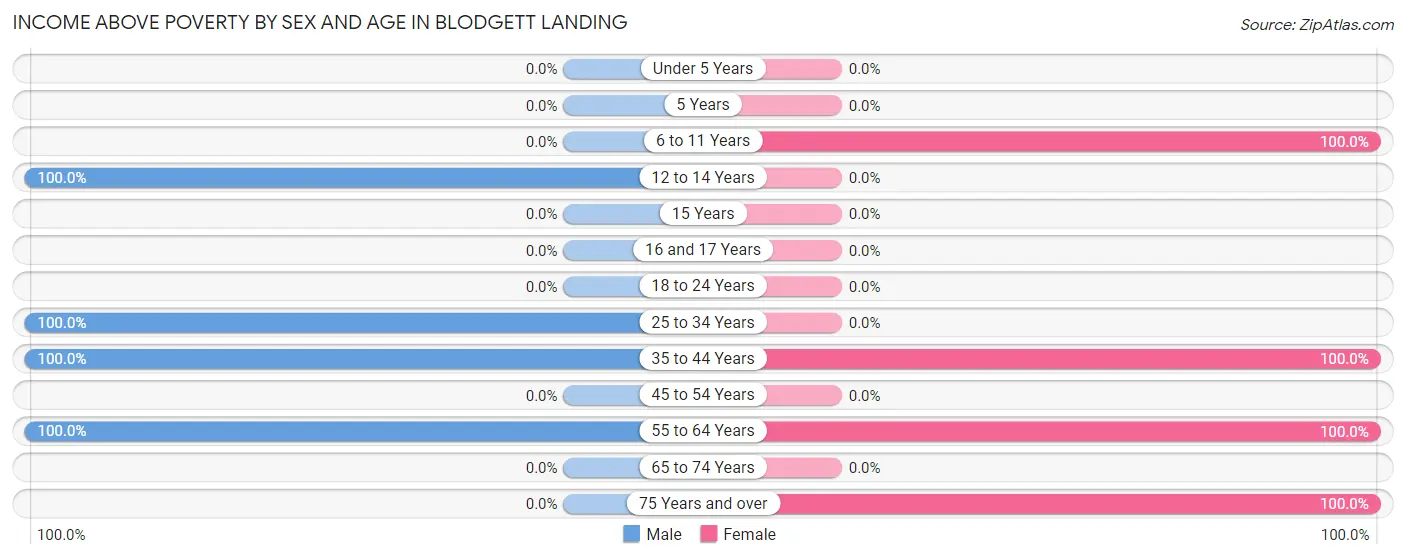
Income Above Poverty by Sex and Age in Blodgett Landing
According to the poverty statistics in Blodgett Landing, males aged 12 to 14 years and females aged 6 to 11 years are the age groups that are most secure financially, with 100.0% of males and 100.0% of females in these age groups living above the poverty line.
| Age Bracket | Male | Female |
| Under 5 Years | 0 (0.0%) | 0 (0.0%) |
| 5 Years | 0 (0.0%) | 0 (0.0%) |
| 6 to 11 Years | 0 (0.0%) | 16 (100.0%) |
| 12 to 14 Years | 15 (100.0%) | 0 (0.0%) |
| 15 Years | 0 (0.0%) | 0 (0.0%) |
| 16 and 17 Years | 0 (0.0%) | 0 (0.0%) |
| 18 to 24 Years | 0 (0.0%) | 0 (0.0%) |
| 25 to 34 Years | 5 (100.0%) | 0 (0.0%) |
| 35 to 44 Years | 15 (100.0%) | 16 (100.0%) |
| 45 to 54 Years | 0 (0.0%) | 0 (0.0%) |
| 55 to 64 Years | 9 (100.0%) | 16 (100.0%) |
| 65 to 74 Years | 0 (0.0%) | 0 (0.0%) |
| 75 Years and over | 0 (0.0%) | 11 (100.0%) |
| Total | 44 (100.0%) | 59 (100.0%) |
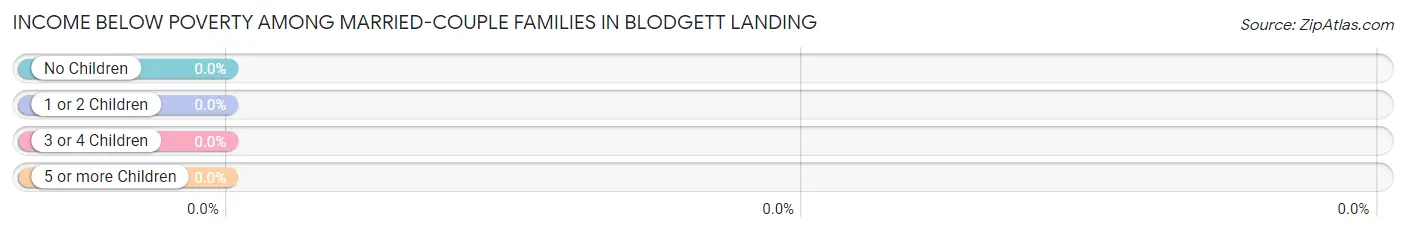
Income Below Poverty Among Married-Couple Families in Blodgett Landing
| Children | Above Poverty | Below Poverty |
| No Children | 4 (100.0%) | 0 (0.0%) |
| 1 or 2 Children | 16 (100.0%) | 0 (0.0%) |
| 3 or 4 Children | 0 (0.0%) | 0 (0.0%) |
| 5 or more Children | 0 (0.0%) | 0 (0.0%) |
| Total | 20 (100.0%) | 0 (0.0%) |
Income Below Poverty Among Single-Parent Households in Blodgett Landing
| Children | Single Father | Single Mother |
| No Children | 0 (0.0%) | 0 (0.0%) |
| 1 or 2 Children | 0 (0.0%) | 0 (0.0%) |
| 3 or 4 Children | 0 (0.0%) | 0 (0.0%) |
| 5 or more Children | 0 (0.0%) | 0 (0.0%) |
| Total | 0 (0.0%) | 0 (0.0%) |
Income Below Poverty Among Married-Couple vs Single-Parent Households in Blodgett Landing
| Children | Married-Couple Families | Single-Parent Households |
| No Children | 0 (0.0%) | 0 (0.0%) |
| 1 or 2 Children | 0 (0.0%) | 0 (0.0%) |
| 3 or 4 Children | 0 (0.0%) | 0 (0.0%) |
| 5 or more Children | 0 (0.0%) | 0 (0.0%) |
| Total | 0 (0.0%) | 0 (0.0%) |
Race in Blodgett Landing
The most populous races in Blodgett Landing are , and White / Caucasian (103 | 100.0%).
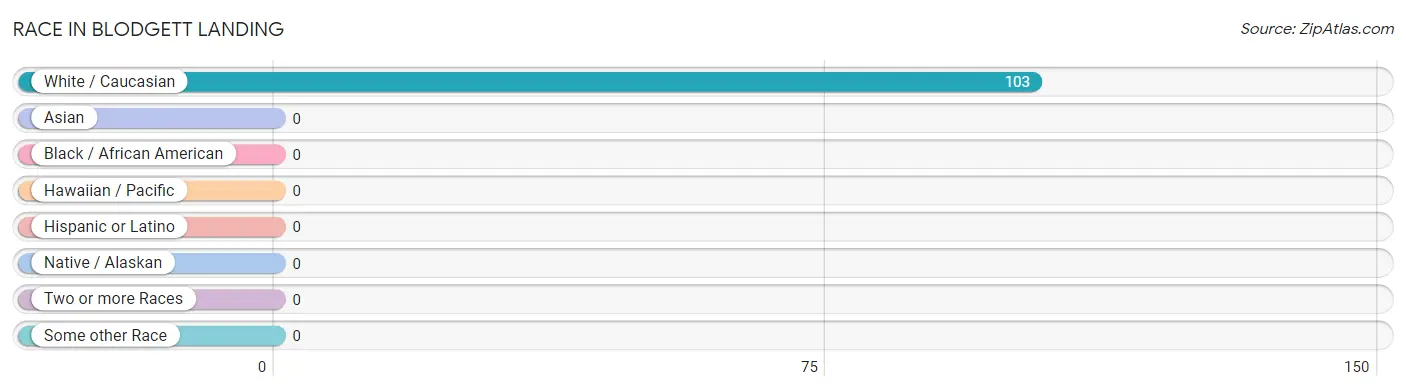
| Race | # Population | % Population |
| Asian | 0 | 0.0% |
| Black / African American | 0 | 0.0% |
| Hawaiian / Pacific | 0 | 0.0% |
| Hispanic or Latino | 0 | 0.0% |
| Native / Alaskan | 0 | 0.0% |
| White / Caucasian | 103 | 100.0% |
| Two or more Races | 0 | 0.0% |
| Some other Race | 0 | 0.0% |
| Total | 103 | 100.0% |
Ancestry in Blodgett Landing
The most populous ancestries reported in Blodgett Landing are English (31 | 30.1%), European (31 | 30.1%), Irish (27 | 26.2%), Slovene (15 | 14.6%), and German (11 | 10.7%), together accounting for 111.7% of all Blodgett Landing residents.
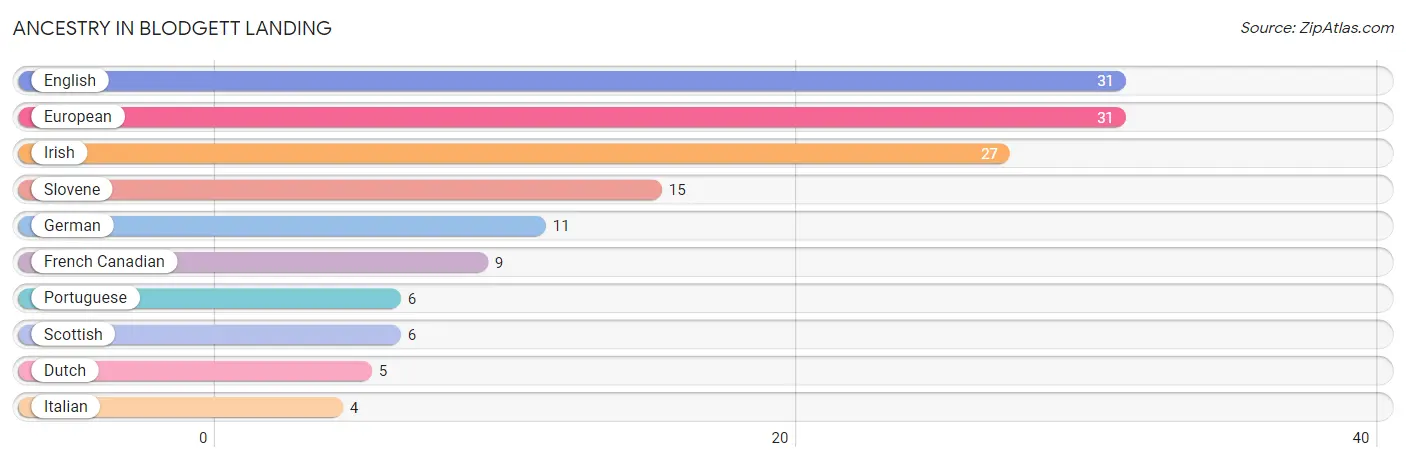
| Ancestry | # Population | % Population |
| Dutch | 5 | 4.9% |
| English | 31 | 30.1% |
| European | 31 | 30.1% |
| French Canadian | 9 | 8.7% |
| German | 11 | 10.7% |
| Irish | 27 | 26.2% |
| Italian | 4 | 3.9% |
| Portuguese | 6 | 5.8% |
| Scottish | 6 | 5.8% |
| Slovene | 15 | 14.6% | View All 10 Rows |
Immigrants in Blodgett Landing

| Immigration Origin | # Population | % Population | View All 0 Rows |
Sex and Age in Blodgett Landing
Sex and Age in Blodgett Landing
The most populous age groups in Blodgett Landing are 10 to 14 Years (15 | 34.1%) for men and 5 to 9 Years (16 | 27.1%) for women.
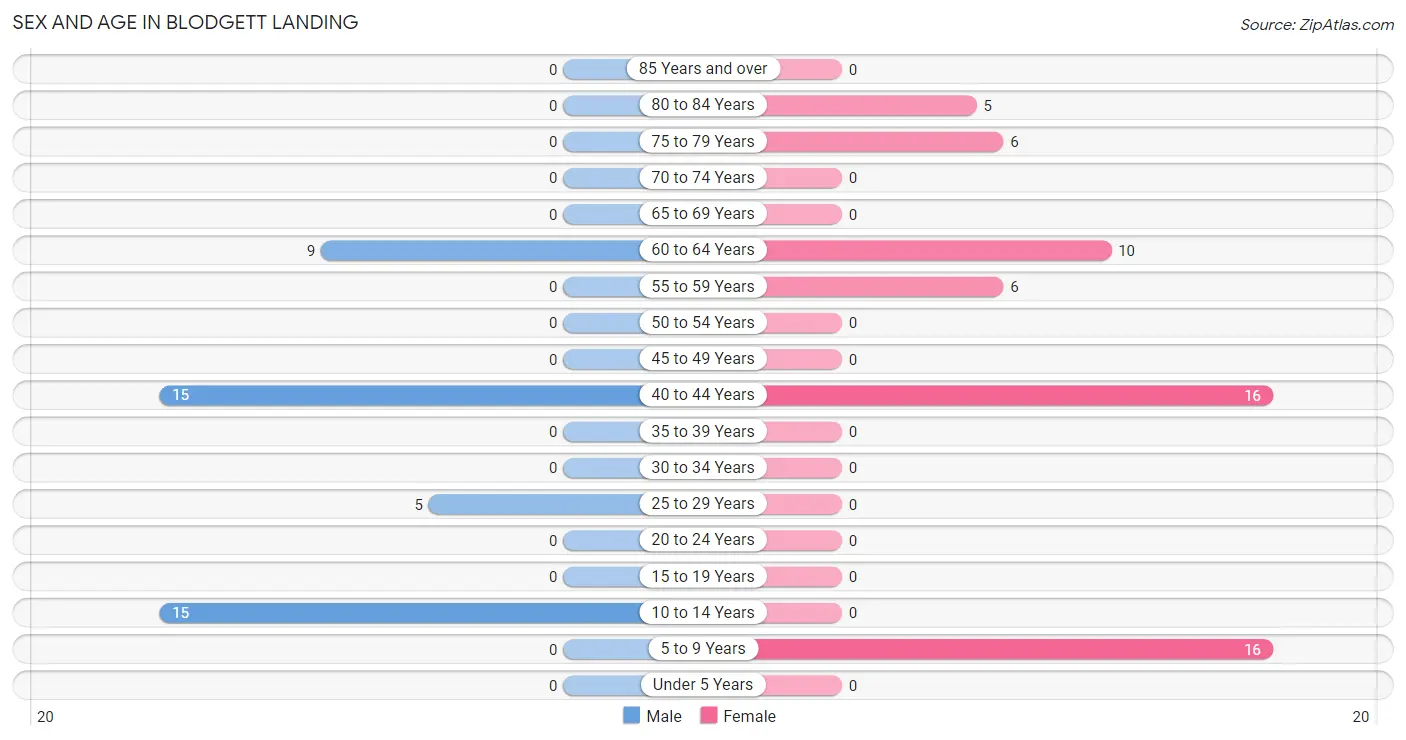
| Age Bracket | Male | Female |
| Under 5 Years | 0 (0.0%) | 0 (0.0%) |
| 5 to 9 Years | 0 (0.0%) | 16 (27.1%) |
| 10 to 14 Years | 15 (34.1%) | 0 (0.0%) |
| 15 to 19 Years | 0 (0.0%) | 0 (0.0%) |
| 20 to 24 Years | 0 (0.0%) | 0 (0.0%) |
| 25 to 29 Years | 5 (11.4%) | 0 (0.0%) |
| 30 to 34 Years | 0 (0.0%) | 0 (0.0%) |
| 35 to 39 Years | 0 (0.0%) | 0 (0.0%) |
| 40 to 44 Years | 15 (34.1%) | 16 (27.1%) |
| 45 to 49 Years | 0 (0.0%) | 0 (0.0%) |
| 50 to 54 Years | 0 (0.0%) | 0 (0.0%) |
| 55 to 59 Years | 0 (0.0%) | 6 (10.2%) |
| 60 to 64 Years | 9 (20.4%) | 10 (17.0%) |
| 65 to 69 Years | 0 (0.0%) | 0 (0.0%) |
| 70 to 74 Years | 0 (0.0%) | 0 (0.0%) |
| 75 to 79 Years | 0 (0.0%) | 6 (10.2%) |
| 80 to 84 Years | 0 (0.0%) | 5 (8.5%) |
| 85 Years and over | 0 (0.0%) | 0 (0.0%) |
| Total | 44 (100.0%) | 59 (100.0%) |
Families and Households in Blodgett Landing
Median Family Size in Blodgett Landing
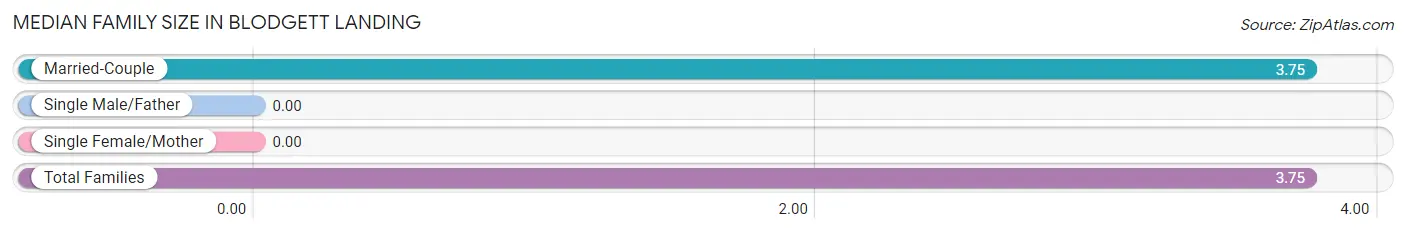
| Family Type | # Families | Family Size |
| Married-Couple | 20 (100.0%) | 3.75 |
| Single Male/Father | 0 (0.0%) | - |
| Single Female/Mother | 0 (0.0%) | - |
| Total Families | 20 (100.0%) | 3.75 |
Median Household Size in Blodgett Landing
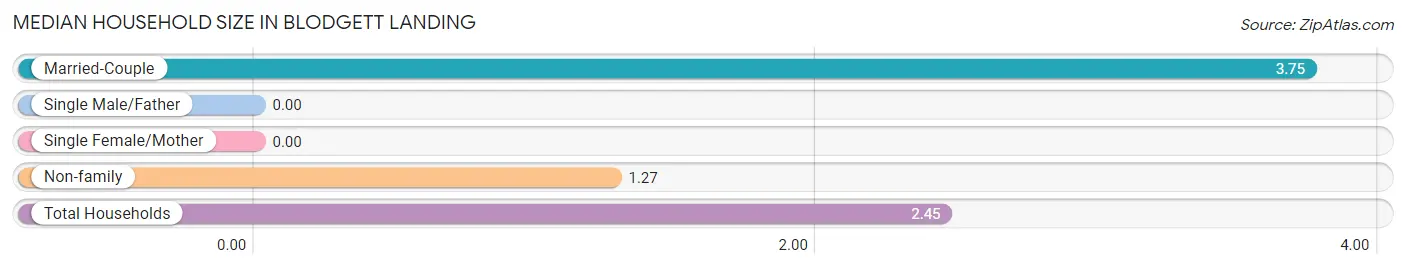
| Household Type | # Households | Household Size |
| Married-Couple | 20 (47.6%) | 3.75 |
| Single Male/Father | 0 (0.0%) | - |
| Single Female/Mother | 0 (0.0%) | - |
| Non-family | 22 (52.4%) | 1.27 |
| Total Households | 42 (100.0%) | 2.45 |
Household Size by Marriage Status in Blodgett Landing
Out of a total of 42 households in Blodgett Landing, 20 (47.6%) are family households, while 22 (52.4%) are nonfamily households. The most numerous type of family households are 4-person households, comprising 16, and the most common type of nonfamily households are 1-person households, comprising 17.
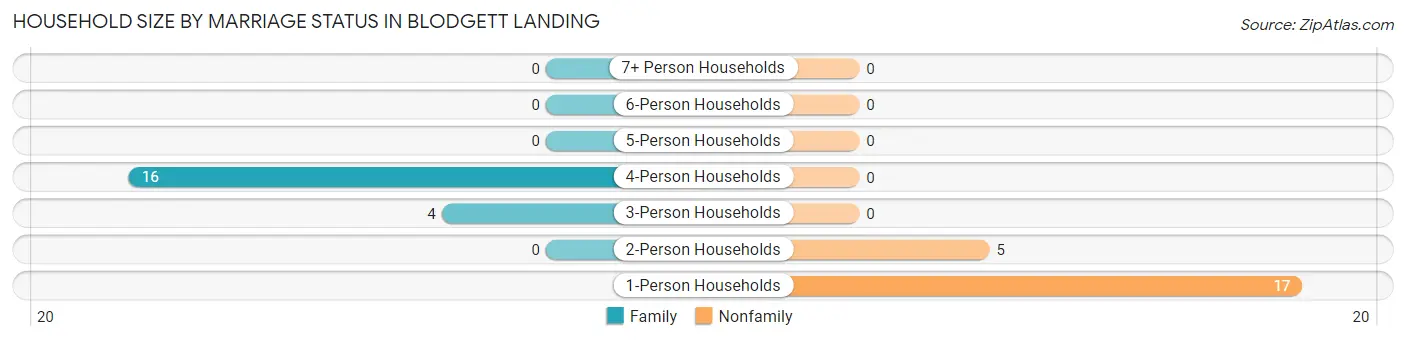
| Household Size | Family Households | Nonfamily Households |
| 1-Person Households | - | 17 (40.5%) |
| 2-Person Households | 0 (0.0%) | 5 (11.9%) |
| 3-Person Households | 4 (9.5%) | 0 (0.0%) |
| 4-Person Households | 16 (38.1%) | 0 (0.0%) |
| 5-Person Households | 0 (0.0%) | 0 (0.0%) |
| 6-Person Households | 0 (0.0%) | 0 (0.0%) |
| 7+ Person Households | 0 (0.0%) | 0 (0.0%) |
| Total | 20 (47.6%) | 22 (52.4%) |
Female Fertility in Blodgett Landing
Fertility by Age in Blodgett Landing
| Age Bracket | Women with Births | Births / 1,000 Women |
| 15 to 19 years | 0 (0.0%) | 0.0 |
| 20 to 34 years | 0 (0.0%) | 0.0 |
| 35 to 50 years | 0 (0.0%) | 0.0 |
| Total | 0 (0.0%) | 0.0 |
Fertility by Age by Marriage Status in Blodgett Landing
| Age Bracket | Married | Unmarried |
| 15 to 19 years | 0 (0.0%) | 0 (0.0%) |
| 20 to 34 years | 0 (0.0%) | 0 (0.0%) |
| 35 to 50 years | 0 (0.0%) | 0 (0.0%) |
| Total | 0 (0.0%) | 0 (0.0%) |
Fertility by Education in Blodgett Landing
| Educational Attainment | Women with Births | Births / 1,000 Women |
| Less than High School | 0 (0.0%) | 0.0 |
| High School Diploma | 0 (0.0%) | 0.0 |
| College or Associate's Degree | 0 (0.0%) | 0.0 |
| Bachelor's Degree | 0 (0.0%) | 0.0 |
| Graduate Degree | 0 (0.0%) | 0.0 |
| Total | 0 (0.0%) | 0.0 |
Fertility by Education by Marriage Status in Blodgett Landing
| Educational Attainment | Married | Unmarried |
| Less than High School | 0 (0.0%) | 0 (0.0%) |
| High School Diploma | 0 (0.0%) | 0 (0.0%) |
| College or Associate's Degree | 0 (0.0%) | 0 (0.0%) |
| Bachelor's Degree | 0 (0.0%) | 0 (0.0%) |
| Graduate Degree | 0 (0.0%) | 0 (0.0%) |
| Total | 0 (0.0%) | 0 (0.0%) |
Employment Characteristics in Blodgett Landing
Employment by Class of Employer in Blodgett Landing
Among the 60 employed individuals in Blodgett Landing, private company employees (30 | 50.0%), not-for-profit organizations (21 | 35.0%), and self-employed (not incorporated) (5 | 8.3%) make up the most common classes of employment.
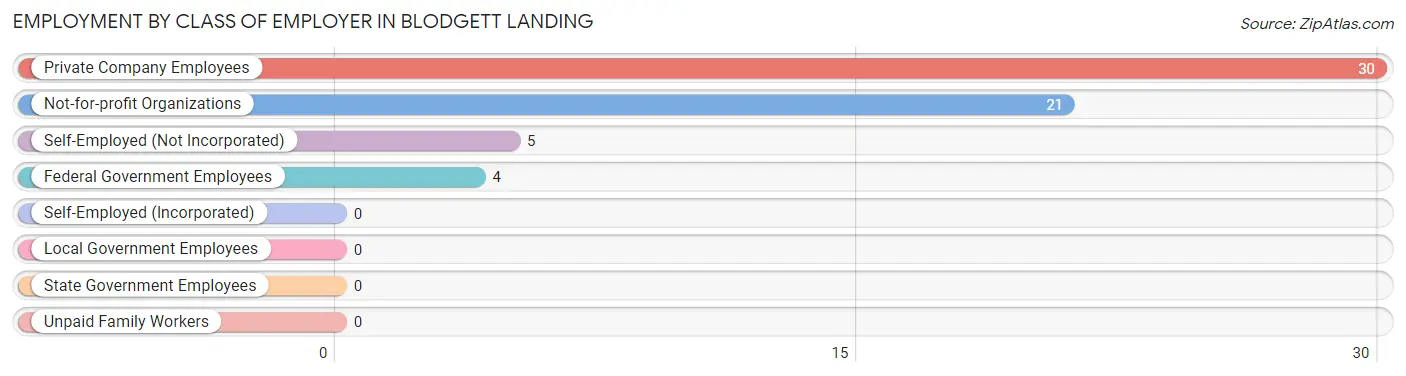
| Employer Class | # Employees | % Employees |
| Private Company Employees | 30 | 50.0% |
| Self-Employed (Incorporated) | 0 | 0.0% |
| Self-Employed (Not Incorporated) | 5 | 8.3% |
| Not-for-profit Organizations | 21 | 35.0% |
| Local Government Employees | 0 | 0.0% |
| State Government Employees | 0 | 0.0% |
| Federal Government Employees | 4 | 6.7% |
| Unpaid Family Workers | 0 | 0.0% |
| Total | 60 | 100.0% |
Employment Status by Age in Blodgett Landing
According to the labor force statistics for Blodgett Landing, out of the total population over 16 years of age (72), 91.7% or 66 individuals are in the labor force, with 9.1% or 6 of them unemployed. The age group with the highest labor force participation rate is 25 to 29 years, with 100.0% or 5 individuals in the labor force. Within the labor force, the 55 to 59 years age range has the highest percentage of unemployed individuals, with 100.0% or 6 of them being unemployed.
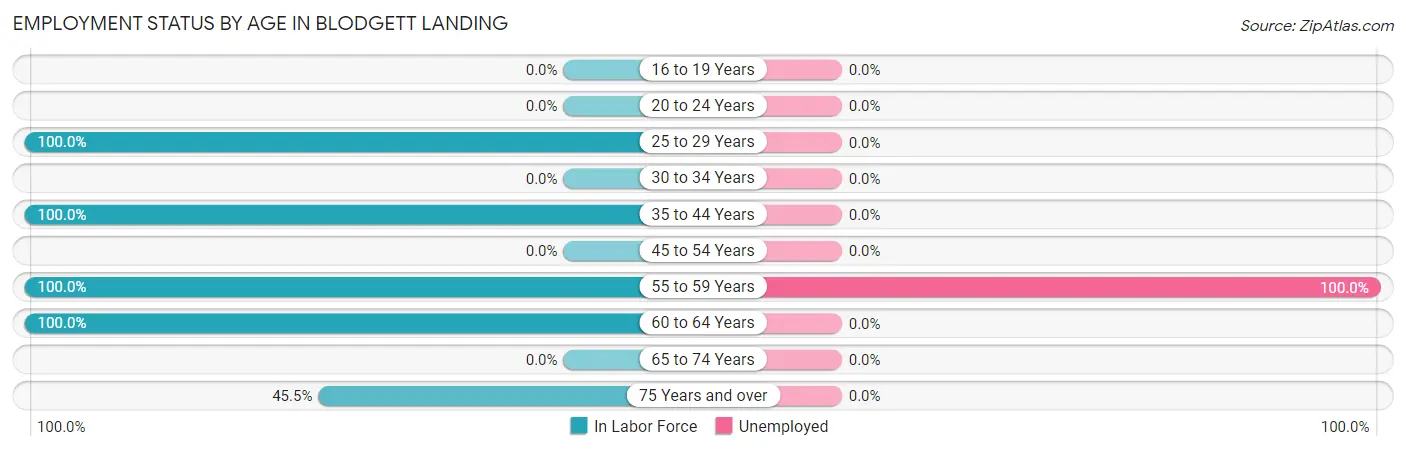
| Age Bracket | In Labor Force | Unemployed |
| 16 to 19 Years | 0 (0.0%) | 0 (0.0%) |
| 20 to 24 Years | 0 (0.0%) | 0 (0.0%) |
| 25 to 29 Years | 5 (100.0%) | 0 (0.0%) |
| 30 to 34 Years | 0 (0.0%) | 0 (0.0%) |
| 35 to 44 Years | 31 (100.0%) | 0 (0.0%) |
| 45 to 54 Years | 0 (0.0%) | 0 (0.0%) |
| 55 to 59 Years | 6 (100.0%) | 6 (100.0%) |
| 60 to 64 Years | 19 (100.0%) | 0 (0.0%) |
| 65 to 74 Years | 0 (0.0%) | 0 (0.0%) |
| 75 Years and over | 5 (45.5%) | 0 (0.0%) |
| Total | 66 (91.7%) | 6 (9.1%) |
Employment Status by Educational Attainment in Blodgett Landing
According to labor force statistics for Blodgett Landing, 100.0% of individuals (61) out of the total population between 25 and 64 years of age (61) are in the labor force, with 9.8% or 6 of them being unemployed. The group with the highest labor force participation rate are those with the educational attainment of high school diploma, with 100.0% or 6 individuals in the labor force. Within the labor force, individuals with bachelor's degree or higher education have the highest percentage of unemployment, with 12.0% or 6 of them being unemployed.
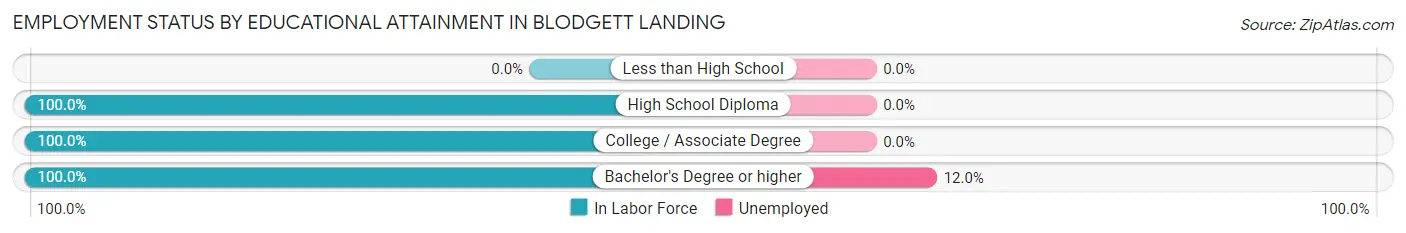
| Educational Attainment | In Labor Force | Unemployed |
| Less than High School | 0 (0.0%) | 0 (0.0%) |
| High School Diploma | 6 (100.0%) | 0 (0.0%) |
| College / Associate Degree | 5 (100.0%) | 0 (0.0%) |
| Bachelor's Degree or higher | 50 (100.0%) | 6 (12.0%) |
| Total | 61 (100.0%) | 6 (9.8%) |
Employment Occupations by Sex in Blodgett Landing
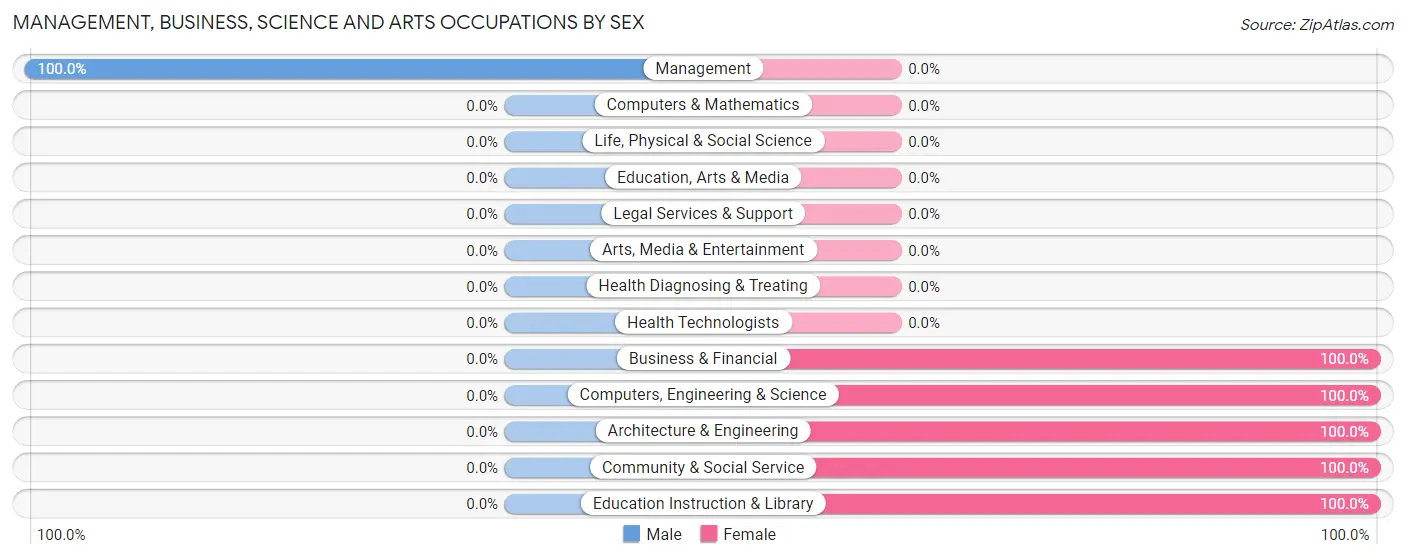
Management, Business, Science and Arts Occupations
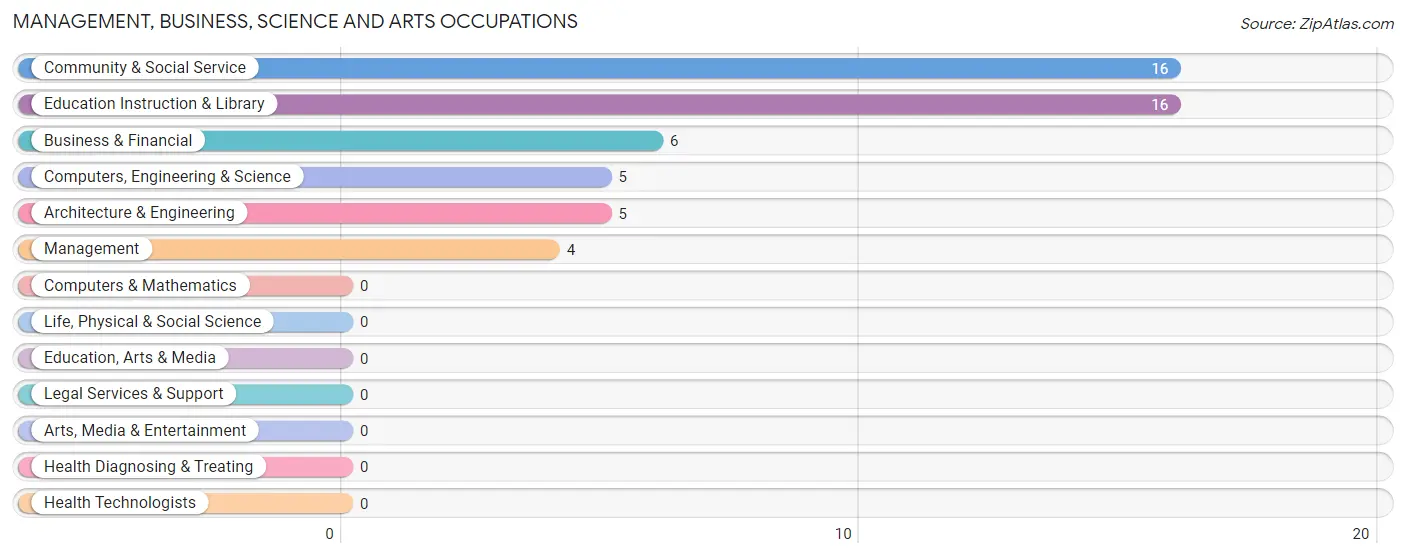
The most common Management, Business, Science and Arts occupations in Blodgett Landing are Community & Social Service (16 | 26.7%), Education Instruction & Library (16 | 26.7%), Business & Financial (6 | 10.0%), Computers, Engineering & Science (5 | 8.3%), and Architecture & Engineering (5 | 8.3%).
Management, Business, Science and Arts Occupations by Sex
| Occupation | Male | Female |
| Management | 4 (100.0%) | 0 (0.0%) |
| Business & Financial | 0 (0.0%) | 6 (100.0%) |
| Computers, Engineering & Science | 0 (0.0%) | 5 (100.0%) |
| Computers & Mathematics | 0 (0.0%) | 0 (0.0%) |
| Architecture & Engineering | 0 (0.0%) | 5 (100.0%) |
| Life, Physical & Social Science | 0 (0.0%) | 0 (0.0%) |
| Community & Social Service | 0 (0.0%) | 16 (100.0%) |
| Education, Arts & Media | 0 (0.0%) | 0 (0.0%) |
| Legal Services & Support | 0 (0.0%) | 0 (0.0%) |
| Education Instruction & Library | 0 (0.0%) | 16 (100.0%) |
| Arts, Media & Entertainment | 0 (0.0%) | 0 (0.0%) |
| Health Diagnosing & Treating | 0 (0.0%) | 0 (0.0%) |
| Health Technologists | 0 (0.0%) | 0 (0.0%) |
| Total (Category) | 4 (12.9%) | 27 (87.1%) |
| Total (Overall) | 29 (48.3%) | 31 (51.7%) |
Services Occupations
The most common Services occupations in Blodgett Landing are , and Food Preparation & Serving (5 | 8.3%).
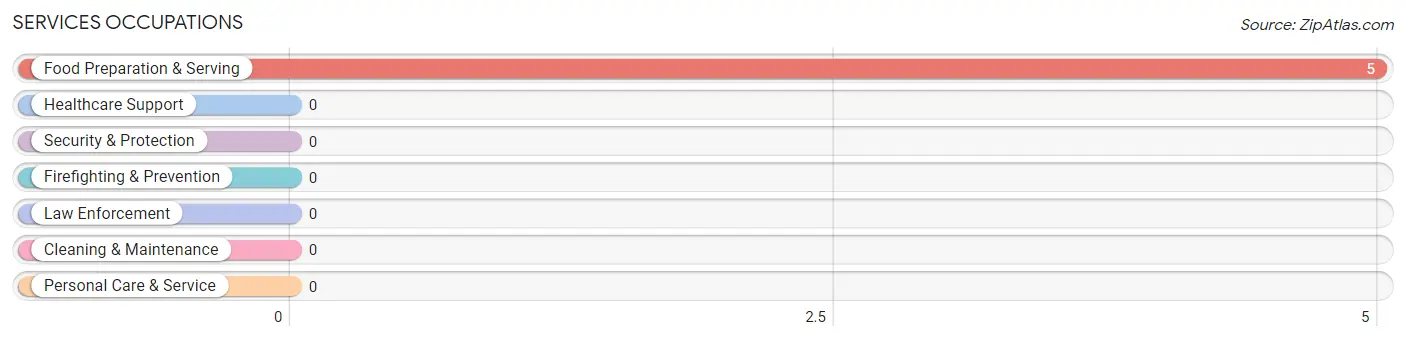
Services Occupations by Sex
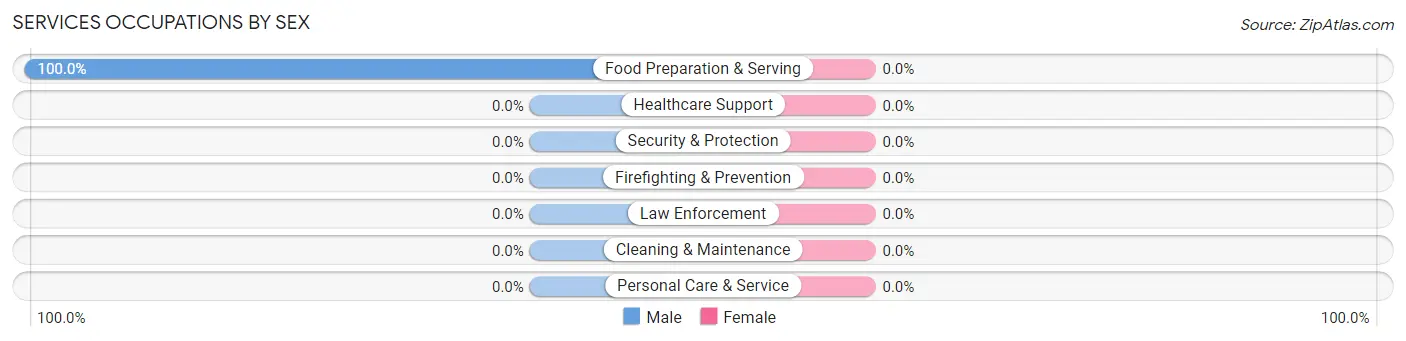
| Occupation | Male | Female |
| Healthcare Support | 0 (0.0%) | 0 (0.0%) |
| Security & Protection | 0 (0.0%) | 0 (0.0%) |
| Firefighting & Prevention | 0 (0.0%) | 0 (0.0%) |
| Law Enforcement | 0 (0.0%) | 0 (0.0%) |
| Food Preparation & Serving | 5 (100.0%) | 0 (0.0%) |
| Cleaning & Maintenance | 0 (0.0%) | 0 (0.0%) |
| Personal Care & Service | 0 (0.0%) | 0 (0.0%) |
| Total (Category) | 5 (100.0%) | 0 (0.0%) |
| Total (Overall) | 29 (48.3%) | 31 (51.7%) |
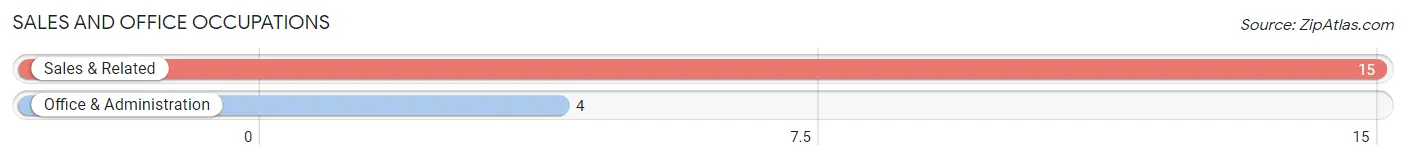
Sales and Office Occupations
The most common Sales and Office occupations in Blodgett Landing are Sales & Related (15 | 25.0%), and Office & Administration (4 | 6.7%).
Sales and Office Occupations by Sex
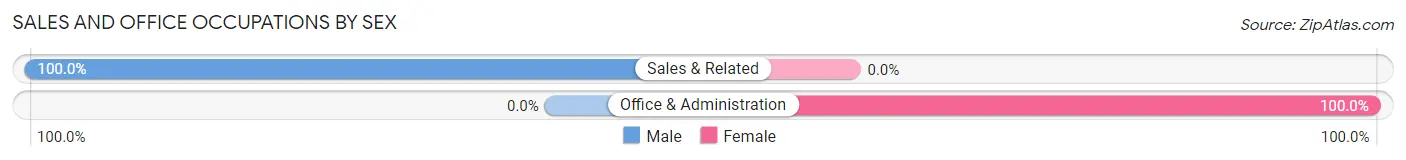
| Occupation | Male | Female |
| Sales & Related | 15 (100.0%) | 0 (0.0%) |
| Office & Administration | 0 (0.0%) | 4 (100.0%) |
| Total (Category) | 15 (78.9%) | 4 (21.0%) |
| Total (Overall) | 29 (48.3%) | 31 (51.7%) |
Natural Resources, Construction and Maintenance Occupations
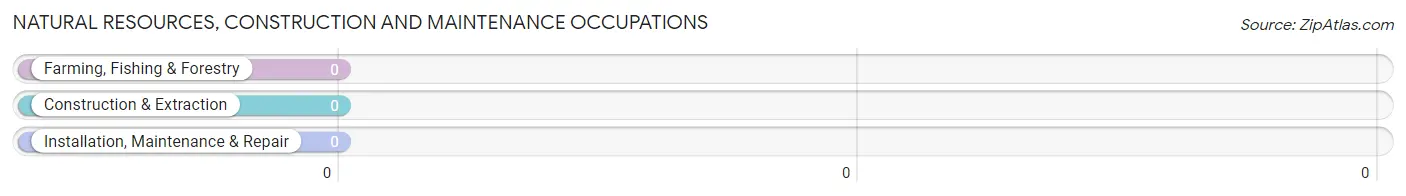
Natural Resources, Construction and Maintenance Occupations by Sex
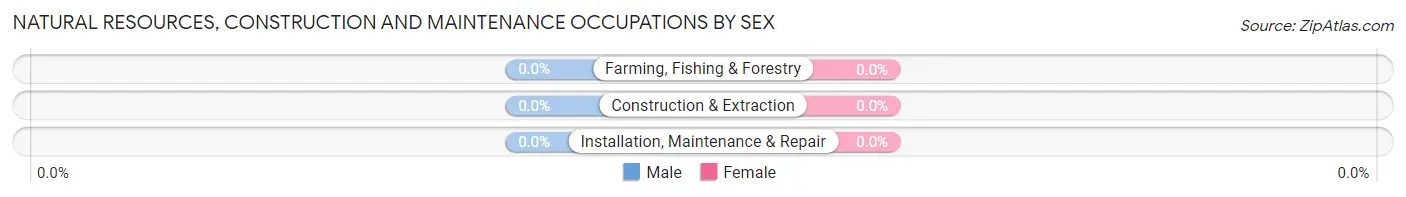
| Occupation | Male | Female |
| Farming, Fishing & Forestry | 0 (0.0%) | 0 (0.0%) |
| Construction & Extraction | 0 (0.0%) | 0 (0.0%) |
| Installation, Maintenance & Repair | 0 (0.0%) | 0 (0.0%) |
| Total (Category) | 0 (0.0%) | 0 (0.0%) |
| Total (Overall) | 29 (48.3%) | 31 (51.7%) |
Production, Transportation and Moving Occupations
The most common Production, Transportation and Moving occupations in Blodgett Landing are , and Material Moving (5 | 8.3%).
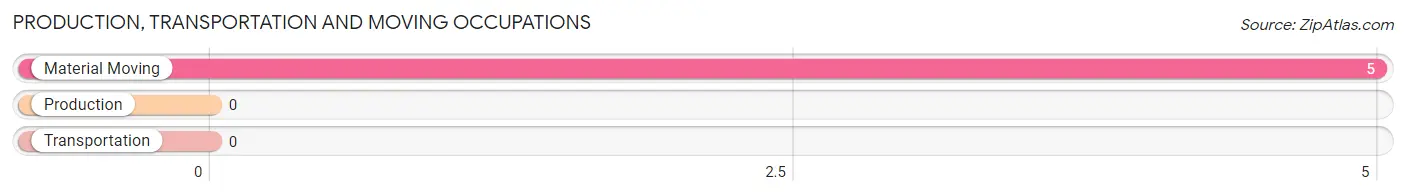
Production, Transportation and Moving Occupations by Sex
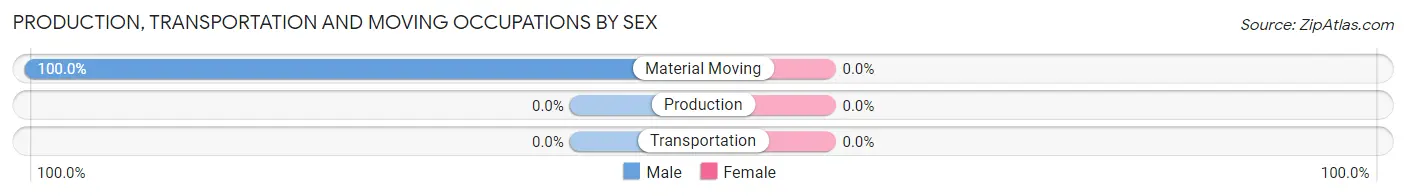
| Occupation | Male | Female |
| Production | 0 (0.0%) | 0 (0.0%) |
| Transportation | 0 (0.0%) | 0 (0.0%) |
| Material Moving | 5 (100.0%) | 0 (0.0%) |
| Total (Category) | 5 (100.0%) | 0 (0.0%) |
| Total (Overall) | 29 (48.3%) | 31 (51.7%) |
Employment Industries by Sex in Blodgett Landing
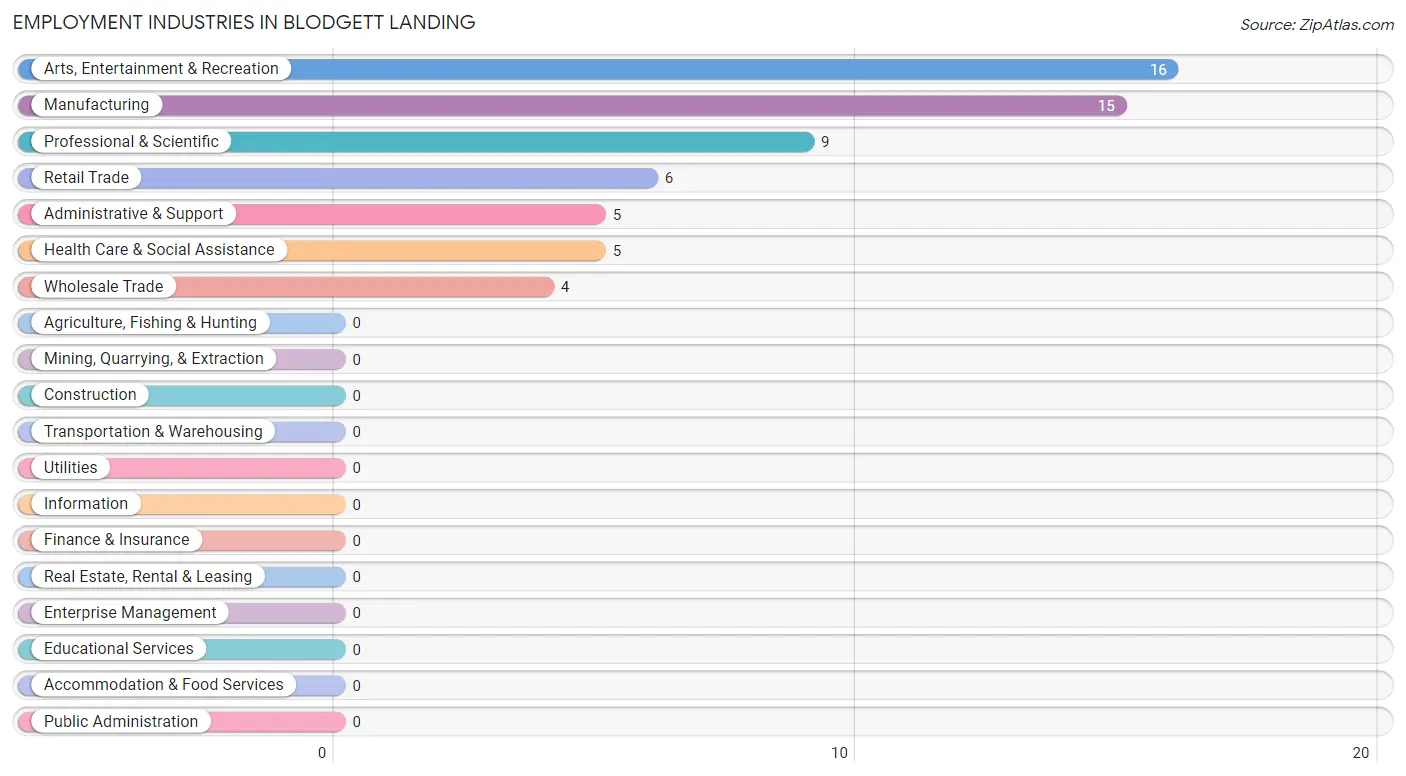
Employment Industries in Blodgett Landing
The major employment industries in Blodgett Landing include Arts, Entertainment & Recreation (16 | 26.7%), Manufacturing (15 | 25.0%), Professional & Scientific (9 | 15.0%), Retail Trade (6 | 10.0%), and Administrative & Support (5 | 8.3%).
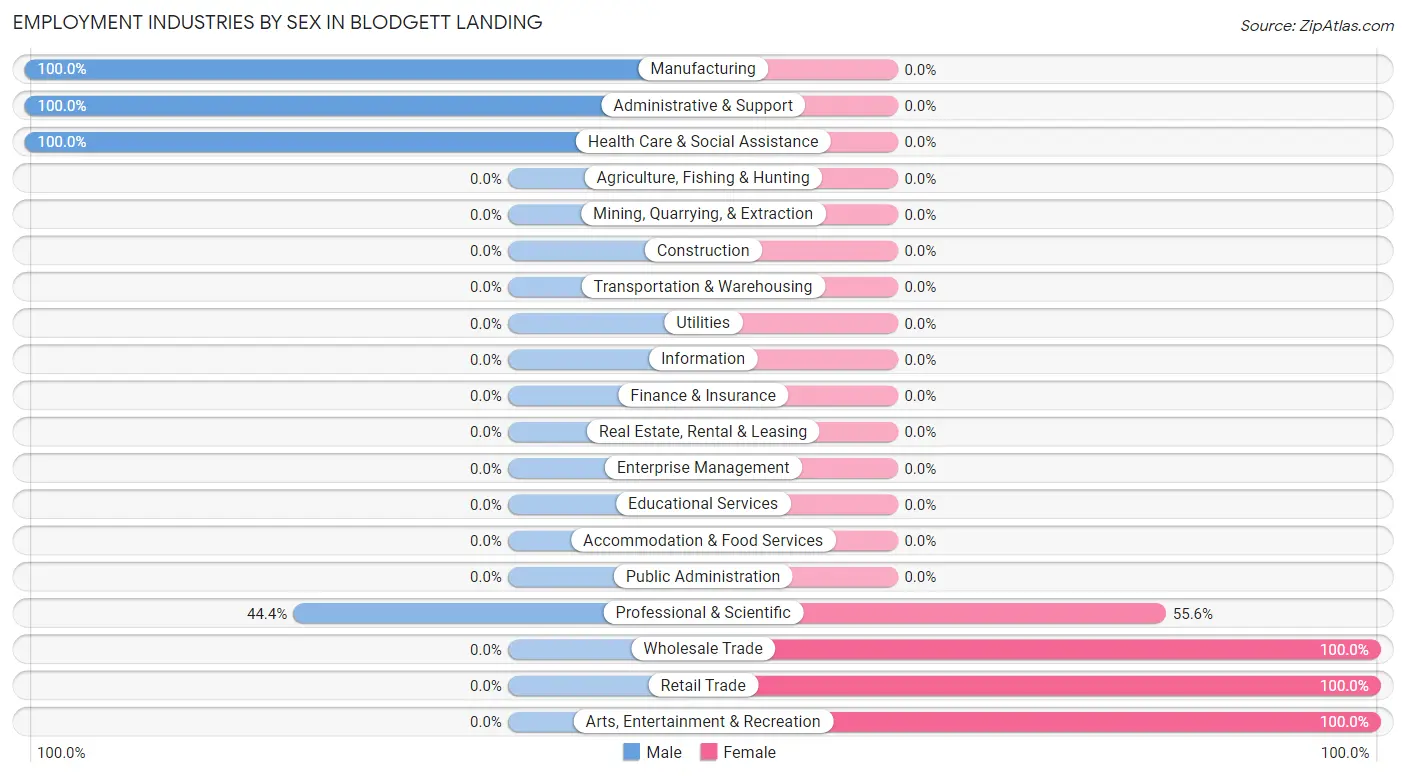
Employment Industries by Sex in Blodgett Landing
The Blodgett Landing industries that see more men than women are Manufacturing (100.0%), Administrative & Support (100.0%), and Health Care & Social Assistance (100.0%), whereas the industries that tend to have a higher number of women are Wholesale Trade (100.0%), Retail Trade (100.0%), and Arts, Entertainment & Recreation (100.0%).
| Industry | Male | Female |
| Agriculture, Fishing & Hunting | 0 (0.0%) | 0 (0.0%) |
| Mining, Quarrying, & Extraction | 0 (0.0%) | 0 (0.0%) |
| Construction | 0 (0.0%) | 0 (0.0%) |
| Manufacturing | 15 (100.0%) | 0 (0.0%) |
| Wholesale Trade | 0 (0.0%) | 4 (100.0%) |
| Retail Trade | 0 (0.0%) | 6 (100.0%) |
| Transportation & Warehousing | 0 (0.0%) | 0 (0.0%) |
| Utilities | 0 (0.0%) | 0 (0.0%) |
| Information | 0 (0.0%) | 0 (0.0%) |
| Finance & Insurance | 0 (0.0%) | 0 (0.0%) |
| Real Estate, Rental & Leasing | 0 (0.0%) | 0 (0.0%) |
| Professional & Scientific | 4 (44.4%) | 5 (55.6%) |
| Enterprise Management | 0 (0.0%) | 0 (0.0%) |
| Administrative & Support | 5 (100.0%) | 0 (0.0%) |
| Educational Services | 0 (0.0%) | 0 (0.0%) |
| Health Care & Social Assistance | 5 (100.0%) | 0 (0.0%) |
| Arts, Entertainment & Recreation | 0 (0.0%) | 16 (100.0%) |
| Accommodation & Food Services | 0 (0.0%) | 0 (0.0%) |
| Public Administration | 0 (0.0%) | 0 (0.0%) |
| Total | 29 (48.3%) | 31 (51.7%) |
Education in Blodgett Landing
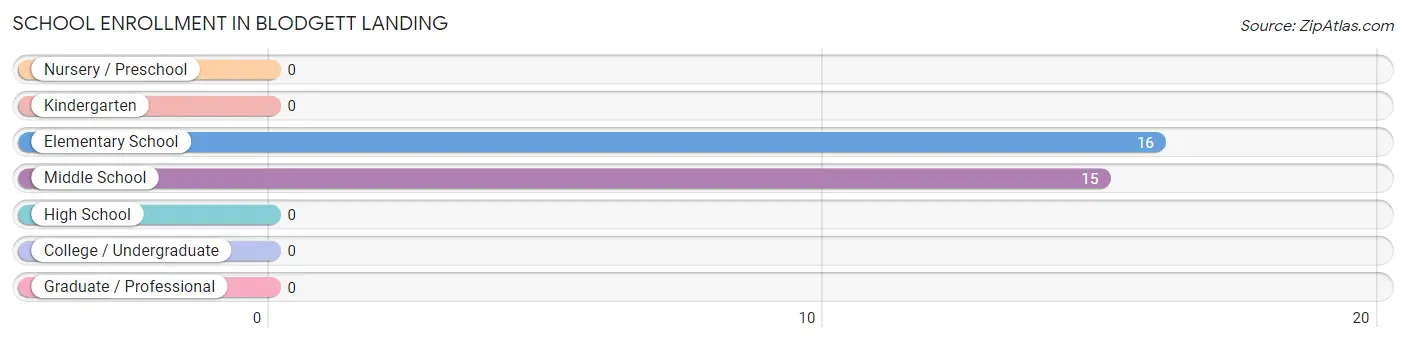
School Enrollment in Blodgett Landing
The most common levels of schooling among the 31 students in Blodgett Landing are elementary school (16 | 51.6%), and middle school (15 | 48.4%).
| School Level | # Students | % Students |
| Nursery / Preschool | 0 | 0.0% |
| Kindergarten | 0 | 0.0% |
| Elementary School | 16 | 51.6% |
| Middle School | 15 | 48.4% |
| High School | 0 | 0.0% |
| College / Undergraduate | 0 | 0.0% |
| Graduate / Professional | 0 | 0.0% |
| Total | 31 | 100.0% |
School Enrollment by Age by Funding Source in Blodgett Landing
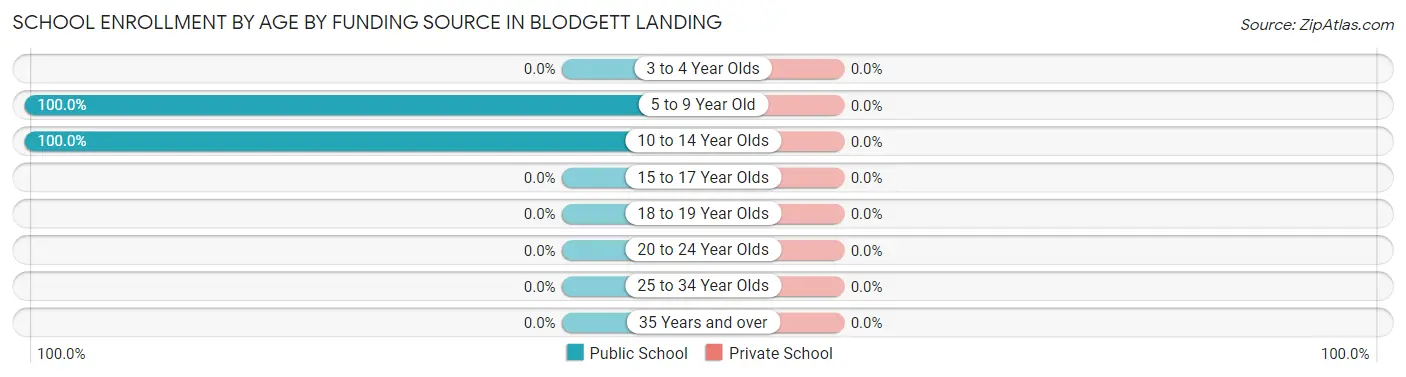
| Age Bracket | Public School | Private School |
| 3 to 4 Year Olds | 0 (0.0%) | 0 (0.0%) |
| 5 to 9 Year Old | 16 (100.0%) | 0 (0.0%) |
| 10 to 14 Year Olds | 15 (100.0%) | 0 (0.0%) |
| 15 to 17 Year Olds | 0 (0.0%) | 0 (0.0%) |
| 18 to 19 Year Olds | 0 (0.0%) | 0 (0.0%) |
| 20 to 24 Year Olds | 0 (0.0%) | 0 (0.0%) |
| 25 to 34 Year Olds | 0 (0.0%) | 0 (0.0%) |
| 35 Years and over | 0 (0.0%) | 0 (0.0%) |
| Total | 31 (100.0%) | 0 (0.0%) |
Educational Attainment by Field of Study in Blodgett Landing
Social sciences (16 | 22.9%), bio, nature & agricultural (15 | 21.4%), engineering (15 | 21.4%), business (13 | 18.6%), and science & technology (11 | 15.7%) are the most common fields of study among 70 individuals in Blodgett Landing who have obtained a bachelor's degree or higher.
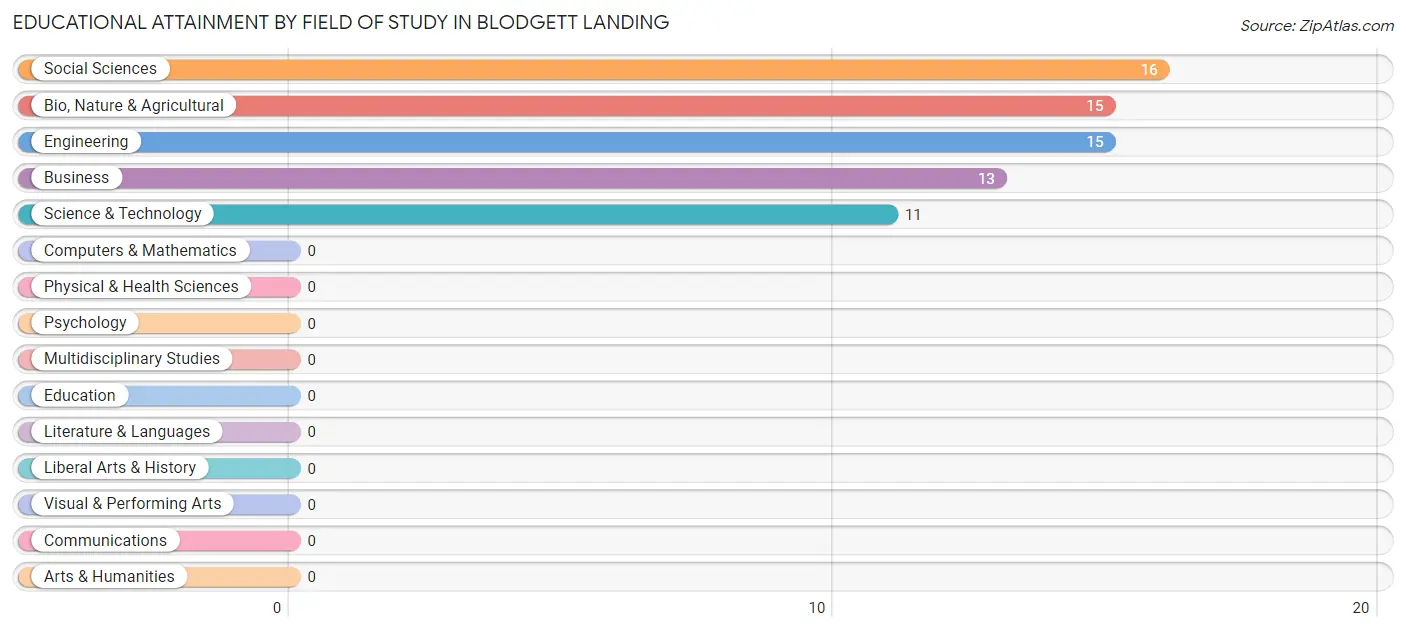
| Field of Study | # Graduates | % Graduates |
| Computers & Mathematics | 0 | 0.0% |
| Bio, Nature & Agricultural | 15 | 21.4% |
| Physical & Health Sciences | 0 | 0.0% |
| Psychology | 0 | 0.0% |
| Social Sciences | 16 | 22.9% |
| Engineering | 15 | 21.4% |
| Multidisciplinary Studies | 0 | 0.0% |
| Science & Technology | 11 | 15.7% |
| Business | 13 | 18.6% |
| Education | 0 | 0.0% |
| Literature & Languages | 0 | 0.0% |
| Liberal Arts & History | 0 | 0.0% |
| Visual & Performing Arts | 0 | 0.0% |
| Communications | 0 | 0.0% |
| Arts & Humanities | 0 | 0.0% |
| Total | 70 | 100.0% |
Transportation & Commute in Blodgett Landing
Vehicle Availability by Sex in Blodgett Landing
The most prevalent vehicle ownership categories in Blodgett Landing are males with 3 vehicles (24, accounting for 82.8%) and females with 3 vehicles (20, making up 77.4%).
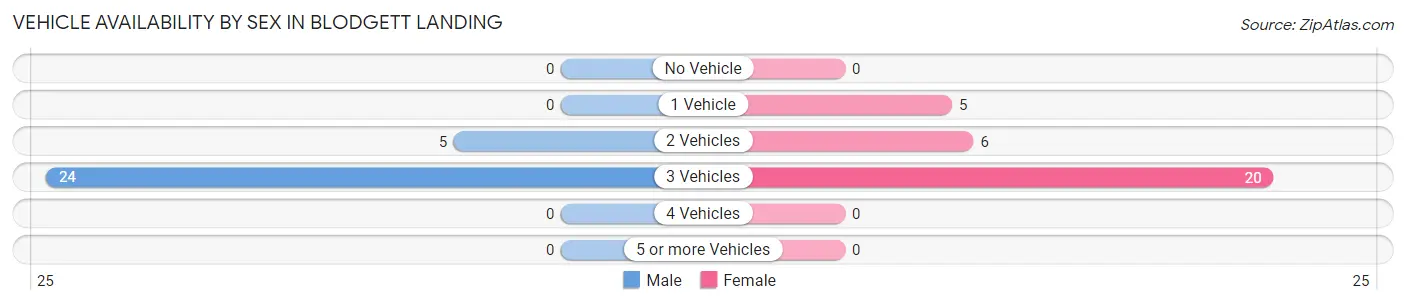
| Vehicles Available | Male | Female |
| No Vehicle | 0 (0.0%) | 0 (0.0%) |
| 1 Vehicle | 0 (0.0%) | 5 (16.1%) |
| 2 Vehicles | 5 (17.2%) | 6 (19.4%) |
| 3 Vehicles | 24 (82.8%) | 20 (64.5%) |
| 4 Vehicles | 0 (0.0%) | 0 (0.0%) |
| 5 or more Vehicles | 0 (0.0%) | 0 (0.0%) |
| Total | 29 (100.0%) | 31 (100.0%) |
Commute Time in Blodgett Landing
The most frequently occuring commute durations in Blodgett Landing are less than 5 minutes (16 commuters, 26.7%), 90 or more minutes (15 commuters, 25.0%), and 60 to 89 minutes (10 commuters, 16.7%).
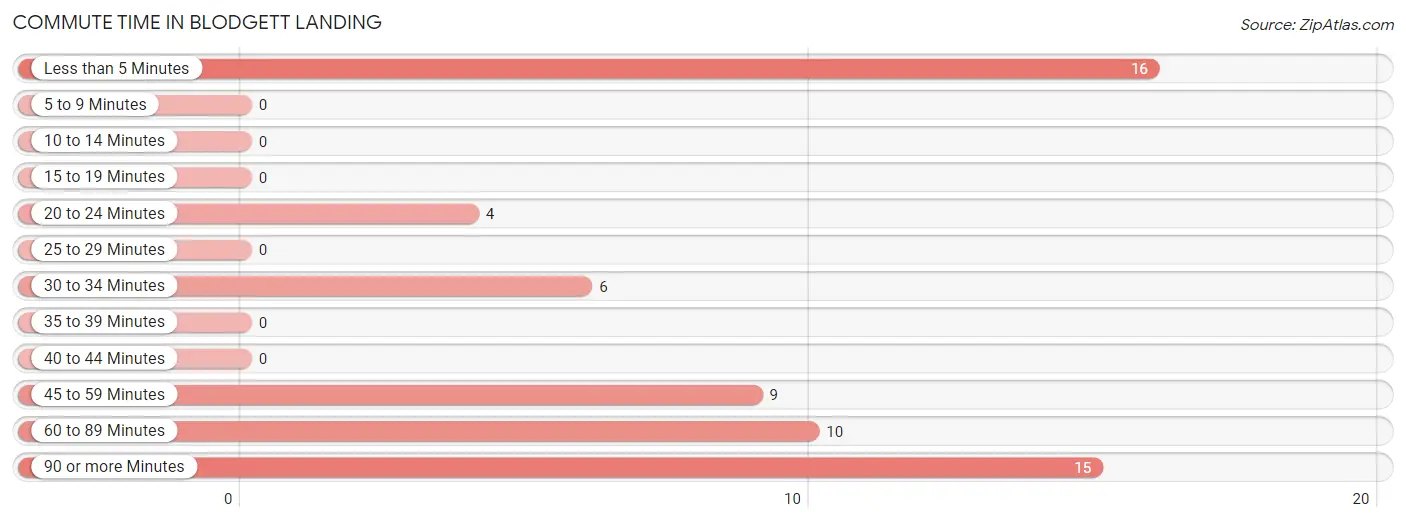
| Commute Time | # Commuters | % Commuters |
| Less than 5 Minutes | 16 | 26.7% |
| 5 to 9 Minutes | 0 | 0.0% |
| 10 to 14 Minutes | 0 | 0.0% |
| 15 to 19 Minutes | 0 | 0.0% |
| 20 to 24 Minutes | 4 | 6.7% |
| 25 to 29 Minutes | 0 | 0.0% |
| 30 to 34 Minutes | 6 | 10.0% |
| 35 to 39 Minutes | 0 | 0.0% |
| 40 to 44 Minutes | 0 | 0.0% |
| 45 to 59 Minutes | 9 | 15.0% |
| 60 to 89 Minutes | 10 | 16.7% |
| 90 or more Minutes | 15 | 25.0% |
Commute Time by Sex in Blodgett Landing
The most common commute times in Blodgett Landing are 90 or more minutes (15 commuters, 51.7%) for males and less than 5 minutes (16 commuters, 51.6%) for females.
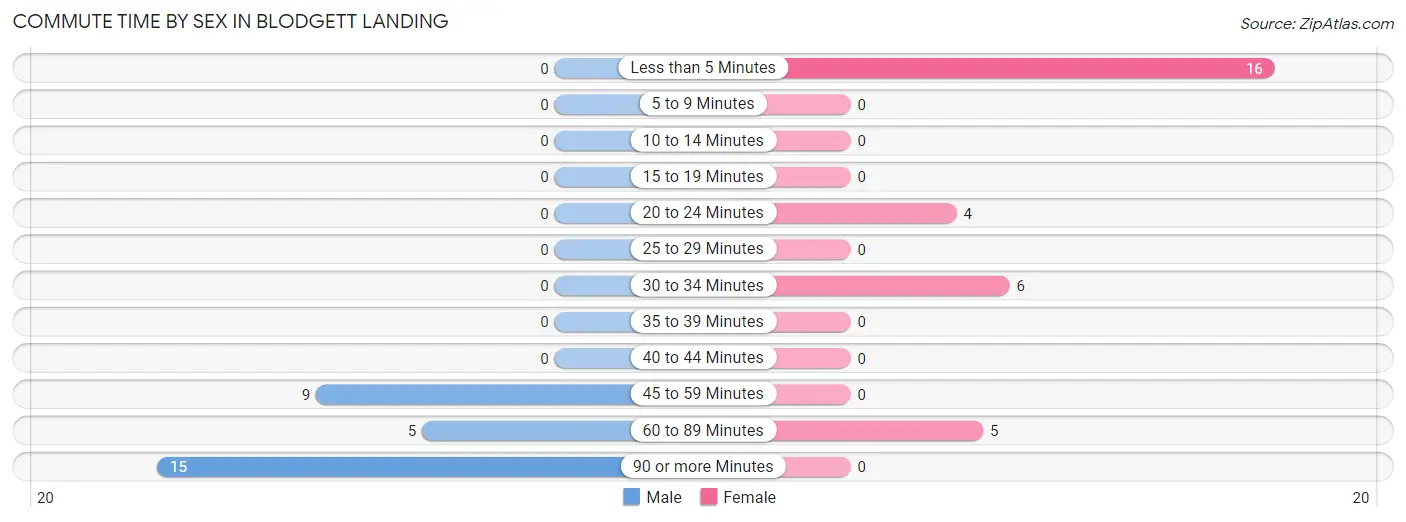
| Commute Time | Male | Female |
| Less than 5 Minutes | 0 (0.0%) | 16 (51.6%) |
| 5 to 9 Minutes | 0 (0.0%) | 0 (0.0%) |
| 10 to 14 Minutes | 0 (0.0%) | 0 (0.0%) |
| 15 to 19 Minutes | 0 (0.0%) | 0 (0.0%) |
| 20 to 24 Minutes | 0 (0.0%) | 4 (12.9%) |
| 25 to 29 Minutes | 0 (0.0%) | 0 (0.0%) |
| 30 to 34 Minutes | 0 (0.0%) | 6 (19.4%) |
| 35 to 39 Minutes | 0 (0.0%) | 0 (0.0%) |
| 40 to 44 Minutes | 0 (0.0%) | 0 (0.0%) |
| 45 to 59 Minutes | 9 (31.0%) | 0 (0.0%) |
| 60 to 89 Minutes | 5 (17.2%) | 5 (16.1%) |
| 90 or more Minutes | 15 (51.7%) | 0 (0.0%) |
Time of Departure to Work by Sex in Blodgett Landing
The most frequent times of departure to work in Blodgett Landing are 12:00 AM to 4:59 AM (25, 86.2%) for males and 10:00 AM to 10:59 AM (16, 51.6%) for females.
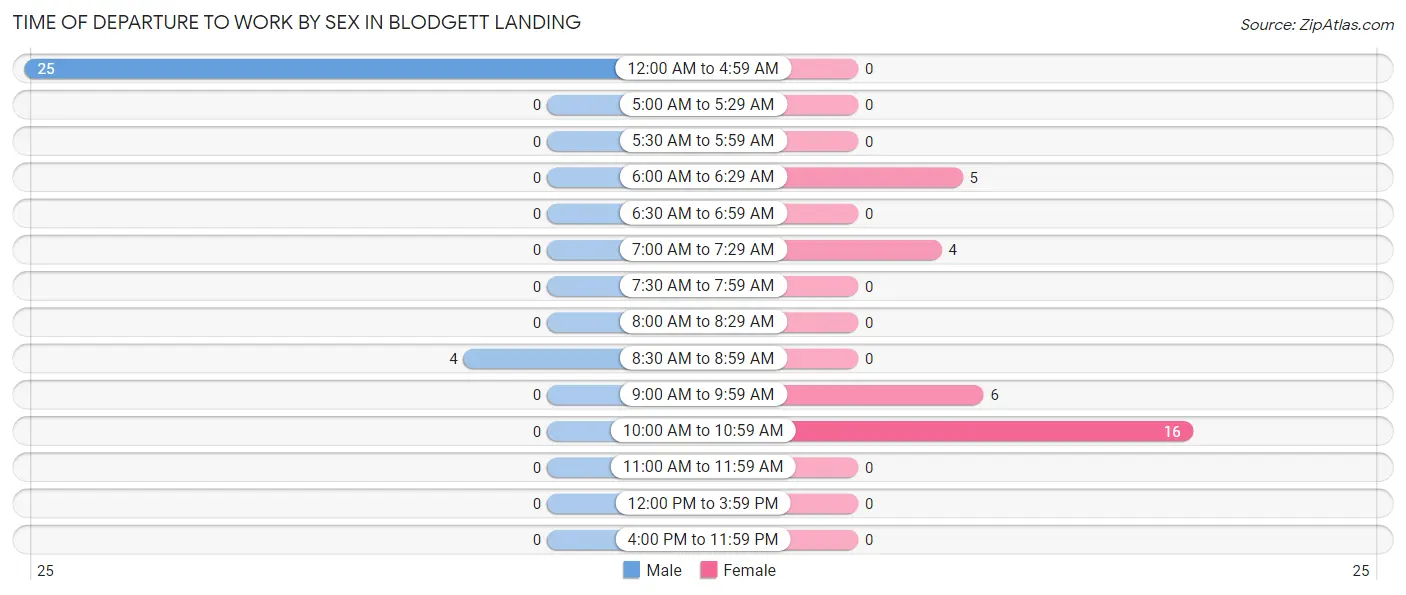
| Time of Departure | Male | Female |
| 12:00 AM to 4:59 AM | 25 (86.2%) | 0 (0.0%) |
| 5:00 AM to 5:29 AM | 0 (0.0%) | 0 (0.0%) |
| 5:30 AM to 5:59 AM | 0 (0.0%) | 0 (0.0%) |
| 6:00 AM to 6:29 AM | 0 (0.0%) | 5 (16.1%) |
| 6:30 AM to 6:59 AM | 0 (0.0%) | 0 (0.0%) |
| 7:00 AM to 7:29 AM | 0 (0.0%) | 4 (12.9%) |
| 7:30 AM to 7:59 AM | 0 (0.0%) | 0 (0.0%) |
| 8:00 AM to 8:29 AM | 0 (0.0%) | 0 (0.0%) |
| 8:30 AM to 8:59 AM | 4 (13.8%) | 0 (0.0%) |
| 9:00 AM to 9:59 AM | 0 (0.0%) | 6 (19.4%) |
| 10:00 AM to 10:59 AM | 0 (0.0%) | 16 (51.6%) |
| 11:00 AM to 11:59 AM | 0 (0.0%) | 0 (0.0%) |
| 12:00 PM to 3:59 PM | 0 (0.0%) | 0 (0.0%) |
| 4:00 PM to 11:59 PM | 0 (0.0%) | 0 (0.0%) |
| Total | 29 (100.0%) | 31 (100.0%) |
Housing Occupancy in Blodgett Landing
Occupancy by Ownership in Blodgett Landing
Of the total 42 dwellings in Blodgett Landing, owner-occupied units account for 36 (85.7%), while renter-occupied units make up 6 (14.3%).
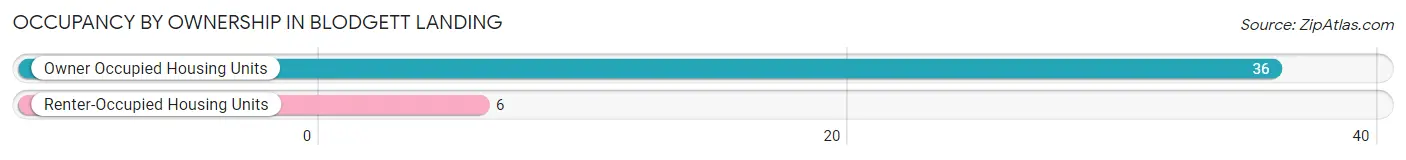
| Occupancy | # Housing Units | % Housing Units |
| Owner Occupied Housing Units | 36 | 85.7% |
| Renter-Occupied Housing Units | 6 | 14.3% |
| Total Occupied Housing Units | 42 | 100.0% |
Occupancy by Household Size in Blodgett Landing
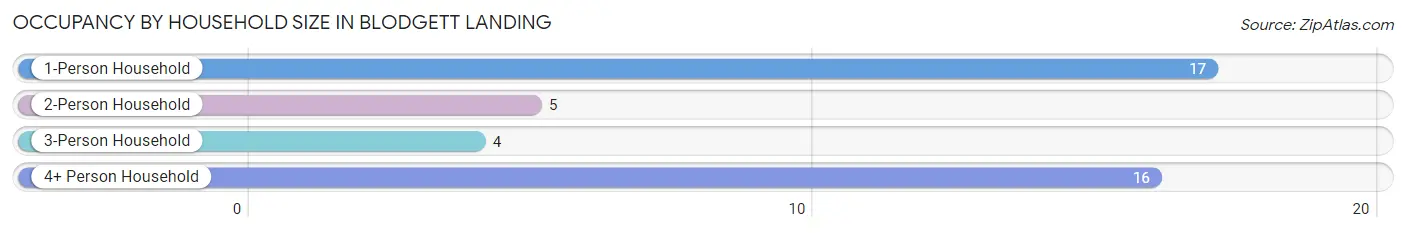
| Household Size | # Housing Units | % Housing Units |
| 1-Person Household | 17 | 40.5% |
| 2-Person Household | 5 | 11.9% |
| 3-Person Household | 4 | 9.5% |
| 4+ Person Household | 16 | 38.1% |
| Total Housing Units | 42 | 100.0% |
Occupancy by Ownership by Household Size in Blodgett Landing
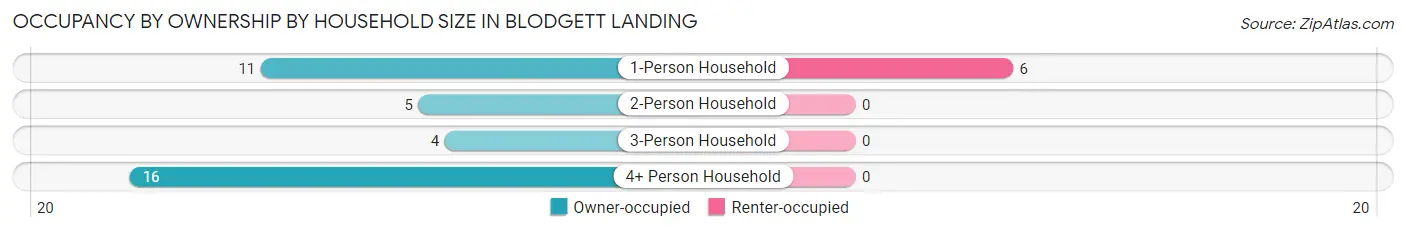
| Household Size | Owner-occupied | Renter-occupied |
| 1-Person Household | 11 (64.7%) | 6 (35.3%) |
| 2-Person Household | 5 (100.0%) | 0 (0.0%) |
| 3-Person Household | 4 (100.0%) | 0 (0.0%) |
| 4+ Person Household | 16 (100.0%) | 0 (0.0%) |
| Total Housing Units | 36 (85.7%) | 6 (14.3%) |
Occupancy by Educational Attainment in Blodgett Landing
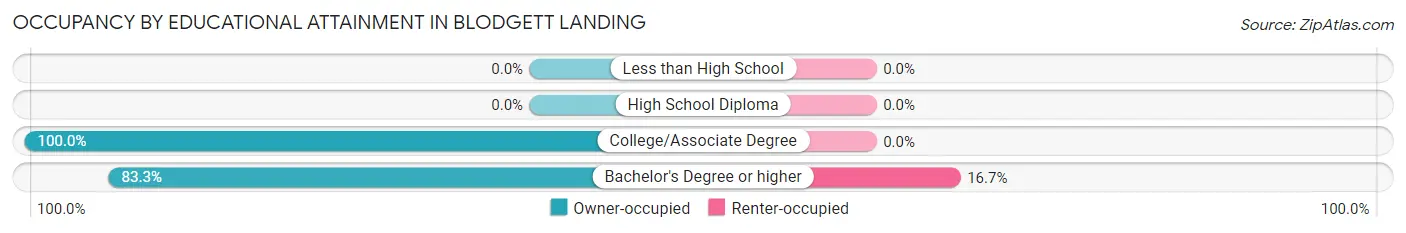
| Household Size | Owner-occupied | Renter-occupied |
| Less than High School | 0 (0.0%) | 0 (0.0%) |
| High School Diploma | 0 (0.0%) | 0 (0.0%) |
| College/Associate Degree | 6 (100.0%) | 0 (0.0%) |
| Bachelor's Degree or higher | 30 (83.3%) | 6 (16.7%) |
Occupancy by Age of Householder in Blodgett Landing
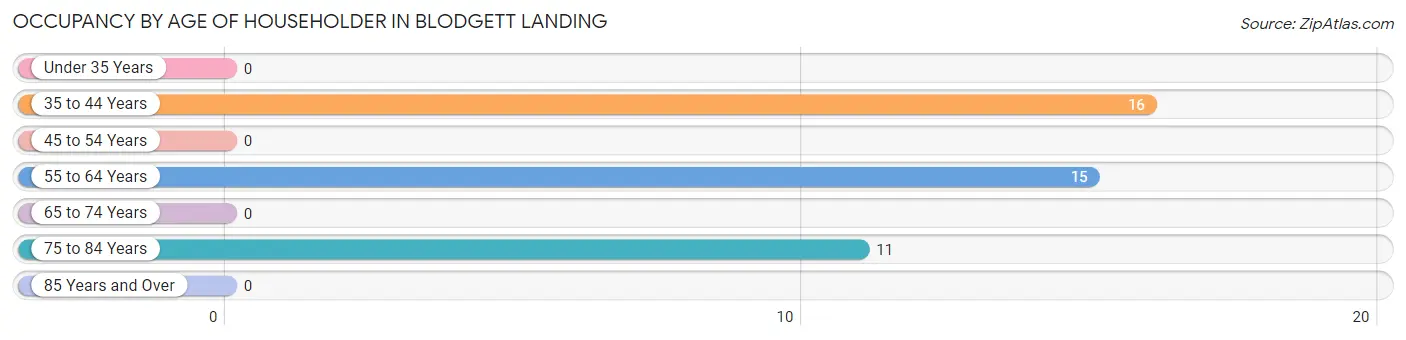
| Age Bracket | # Households | % Households |
| Under 35 Years | 0 | 0.0% |
| 35 to 44 Years | 16 | 38.1% |
| 45 to 54 Years | 0 | 0.0% |
| 55 to 64 Years | 15 | 35.7% |
| 65 to 74 Years | 0 | 0.0% |
| 75 to 84 Years | 11 | 26.2% |
| 85 Years and Over | 0 | 0.0% |
| Total | 42 | 100.0% |
Housing Finances in Blodgett Landing
Median Income by Occupancy in Blodgett Landing
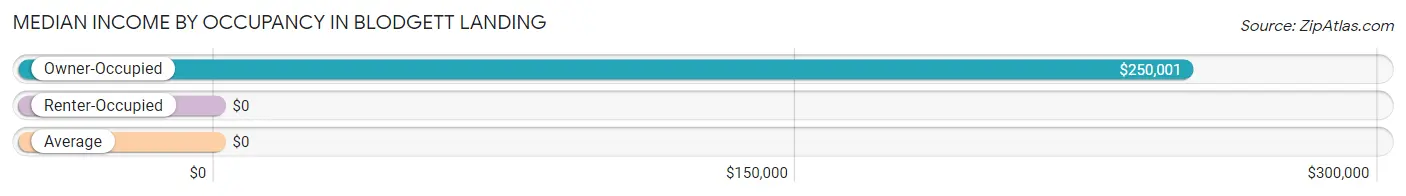
| Occupancy Type | # Households | Median Income |
| Owner-Occupied | 36 (85.7%) | $250,001 |
| Renter-Occupied | 6 (14.3%) | $0 |
| Average | 42 (100.0%) | $0 |
Occupancy by Householder Income Bracket in Blodgett Landing
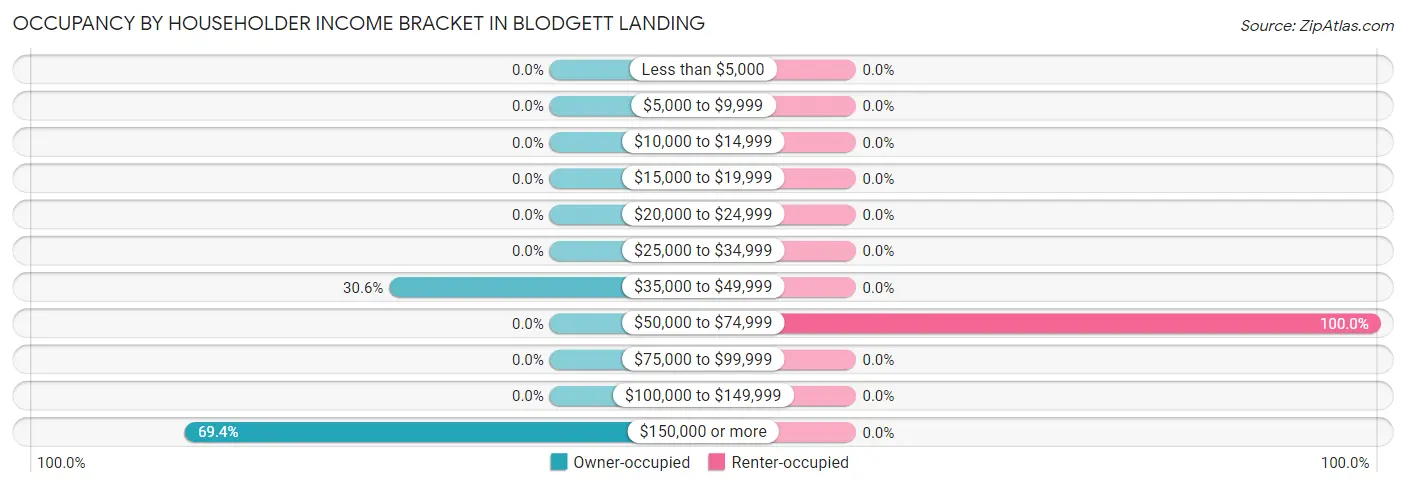
| Income Bracket | Owner-occupied | Renter-occupied |
| Less than $5,000 | 0 (0.0%) | 0 (0.0%) |
| $5,000 to $9,999 | 0 (0.0%) | 0 (0.0%) |
| $10,000 to $14,999 | 0 (0.0%) | 0 (0.0%) |
| $15,000 to $19,999 | 0 (0.0%) | 0 (0.0%) |
| $20,000 to $24,999 | 0 (0.0%) | 0 (0.0%) |
| $25,000 to $34,999 | 0 (0.0%) | 0 (0.0%) |
| $35,000 to $49,999 | 11 (30.6%) | 0 (0.0%) |
| $50,000 to $74,999 | 0 (0.0%) | 6 (100.0%) |
| $75,000 to $99,999 | 0 (0.0%) | 0 (0.0%) |
| $100,000 to $149,999 | 0 (0.0%) | 0 (0.0%) |
| $150,000 or more | 25 (69.4%) | 0 (0.0%) |
| Total | 36 (100.0%) | 6 (100.0%) |
Monthly Housing Cost Tiers in Blodgett Landing
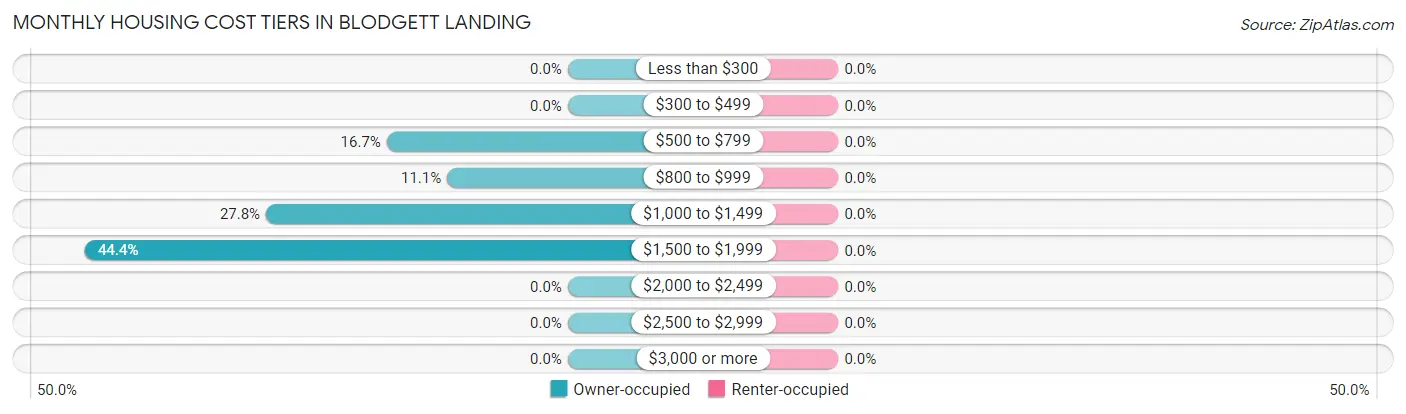
| Monthly Cost | Owner-occupied | Renter-occupied |
| Less than $300 | 0 (0.0%) | 0 (0.0%) |
| $300 to $499 | 0 (0.0%) | 0 (0.0%) |
| $500 to $799 | 6 (16.7%) | 0 (0.0%) |
| $800 to $999 | 4 (11.1%) | 0 (0.0%) |
| $1,000 to $1,499 | 10 (27.8%) | 0 (0.0%) |
| $1,500 to $1,999 | 16 (44.4%) | 0 (0.0%) |
| $2,000 to $2,499 | 0 (0.0%) | 0 (0.0%) |
| $2,500 to $2,999 | 0 (0.0%) | 0 (0.0%) |
| $3,000 or more | 0 (0.0%) | 0 (0.0%) |
| Total | 36 (100.0%) | 6 (100.0%) |
Physical Housing Characteristics in Blodgett Landing
Housing Structures in Blodgett Landing
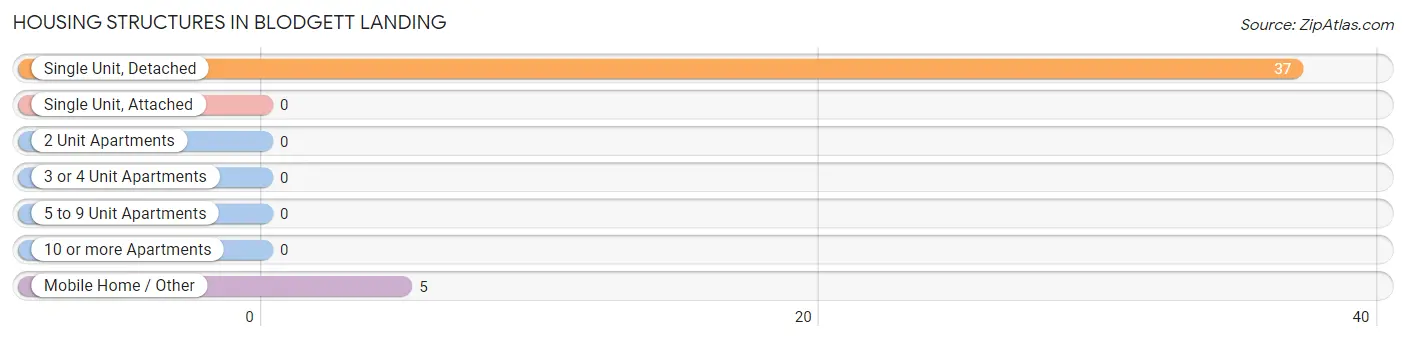
| Structure Type | # Housing Units | % Housing Units |
| Single Unit, Detached | 37 | 88.1% |
| Single Unit, Attached | 0 | 0.0% |
| 2 Unit Apartments | 0 | 0.0% |
| 3 or 4 Unit Apartments | 0 | 0.0% |
| 5 to 9 Unit Apartments | 0 | 0.0% |
| 10 or more Apartments | 0 | 0.0% |
| Mobile Home / Other | 5 | 11.9% |
| Total | 42 | 100.0% |
Housing Structures by Occupancy in Blodgett Landing
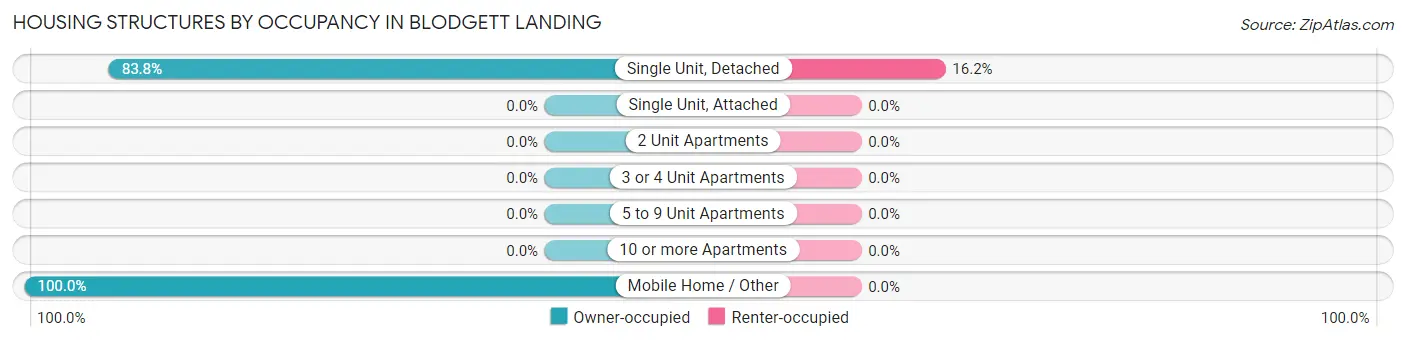
| Structure Type | Owner-occupied | Renter-occupied |
| Single Unit, Detached | 31 (83.8%) | 6 (16.2%) |
| Single Unit, Attached | 0 (0.0%) | 0 (0.0%) |
| 2 Unit Apartments | 0 (0.0%) | 0 (0.0%) |
| 3 or 4 Unit Apartments | 0 (0.0%) | 0 (0.0%) |
| 5 to 9 Unit Apartments | 0 (0.0%) | 0 (0.0%) |
| 10 or more Apartments | 0 (0.0%) | 0 (0.0%) |
| Mobile Home / Other | 5 (100.0%) | 0 (0.0%) |
| Total | 36 (85.7%) | 6 (14.3%) |
Housing Structures by Number of Rooms in Blodgett Landing
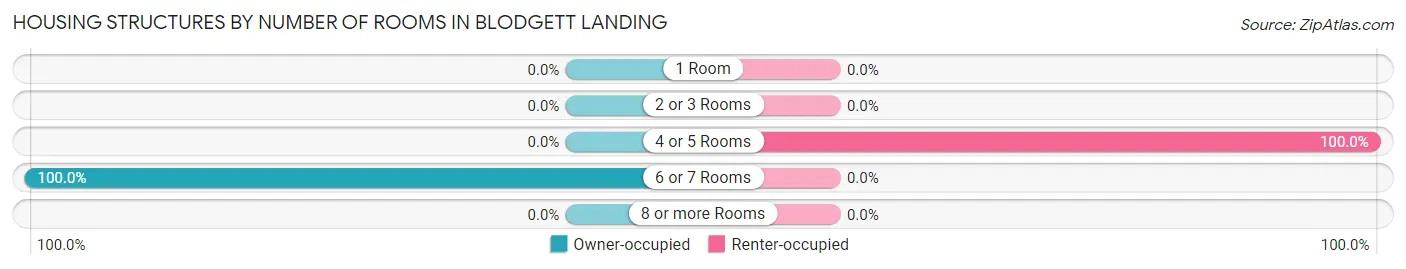
| Number of Rooms | Owner-occupied | Renter-occupied |
| 1 Room | 0 (0.0%) | 0 (0.0%) |
| 2 or 3 Rooms | 0 (0.0%) | 0 (0.0%) |
| 4 or 5 Rooms | 0 (0.0%) | 6 (100.0%) |
| 6 or 7 Rooms | 36 (100.0%) | 0 (0.0%) |
| 8 or more Rooms | 0 (0.0%) | 0 (0.0%) |
| Total | 36 (100.0%) | 6 (100.0%) |
Housing Structure by Heating Type in Blodgett Landing
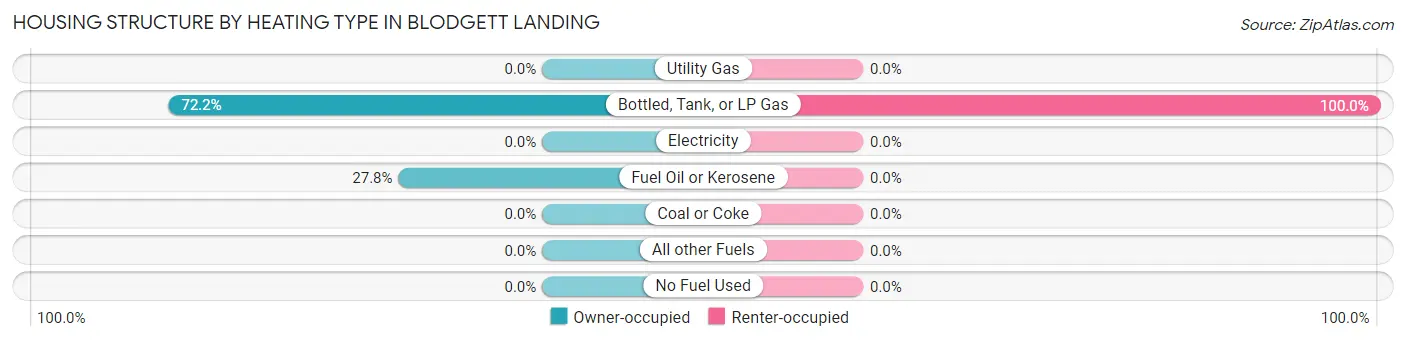
| Heating Type | Owner-occupied | Renter-occupied |
| Utility Gas | 0 (0.0%) | 0 (0.0%) |
| Bottled, Tank, or LP Gas | 26 (72.2%) | 6 (100.0%) |
| Electricity | 0 (0.0%) | 0 (0.0%) |
| Fuel Oil or Kerosene | 10 (27.8%) | 0 (0.0%) |
| Coal or Coke | 0 (0.0%) | 0 (0.0%) |
| All other Fuels | 0 (0.0%) | 0 (0.0%) |
| No Fuel Used | 0 (0.0%) | 0 (0.0%) |
| Total | 36 (100.0%) | 6 (100.0%) |
Household Vehicle Usage in Blodgett Landing
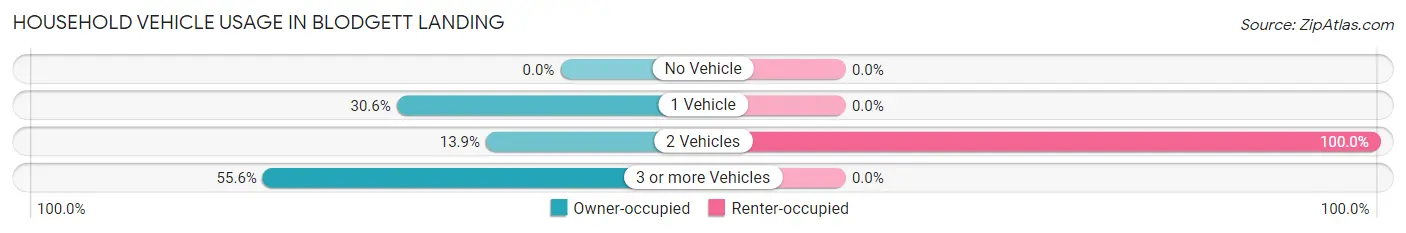
| Vehicles per Household | Owner-occupied | Renter-occupied |
| No Vehicle | 0 (0.0%) | 0 (0.0%) |
| 1 Vehicle | 11 (30.6%) | 0 (0.0%) |
| 2 Vehicles | 5 (13.9%) | 6 (100.0%) |
| 3 or more Vehicles | 20 (55.6%) | 0 (0.0%) |
| Total | 36 (100.0%) | 6 (100.0%) |
Real Estate & Mortgages in Blodgett Landing
Real Estate and Mortgage Overview in Blodgett Landing
| Characteristic | Without Mortgage | With Mortgage |
| Housing Units | 11 | 25 |
| Median Property Value | - | - |
| Median Household Income | - | - |
| Monthly Housing Costs | - | - |
| Real Estate Taxes | - | - |
Property Value by Mortgage Status in Blodgett Landing
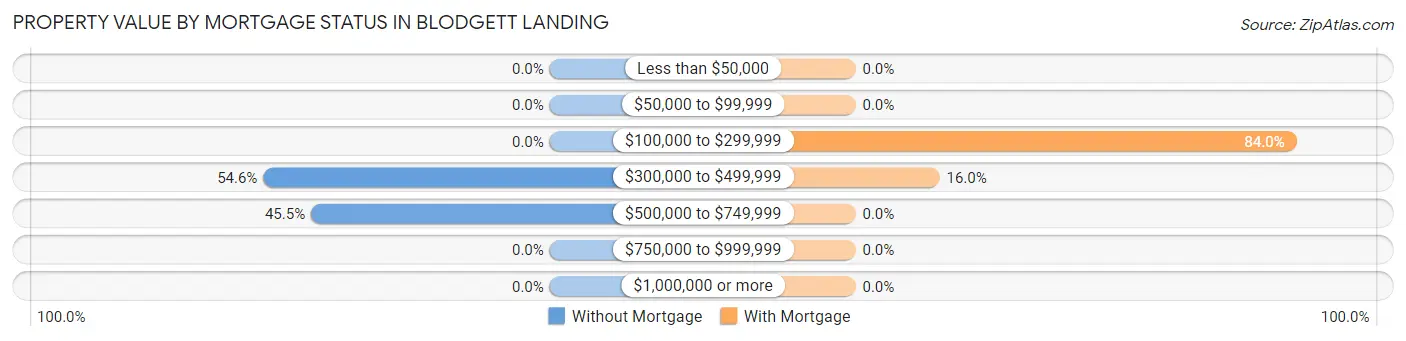
| Property Value | Without Mortgage | With Mortgage |
| Less than $50,000 | 0 (0.0%) | 0 (0.0%) |
| $50,000 to $99,999 | 0 (0.0%) | 0 (0.0%) |
| $100,000 to $299,999 | 0 (0.0%) | 21 (84.0%) |
| $300,000 to $499,999 | 6 (54.5%) | 4 (16.0%) |
| $500,000 to $749,999 | 5 (45.5%) | 0 (0.0%) |
| $750,000 to $999,999 | 0 (0.0%) | 0 (0.0%) |
| $1,000,000 or more | 0 (0.0%) | 0 (0.0%) |
| Total | 11 (100.0%) | 25 (100.0%) |
Household Income by Mortgage Status in Blodgett Landing
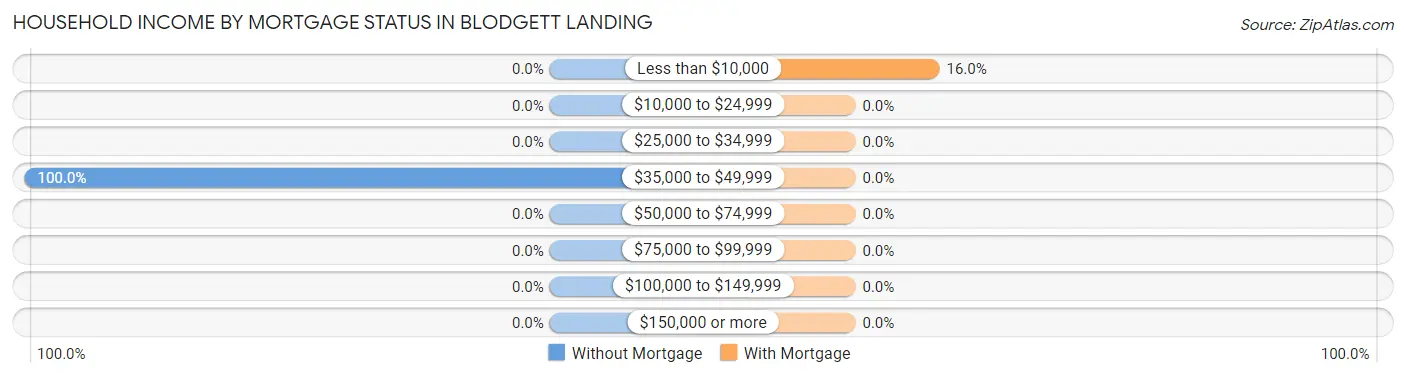
| Household Income | Without Mortgage | With Mortgage |
| Less than $10,000 | 0 (0.0%) | 4 (16.0%) |
| $10,000 to $24,999 | 0 (0.0%) | 0 (0.0%) |
| $25,000 to $34,999 | 0 (0.0%) | 0 (0.0%) |
| $35,000 to $49,999 | 11 (100.0%) | 0 (0.0%) |
| $50,000 to $74,999 | 0 (0.0%) | 0 (0.0%) |
| $75,000 to $99,999 | 0 (0.0%) | 0 (0.0%) |
| $100,000 to $149,999 | 0 (0.0%) | 0 (0.0%) |
| $150,000 or more | 0 (0.0%) | 0 (0.0%) |
| Total | 11 (100.0%) | 25 (100.0%) |
Property Value to Household Income Ratio in Blodgett Landing
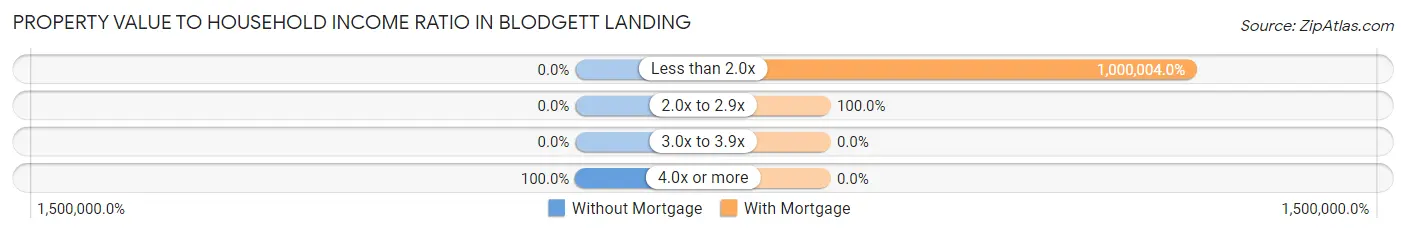
| Value-to-Income Ratio | Without Mortgage | With Mortgage |
| Less than 2.0x | 0 (0.0%) | 250,001 (1,000,004.0%) |
| 2.0x to 2.9x | 0 (0.0%) | 25 (100.0%) |
| 3.0x to 3.9x | 0 (0.0%) | 0 (0.0%) |
| 4.0x or more | 11 (100.0%) | 0 (0.0%) |
| Total | 11 (100.0%) | 25 (100.0%) |
Real Estate Taxes by Mortgage Status in Blodgett Landing
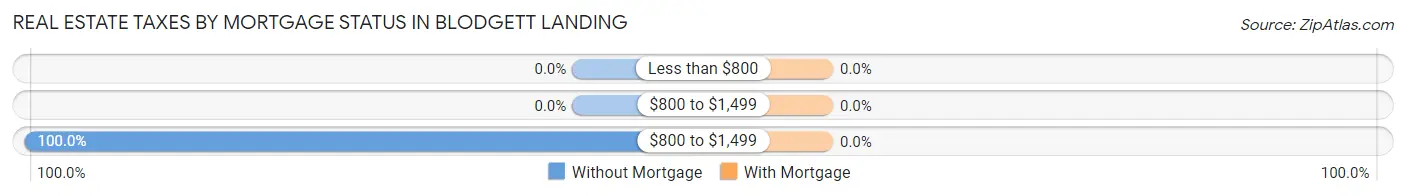
| Property Taxes | Without Mortgage | With Mortgage |
| Less than $800 | 0 (0.0%) | 0 (0.0%) |
| $800 to $1,499 | 0 (0.0%) | 0 (0.0%) |
| $800 to $1,499 | 11 (100.0%) | 0 (0.0%) |
| Total | 11 (100.0%) | 25 (100.0%) |
Health & Disability in Blodgett Landing
Health Insurance Coverage by Age in Blodgett Landing
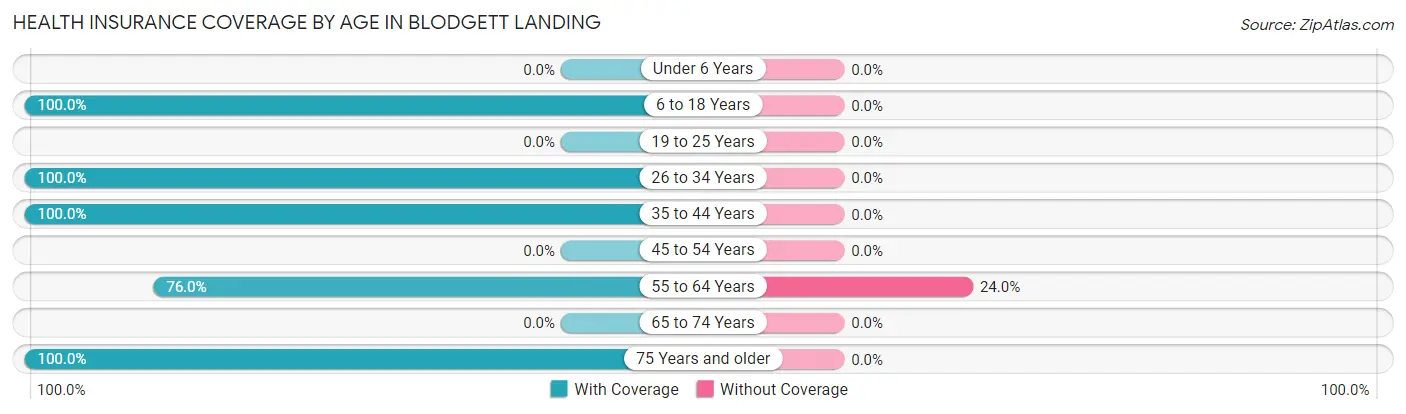
| Age Bracket | With Coverage | Without Coverage |
| Under 6 Years | 0 (0.0%) | 0 (0.0%) |
| 6 to 18 Years | 31 (100.0%) | 0 (0.0%) |
| 19 to 25 Years | 0 (0.0%) | 0 (0.0%) |
| 26 to 34 Years | 5 (100.0%) | 0 (0.0%) |
| 35 to 44 Years | 31 (100.0%) | 0 (0.0%) |
| 45 to 54 Years | 0 (0.0%) | 0 (0.0%) |
| 55 to 64 Years | 19 (76.0%) | 6 (24.0%) |
| 65 to 74 Years | 0 (0.0%) | 0 (0.0%) |
| 75 Years and older | 11 (100.0%) | 0 (0.0%) |
| Total | 97 (94.2%) | 6 (5.8%) |
Health Insurance Coverage by Citizenship Status in Blodgett Landing
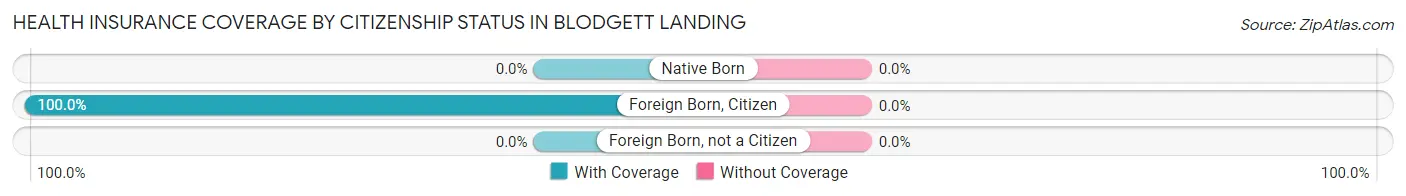
| Citizenship Status | With Coverage | Without Coverage |
| Native Born | 0 (0.0%) | 0 (0.0%) |
| Foreign Born, Citizen | 31 (100.0%) | 0 (0.0%) |
| Foreign Born, not a Citizen | 0 (0.0%) | 0 (0.0%) |
Health Insurance Coverage by Household Income in Blodgett Landing
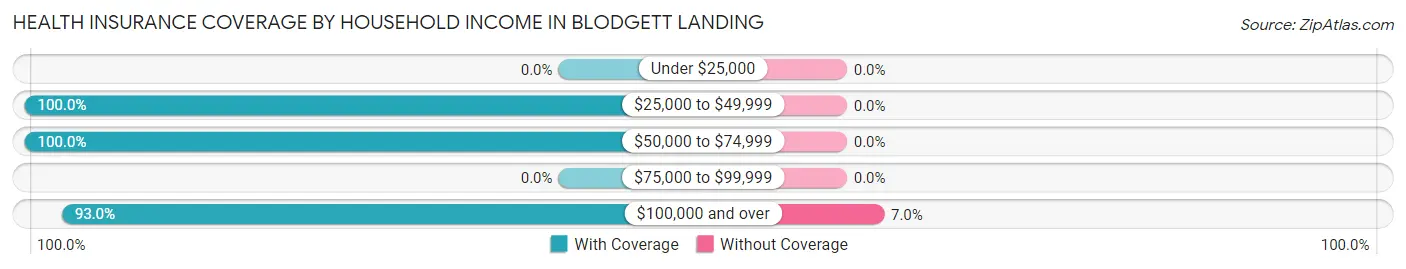
| Household Income | With Coverage | Without Coverage |
| Under $25,000 | 0 (0.0%) | 0 (0.0%) |
| $25,000 to $49,999 | 11 (100.0%) | 0 (0.0%) |
| $50,000 to $74,999 | 6 (100.0%) | 0 (0.0%) |
| $75,000 to $99,999 | 0 (0.0%) | 0 (0.0%) |
| $100,000 and over | 80 (93.0%) | 6 (7.0%) |
Public vs Private Health Insurance Coverage by Age in Blodgett Landing
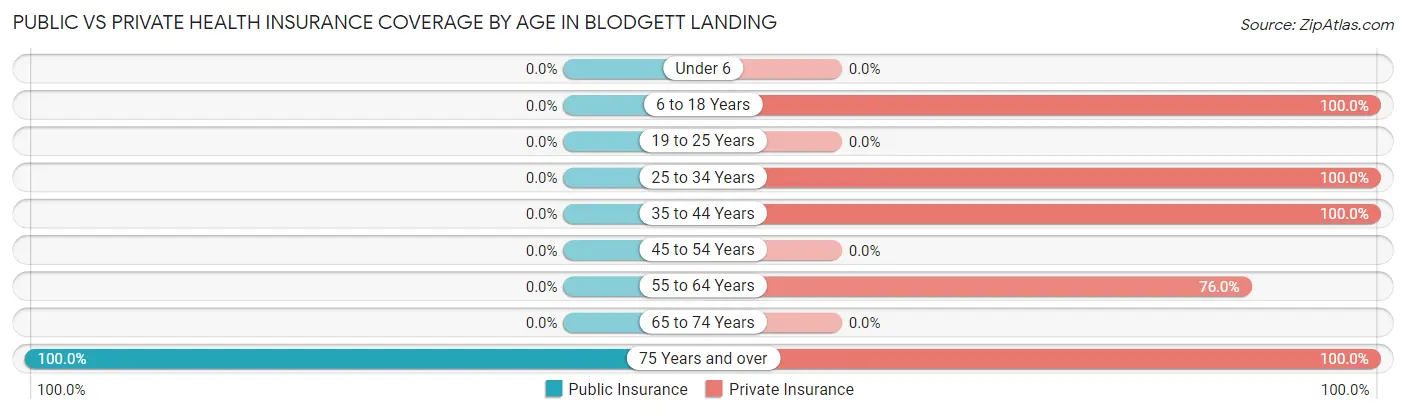
| Age Bracket | Public Insurance | Private Insurance |
| Under 6 | 0 (0.0%) | 0 (0.0%) |
| 6 to 18 Years | 0 (0.0%) | 31 (100.0%) |
| 19 to 25 Years | 0 (0.0%) | 0 (0.0%) |
| 25 to 34 Years | 0 (0.0%) | 5 (100.0%) |
| 35 to 44 Years | 0 (0.0%) | 31 (100.0%) |
| 45 to 54 Years | 0 (0.0%) | 0 (0.0%) |
| 55 to 64 Years | 0 (0.0%) | 19 (76.0%) |
| 65 to 74 Years | 0 (0.0%) | 0 (0.0%) |
| 75 Years and over | 11 (100.0%) | 11 (100.0%) |
| Total | 11 (10.7%) | 97 (94.2%) |
Disability Status by Sex by Age in Blodgett Landing
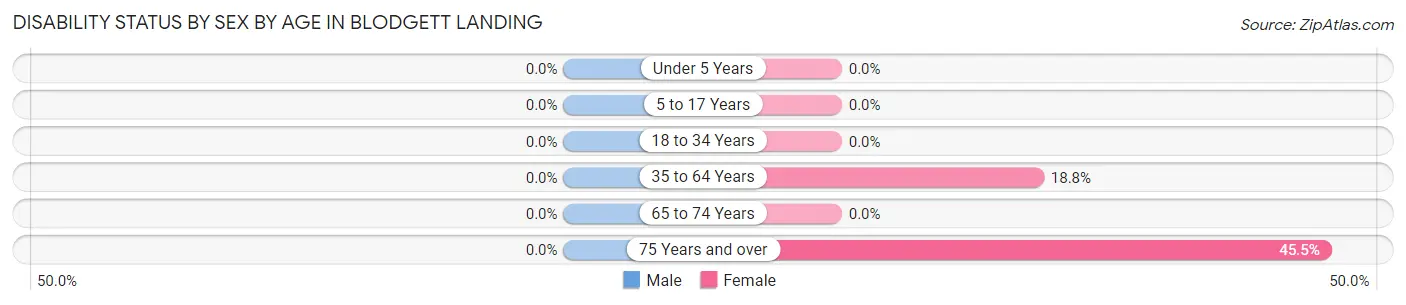
| Age Bracket | Male | Female |
| Under 5 Years | 0 (0.0%) | 0 (0.0%) |
| 5 to 17 Years | 0 (0.0%) | 0 (0.0%) |
| 18 to 34 Years | 0 (0.0%) | 0 (0.0%) |
| 35 to 64 Years | 0 (0.0%) | 6 (18.8%) |
| 65 to 74 Years | 0 (0.0%) | 0 (0.0%) |
| 75 Years and over | 0 (0.0%) | 5 (45.5%) |
Disability Class by Sex by Age in Blodgett Landing
Disability Class: Hearing Difficulty
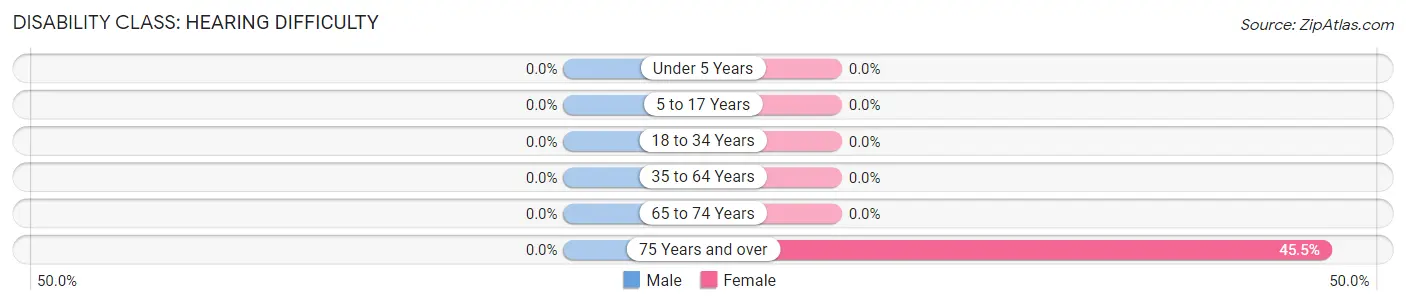
| Age Bracket | Male | Female |
| Under 5 Years | 0 (0.0%) | 0 (0.0%) |
| 5 to 17 Years | 0 (0.0%) | 0 (0.0%) |
| 18 to 34 Years | 0 (0.0%) | 0 (0.0%) |
| 35 to 64 Years | 0 (0.0%) | 0 (0.0%) |
| 65 to 74 Years | 0 (0.0%) | 0 (0.0%) |
| 75 Years and over | 0 (0.0%) | 5 (45.5%) |
Disability Class: Vision Difficulty
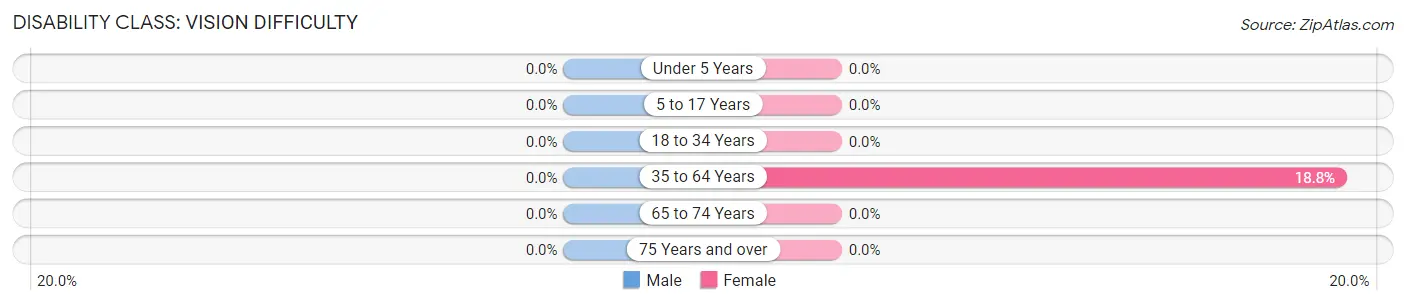
| Age Bracket | Male | Female |
| Under 5 Years | 0 (0.0%) | 0 (0.0%) |
| 5 to 17 Years | 0 (0.0%) | 0 (0.0%) |
| 18 to 34 Years | 0 (0.0%) | 0 (0.0%) |
| 35 to 64 Years | 0 (0.0%) | 6 (18.8%) |
| 65 to 74 Years | 0 (0.0%) | 0 (0.0%) |
| 75 Years and over | 0 (0.0%) | 0 (0.0%) |
Disability Class: Cognitive Difficulty
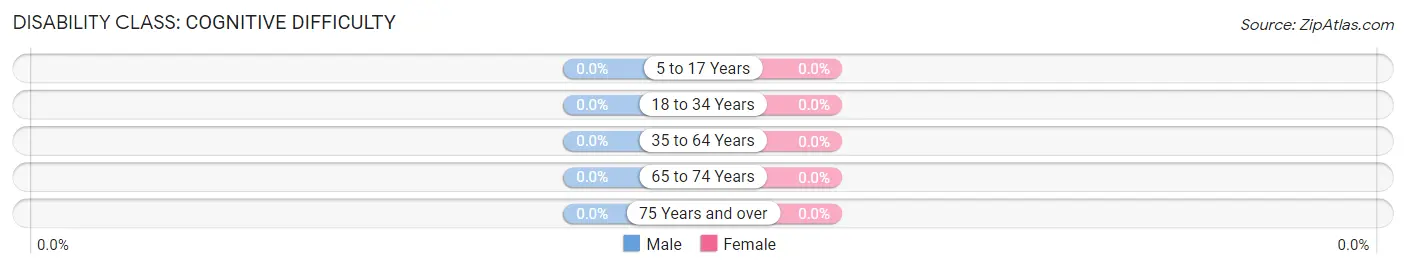
| Age Bracket | Male | Female |
| 5 to 17 Years | 0 (0.0%) | 0 (0.0%) |
| 18 to 34 Years | 0 (0.0%) | 0 (0.0%) |
| 35 to 64 Years | 0 (0.0%) | 0 (0.0%) |
| 65 to 74 Years | 0 (0.0%) | 0 (0.0%) |
| 75 Years and over | 0 (0.0%) | 0 (0.0%) |
Disability Class: Ambulatory Difficulty

| Age Bracket | Male | Female |
| 5 to 17 Years | 0 (0.0%) | 0 (0.0%) |
| 18 to 34 Years | 0 (0.0%) | 0 (0.0%) |
| 35 to 64 Years | 0 (0.0%) | 0 (0.0%) |
| 65 to 74 Years | 0 (0.0%) | 0 (0.0%) |
| 75 Years and over | 0 (0.0%) | 0 (0.0%) |
Disability Class: Self-Care Difficulty
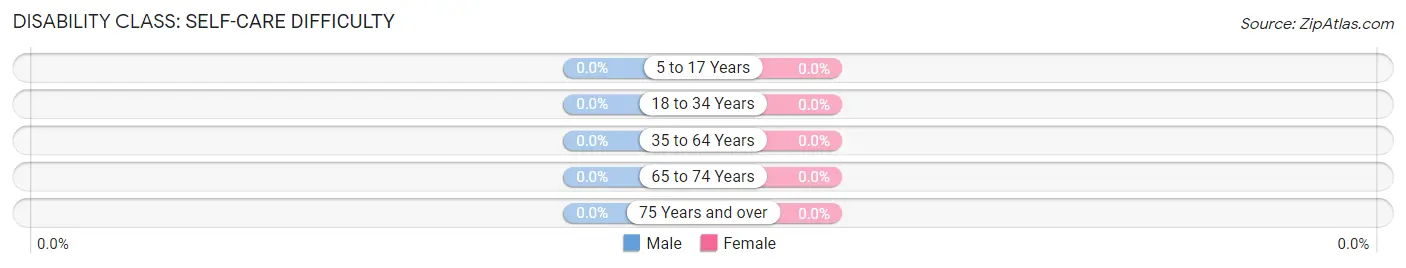
| Age Bracket | Male | Female |
| 5 to 17 Years | 0 (0.0%) | 0 (0.0%) |
| 18 to 34 Years | 0 (0.0%) | 0 (0.0%) |
| 35 to 64 Years | 0 (0.0%) | 0 (0.0%) |
| 65 to 74 Years | 0 (0.0%) | 0 (0.0%) |
| 75 Years and over | 0 (0.0%) | 0 (0.0%) |
Technology Access in Blodgett Landing
Computing Device Access in Blodgett Landing
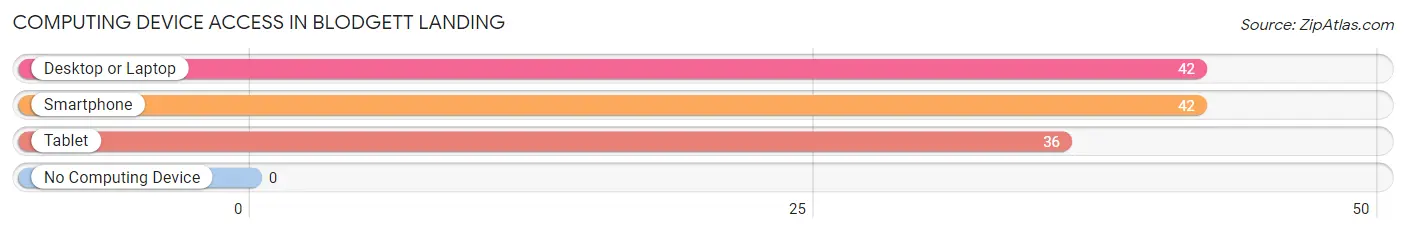
| Device Type | # Households | % Households |
| Desktop or Laptop | 42 | 100.0% |
| Smartphone | 42 | 100.0% |
| Tablet | 36 | 85.7% |
| No Computing Device | 0 | 0.0% |
| Total | 42 | 100.0% |
Internet Access in Blodgett Landing
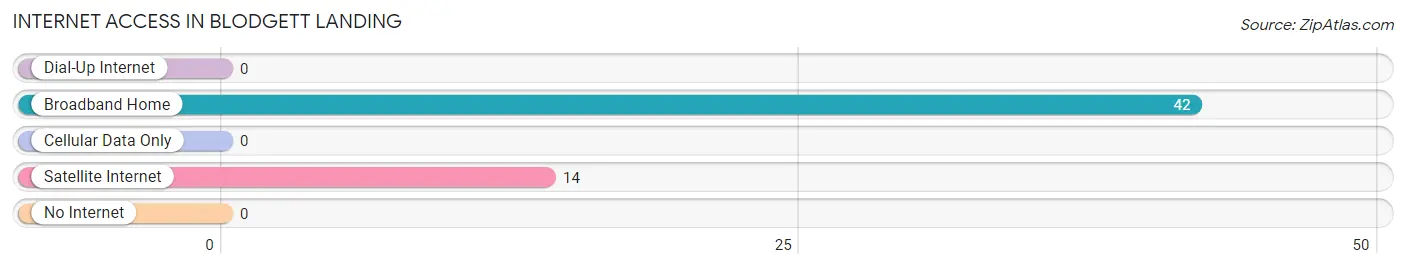
| Internet Type | # Households | % Households |
| Dial-Up Internet | 0 | 0.0% |
| Broadband Home | 42 | 100.0% |
| Cellular Data Only | 0 | 0.0% |
| Satellite Internet | 14 | 33.3% |
| No Internet | 0 | 0.0% |
| Total | 42 | 100.0% |
Blodgett Landing Summary
Blodgett Landing is a small unincorporated community located in the town of Moultonborough, New Hampshire. It is situated on the eastern shore of Lake Winnipesaukee, the largest lake in the state. The community is named after the Blodgett family, who were among the first settlers in the area.
History
The Blodgett family first settled in the area in the late 1700s. The family was originally from Massachusetts and had moved to New Hampshire in search of better land and opportunities. The Blodgetts were among the first settlers in the area and established a small farmstead on the eastern shore of Lake Winnipesaukee. The family built a small dock and began to use the lake for fishing and transportation.
In the early 1800s, the Blodgetts began to build a small village around their farmstead. The village was named Blodgett Landing and became a popular destination for travelers and vacationers. The village was home to a number of businesses, including a general store, a blacksmith, a post office, and a hotel.
In the late 1800s, the village began to decline as the railroad bypassed the area and travelers began to use the train instead of the lake for transportation. The village was eventually abandoned and the buildings were left to decay.
Geography
Blodgett Landing is located on the eastern shore of Lake Winnipesaukee in the town of Moultonborough, New Hampshire. The village is situated on a small peninsula that juts out into the lake. The area is surrounded by forests and is home to a variety of wildlife, including deer, moose, and black bear.
The village is accessible by boat or by car. There is a small public boat launch located in the village, as well as a public beach. The village is also home to a number of hiking trails, including the Blodgett Landing Trail, which is a 3.5-mile loop that takes hikers through the forests and along the shore of the lake.
Economy
The economy of Blodgett Landing is largely based on tourism. The village is a popular destination for vacationers and outdoor enthusiasts, who come to enjoy the lake, the forests, and the wildlife. The village is also home to a number of businesses, including a general store, a marina, and a number of restaurants and lodging options.
Demographics
As of the 2010 census, the population of Blodgett Landing was 545. The population is largely white (97.3%) and the median age is 44. The median household income is $50,000 and the median home value is $250,000. The village is home to a number of seasonal residents, as well as a small number of year-round residents.
Common Questions
What is Per Capita Income in Blodgett Landing?
Per Capita income in Blodgett Landing is $73,142.
What is Inequality or Gini Index in Blodgett Landing?
Inequality or Gini Index in Blodgett Landing is 0.35.
What is the Total Population of Blodgett Landing?
Total Population of Blodgett Landing is 103.
What is the Total Male Population of Blodgett Landing?
Total Male Population of Blodgett Landing is 44.
What is the Total Female Population of Blodgett Landing?
Total Female Population of Blodgett Landing is 59.
What is the Ratio of Males per 100 Females in Blodgett Landing?
There are 74.58 Males per 100 Females in Blodgett Landing.
What is the Ratio of Females per 100 Males in Blodgett Landing?
There are 134.09 Females per 100 Males in Blodgett Landing.
What is the Median Population Age in Blodgett Landing?
Median Population Age in Blodgett Landing is 43.0 Years.
What is the Average Family Size in Blodgett Landing
Average Family Size in Blodgett Landing is 3.8 People.
What is the Average Household Size in Blodgett Landing
Average Household Size in Blodgett Landing is 2.5 People.
How Large is the Labor Force in Blodgett Landing?
There are 66 People in the Labor Forcein in Blodgett Landing.
What is the Percentage of People in the Labor Force in Blodgett Landing?
91.7% of People are in the Labor Force in Blodgett Landing.
What is the Unemployment Rate in Blodgett Landing?
Unemployment Rate in Blodgett Landing is 9.1%.