Tilton Northfield, NH Map & Demographics
Tilton Northfield Map
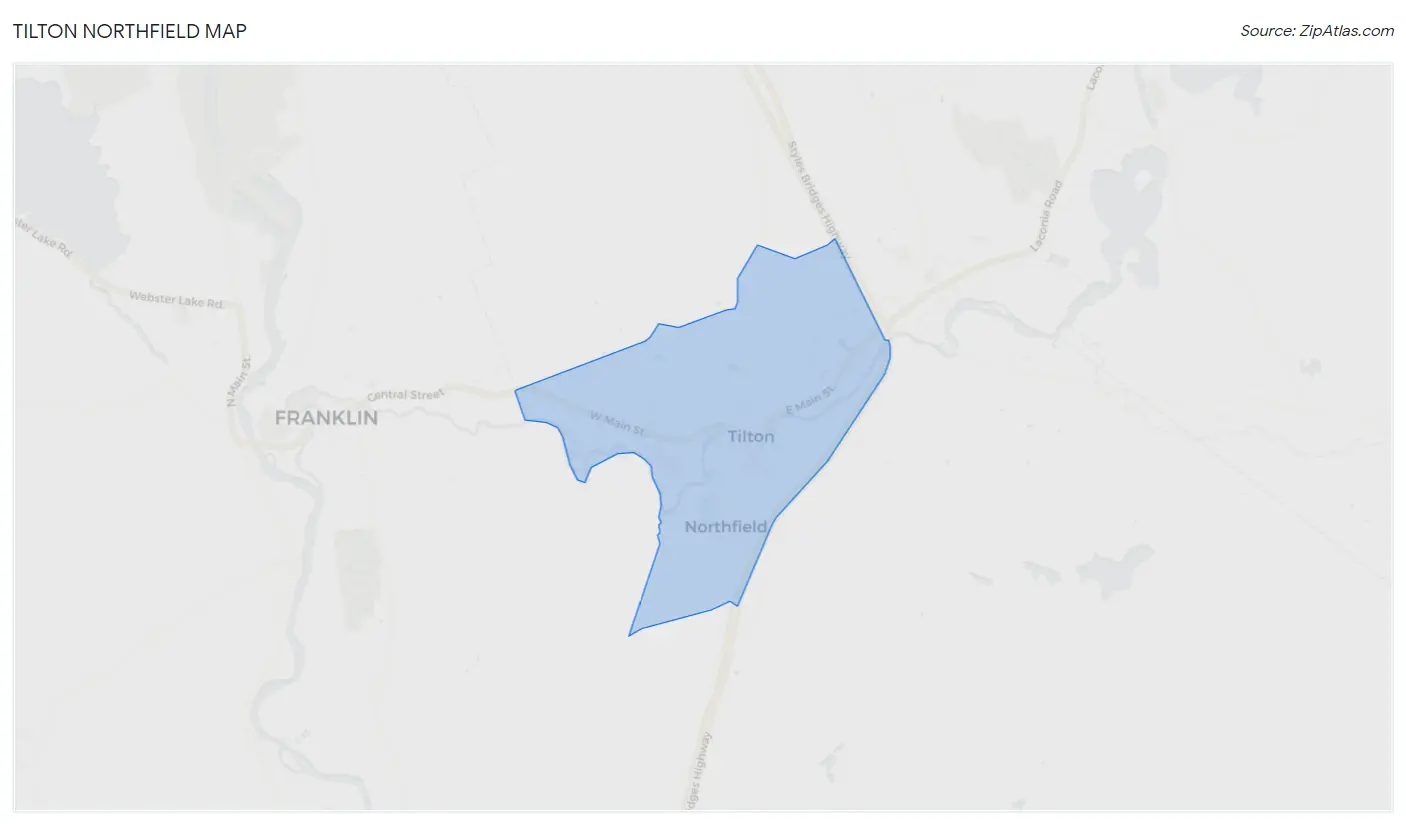
Tilton Northfield Overview
$30,649
PER CAPITA INCOME
$64,250
AVG FAMILY INCOME
$63,553
AVG HOUSEHOLD INCOME
21.0%
WAGE / INCOME GAP [ % ]
79.0¢/ $1
WAGE / INCOME GAP [ $ ]
$4,852
FAMILY INCOME DEFICIT
0.32
INEQUALITY / GINI INDEX
3,035
TOTAL POPULATION
1,473
MALE POPULATION
1,562
FEMALE POPULATION
94.30
MALES / 100 FEMALES
106.04
FEMALES / 100 MALES
46.2
MEDIAN AGE
3.0
AVG FAMILY SIZE
2.2
AVG HOUSEHOLD SIZE
1,621
LABOR FORCE [ PEOPLE ]
63.9%
PERCENT IN LABOR FORCE
1.8%
UNEMPLOYMENT RATE
Income in Tilton Northfield
Income Overview in Tilton Northfield
Per Capita Income in Tilton Northfield is $30,649, while median incomes of families and households are $64,250 and $63,553 respectively.
| Characteristic | Number | Measure |
| Per Capita Income | 3,035 | $30,649 |
| Median Family Income | 673 | $64,250 |
| Mean Family Income | 673 | $75,112 |
| Median Household Income | 1,232 | $63,553 |
| Mean Household Income | 1,232 | $68,722 |
| Income Deficit | 673 | $4,852 |
| Wage / Income Gap (%) | 3,035 | 20.96% |
| Wage / Income Gap ($) | 3,035 | 79.04¢ per $1 |
| Gini / Inequality Index | 3,035 | 0.32 |
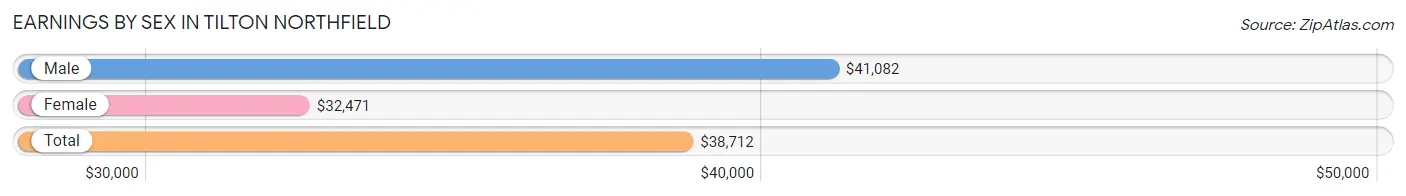
Earnings by Sex in Tilton Northfield
Average Earnings in Tilton Northfield are $38,712, $41,082 for men and $32,471 for women, a difference of 21.0%.
| Sex | Number | Average Earnings |
| Male | 853 (50.5%) | $41,082 |
| Female | 835 (49.5%) | $32,471 |
| Total | 1,688 (100.0%) | $38,712 |
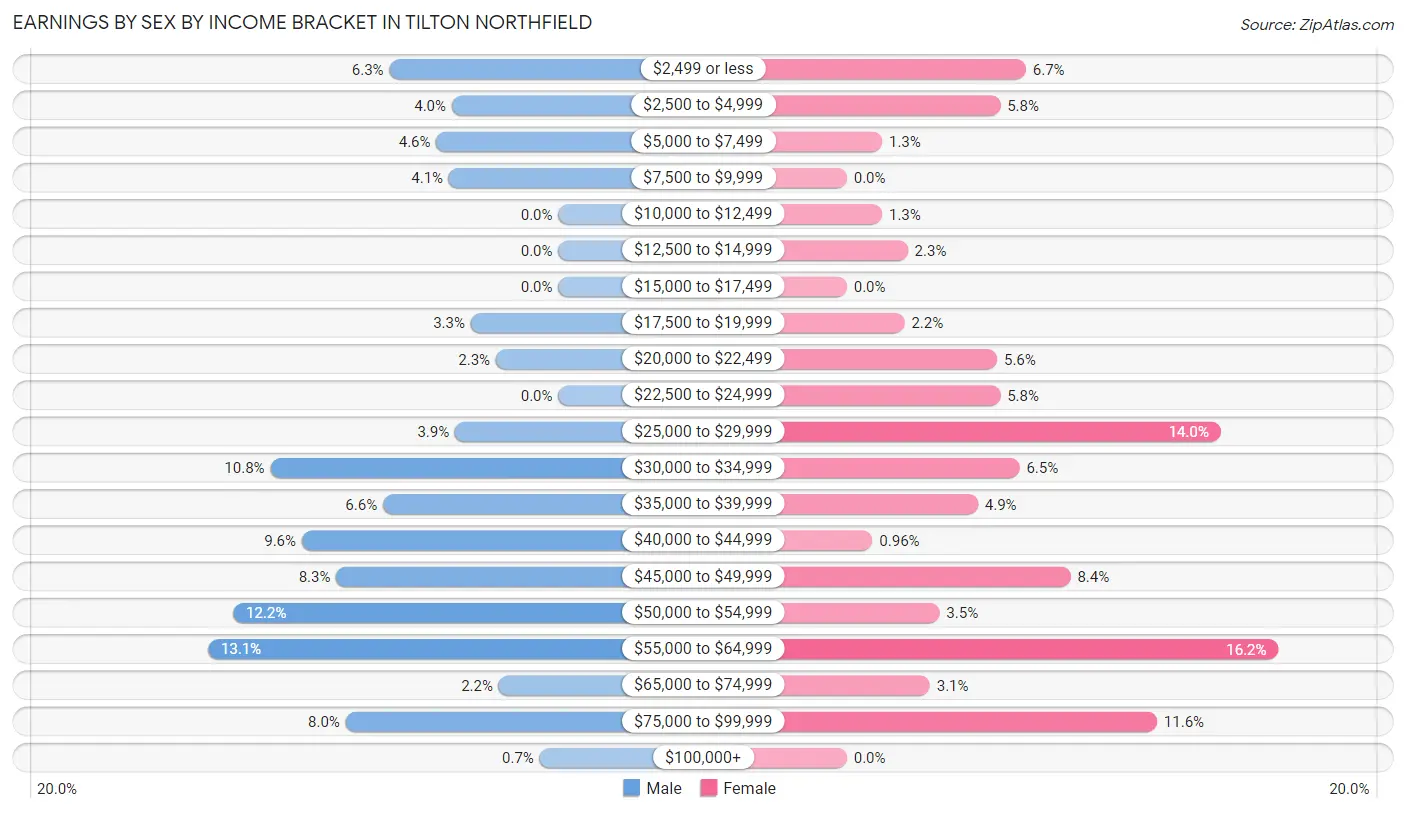
Earnings by Sex by Income Bracket in Tilton Northfield
The most common earnings brackets in Tilton Northfield are $55,000 to $64,999 for men (112 | 13.1%) and $55,000 to $64,999 for women (135 | 16.2%).
| Income | Male | Female |
| $2,499 or less | 54 (6.3%) | 56 (6.7%) |
| $2,500 to $4,999 | 34 (4.0%) | 48 (5.8%) |
| $5,000 to $7,499 | 39 (4.6%) | 11 (1.3%) |
| $7,500 to $9,999 | 35 (4.1%) | 0 (0.0%) |
| $10,000 to $12,499 | 0 (0.0%) | 11 (1.3%) |
| $12,500 to $14,999 | 0 (0.0%) | 19 (2.3%) |
| $15,000 to $17,499 | 0 (0.0%) | 0 (0.0%) |
| $17,500 to $19,999 | 28 (3.3%) | 18 (2.2%) |
| $20,000 to $22,499 | 20 (2.3%) | 47 (5.6%) |
| $22,500 to $24,999 | 0 (0.0%) | 48 (5.8%) |
| $25,000 to $29,999 | 33 (3.9%) | 117 (14.0%) |
| $30,000 to $34,999 | 92 (10.8%) | 54 (6.5%) |
| $35,000 to $39,999 | 56 (6.6%) | 41 (4.9%) |
| $40,000 to $44,999 | 82 (9.6%) | 8 (1.0%) |
| $45,000 to $49,999 | 71 (8.3%) | 70 (8.4%) |
| $50,000 to $54,999 | 104 (12.2%) | 29 (3.5%) |
| $55,000 to $64,999 | 112 (13.1%) | 135 (16.2%) |
| $65,000 to $74,999 | 19 (2.2%) | 26 (3.1%) |
| $75,000 to $99,999 | 68 (8.0%) | 97 (11.6%) |
| $100,000+ | 6 (0.7%) | 0 (0.0%) |
| Total | 853 (100.0%) | 835 (100.0%) |
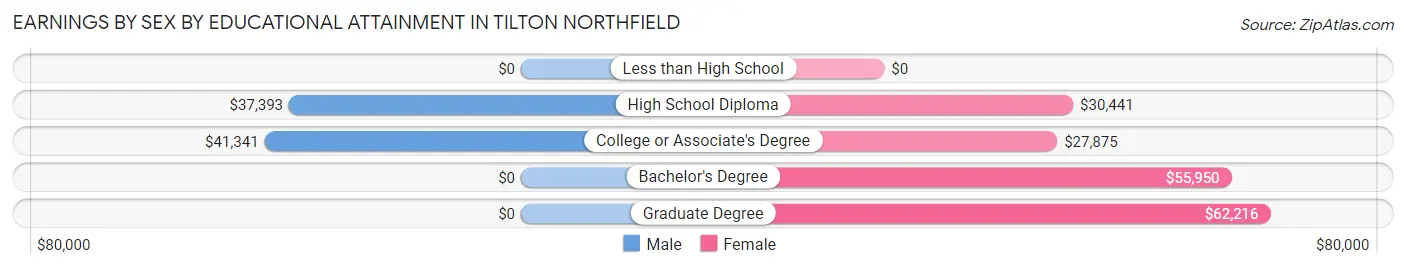
Earnings by Sex by Educational Attainment in Tilton Northfield
Average earnings in Tilton Northfield are $41,545 for men and $35,294 for women, a difference of 15.0%. Men with an educational attainment of college or associate's degree enjoy the highest average annual earnings of $41,341, while those with high school diploma education earn the least with $37,393. Women with an educational attainment of graduate degree earn the most with the average annual earnings of $62,216, while those with college or associate's degree education have the smallest earnings of $27,875.
| Educational Attainment | Male Income | Female Income |
| Less than High School | - | - |
| High School Diploma | $37,393 | $30,441 |
| College or Associate's Degree | $41,341 | $27,875 |
| Bachelor's Degree | - | - |
| Graduate Degree | - | - |
| Total | $41,545 | $35,294 |
Family Income in Tilton Northfield
Family Income Brackets in Tilton Northfield
According to the Tilton Northfield family income data, there are 141 families falling into the $50,000 to $74,999 income range, which is the most common income bracket and makes up 20.9% of all families.
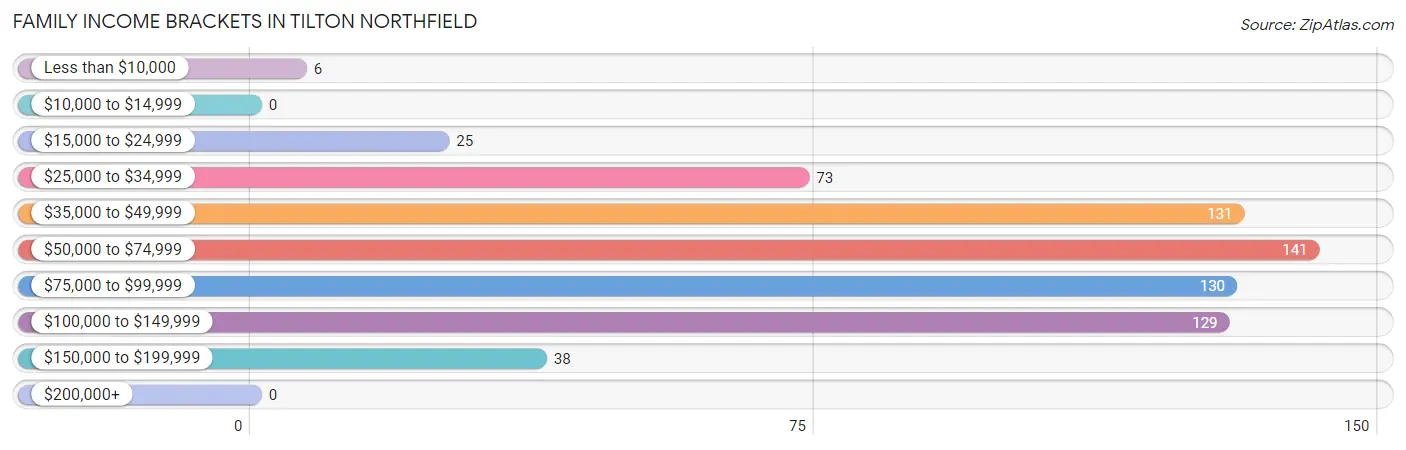
| Income Bracket | # Families | % Families |
| Less than $10,000 | 6 | 0.9% |
| $10,000 to $14,999 | 0 | 0.0% |
| $15,000 to $24,999 | 25 | 3.7% |
| $25,000 to $34,999 | 73 | 10.8% |
| $35,000 to $49,999 | 131 | 19.5% |
| $50,000 to $74,999 | 141 | 21.0% |
| $75,000 to $99,999 | 130 | 19.3% |
| $100,000 to $149,999 | 129 | 19.2% |
| $150,000 to $199,999 | 38 | 5.6% |
| $200,000+ | 0 | 0.0% |
Family Income by Famaliy Size in Tilton Northfield
2-person families (410 | 60.9%) account for the highest median family income in Tilton Northfield with $62,721 per family, while 2-person families (410 | 60.9%) have the highest median income of $31,360 per family member.
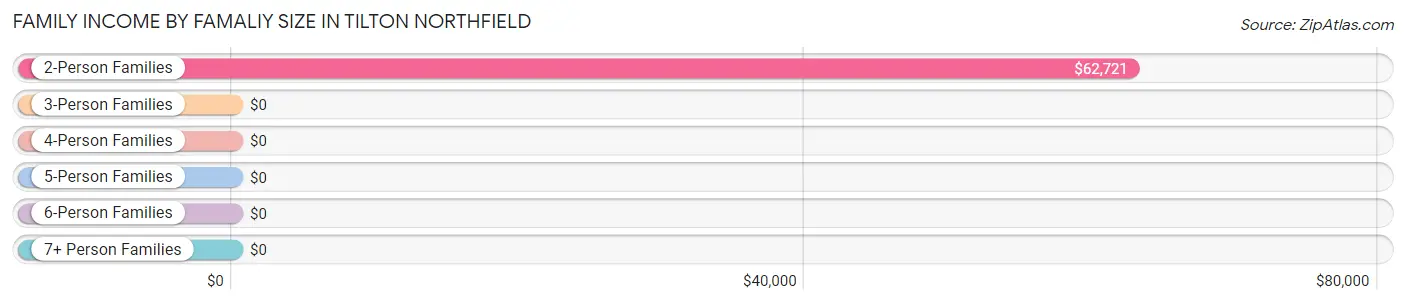
| Income Bracket | # Families | Median Income |
| 2-Person Families | 410 (60.9%) | $62,721 |
| 3-Person Families | 83 (12.3%) | $0 |
| 4-Person Families | 127 (18.9%) | $0 |
| 5-Person Families | 22 (3.3%) | $0 |
| 6-Person Families | 4 (0.6%) | $0 |
| 7+ Person Families | 27 (4.0%) | $0 |
| Total | 673 (100.0%) | $64,250 |
Family Income by Number of Earners in Tilton Northfield
The median family income in Tilton Northfield is $64,250, with families comprising 3+ earners (81) having the highest median family income of $105,787, while families with no earners (94) have the lowest median family income of $39,050, accounting for 12.0% and 14.0% of families, respectively.
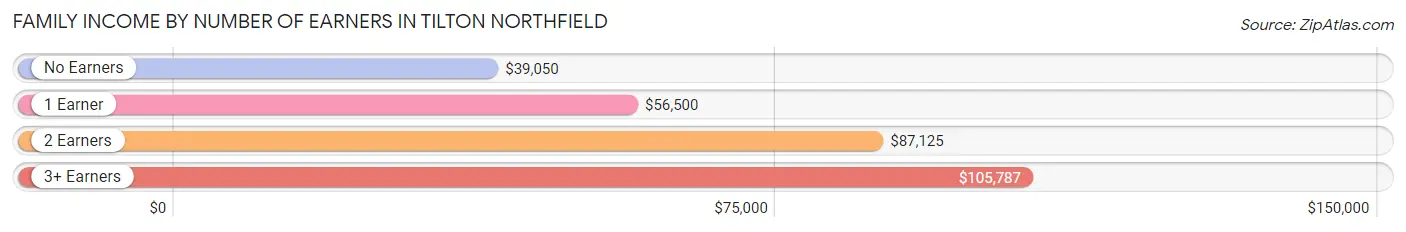
| Number of Earners | # Families | Median Income |
| No Earners | 94 (14.0%) | $39,050 |
| 1 Earner | 260 (38.6%) | $56,500 |
| 2 Earners | 238 (35.4%) | $87,125 |
| 3+ Earners | 81 (12.0%) | $105,787 |
| Total | 673 (100.0%) | $64,250 |
Household Income in Tilton Northfield
Household Income Brackets in Tilton Northfield
With 297 households falling in the category, the $50,000 to $74,999 income range is the most frequent in Tilton Northfield, accounting for 24.1% of all households.
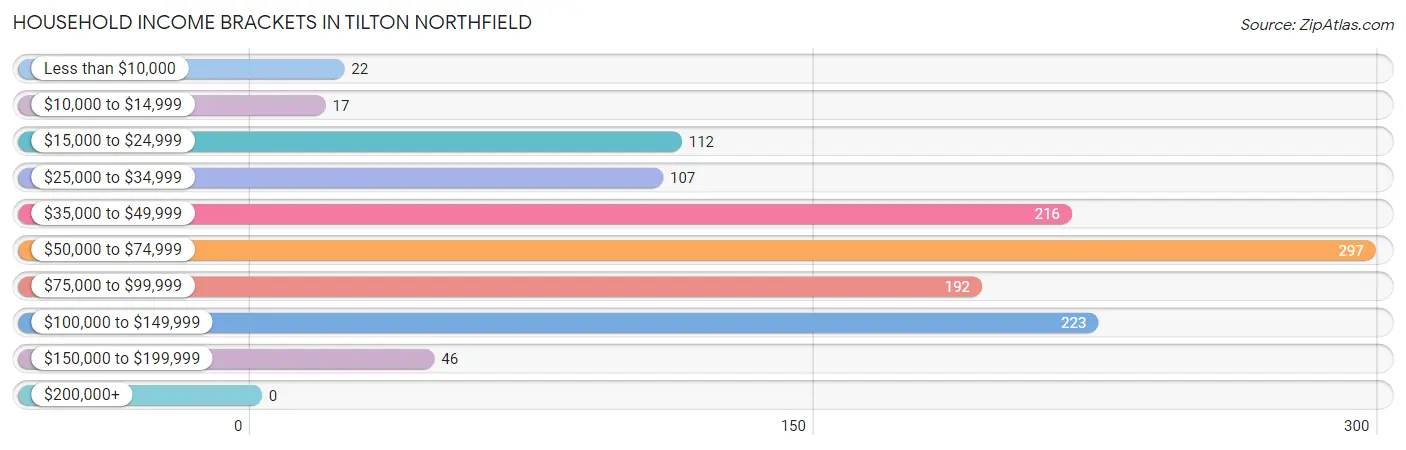
| Income Bracket | # Households | % Households |
| Less than $10,000 | 22 | 1.8% |
| $10,000 to $14,999 | 17 | 1.4% |
| $15,000 to $24,999 | 112 | 9.1% |
| $25,000 to $34,999 | 107 | 8.7% |
| $35,000 to $49,999 | 216 | 17.5% |
| $50,000 to $74,999 | 297 | 24.1% |
| $75,000 to $99,999 | 192 | 15.6% |
| $100,000 to $149,999 | 223 | 18.1% |
| $150,000 to $199,999 | 46 | 3.7% |
| $200,000+ | 0 | 0.0% |
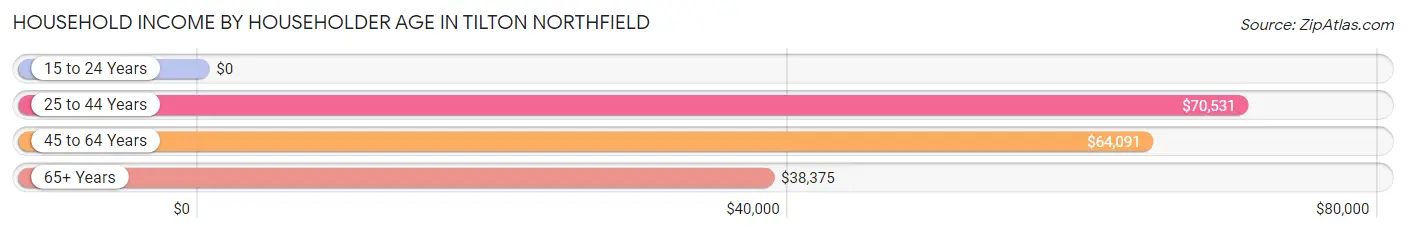
Household Income by Householder Age in Tilton Northfield
The median household income in Tilton Northfield is $63,553, with the highest median household income of $70,531 found in the 25 to 44 years age bracket for the primary householder. A total of 407 households (33.0%) fall into this category. Meanwhile, the 15 to 24 years age bracket for the primary householder has the lowest median household income of $0, with 12 households (1.0%) in this group.
| Income Bracket | # Households | Median Income |
| 15 to 24 Years | 12 (1.0%) | $0 |
| 25 to 44 Years | 407 (33.0%) | $70,531 |
| 45 to 64 Years | 422 (34.3%) | $64,091 |
| 65+ Years | 391 (31.7%) | $38,375 |
| Total | 1,232 (100.0%) | $63,553 |
Poverty in Tilton Northfield
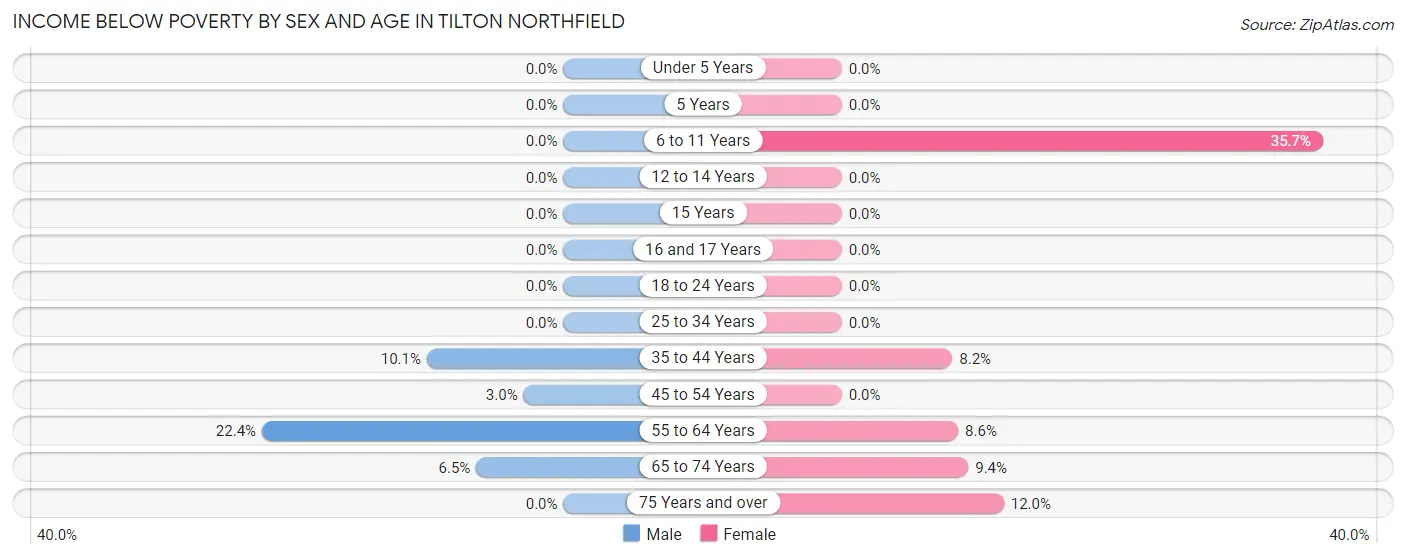
Income Below Poverty by Sex and Age in Tilton Northfield
With 4.7% poverty level for males and 6.1% for females among the residents of Tilton Northfield, 55 to 64 year old males and 6 to 11 year old females are the most vulnerable to poverty, with 32 males (22.4%) and 20 females (35.7%) in their respective age groups living below the poverty level.
| Age Bracket | Male | Female |
| Under 5 Years | 0 (0.0%) | 0 (0.0%) |
| 5 Years | 0 (0.0%) | 0 (0.0%) |
| 6 to 11 Years | 0 (0.0%) | 20 (35.7%) |
| 12 to 14 Years | 0 (0.0%) | 0 (0.0%) |
| 15 Years | 0 (0.0%) | 0 (0.0%) |
| 16 and 17 Years | 0 (0.0%) | 0 (0.0%) |
| 18 to 24 Years | 0 (0.0%) | 0 (0.0%) |
| 25 to 34 Years | 0 (0.0%) | 0 (0.0%) |
| 35 to 44 Years | 15 (10.1%) | 16 (8.2%) |
| 45 to 54 Years | 4 (3.0%) | 0 (0.0%) |
| 55 to 64 Years | 32 (22.4%) | 21 (8.6%) |
| 65 to 74 Years | 9 (6.5%) | 20 (9.4%) |
| 75 Years and over | 0 (0.0%) | 16 (12.0%) |
| Total | 60 (4.7%) | 93 (6.1%) |
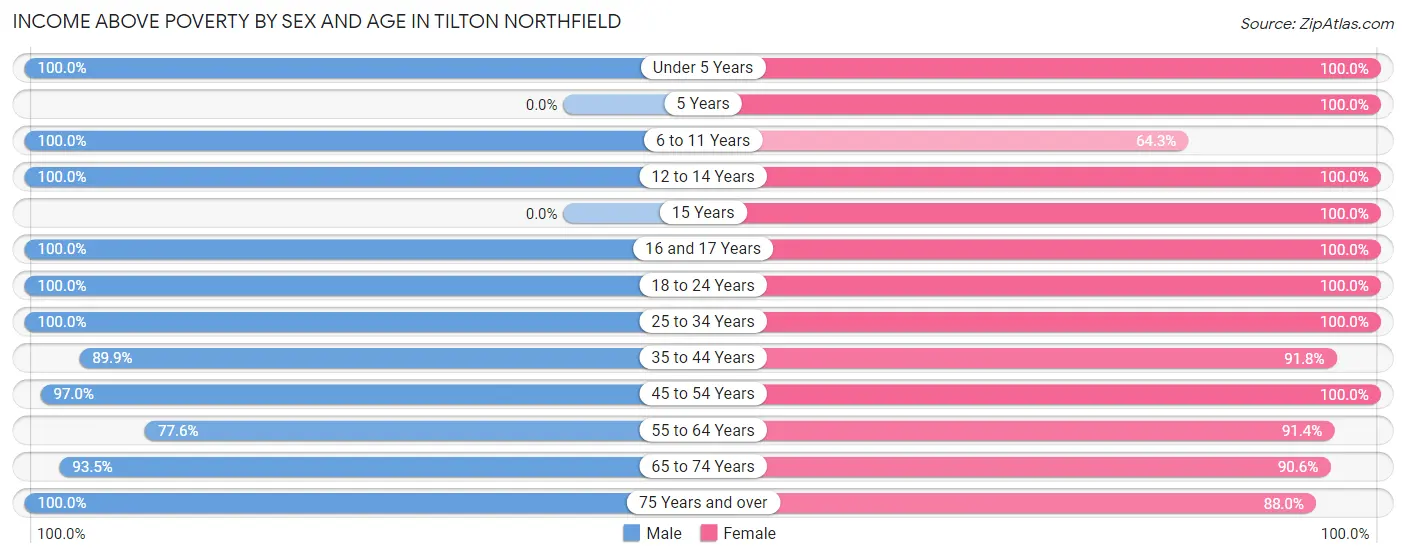
Income Above Poverty by Sex and Age in Tilton Northfield
According to the poverty statistics in Tilton Northfield, males aged under 5 years and females aged under 5 years are the age groups that are most secure financially, with 100.0% of males and 100.0% of females in these age groups living above the poverty line.
| Age Bracket | Male | Female |
| Under 5 Years | 142 (100.0%) | 47 (100.0%) |
| 5 Years | 0 (0.0%) | 54 (100.0%) |
| 6 to 11 Years | 35 (100.0%) | 36 (64.3%) |
| 12 to 14 Years | 46 (100.0%) | 104 (100.0%) |
| 15 Years | 0 (0.0%) | 14 (100.0%) |
| 16 and 17 Years | 17 (100.0%) | 22 (100.0%) |
| 18 to 24 Years | 93 (100.0%) | 57 (100.0%) |
| 25 to 34 Years | 279 (100.0%) | 195 (100.0%) |
| 35 to 44 Years | 133 (89.9%) | 179 (91.8%) |
| 45 to 54 Years | 131 (97.0%) | 201 (100.0%) |
| 55 to 64 Years | 111 (77.6%) | 222 (91.4%) |
| 65 to 74 Years | 130 (93.5%) | 193 (90.6%) |
| 75 Years and over | 98 (100.0%) | 117 (88.0%) |
| Total | 1,215 (95.3%) | 1,441 (93.9%) |
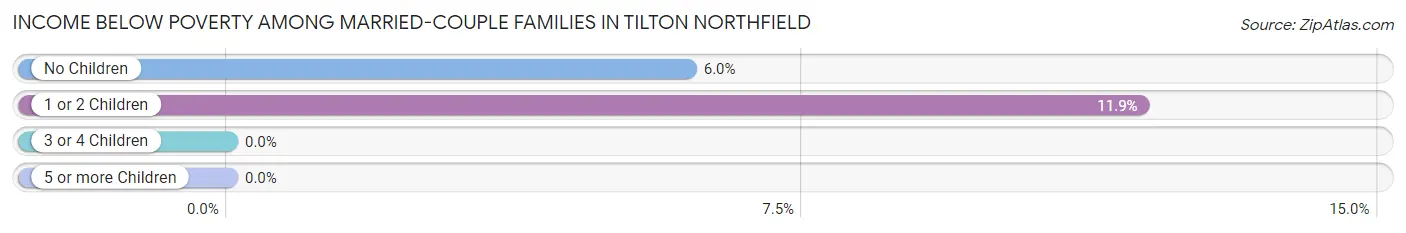
Income Below Poverty Among Married-Couple Families in Tilton Northfield
The poverty statistics for married-couple families in Tilton Northfield show that 7.4% or 31 of the total 419 families live below the poverty line. Families with 1 or 2 children have the highest poverty rate of 11.9%, comprising of 15 families. On the other hand, families with 3 or 4 children have the lowest poverty rate of 0.0%, which includes 0 families.
| Children | Above Poverty | Below Poverty |
| No Children | 251 (94.0%) | 16 (6.0%) |
| 1 or 2 Children | 111 (88.1%) | 15 (11.9%) |
| 3 or 4 Children | 26 (100.0%) | 0 (0.0%) |
| 5 or more Children | 0 (0.0%) | 0 (0.0%) |
| Total | 388 (92.6%) | 31 (7.4%) |
Income Below Poverty Among Single-Parent Households in Tilton Northfield
| Children | Single Father | Single Mother |
| No Children | 0 (0.0%) | 0 (0.0%) |
| 1 or 2 Children | 0 (0.0%) | 0 (0.0%) |
| 3 or 4 Children | 0 (0.0%) | 0 (0.0%) |
| 5 or more Children | 0 (0.0%) | 0 (0.0%) |
| Total | 0 (0.0%) | 0 (0.0%) |
Income Below Poverty Among Married-Couple vs Single-Parent Households in Tilton Northfield
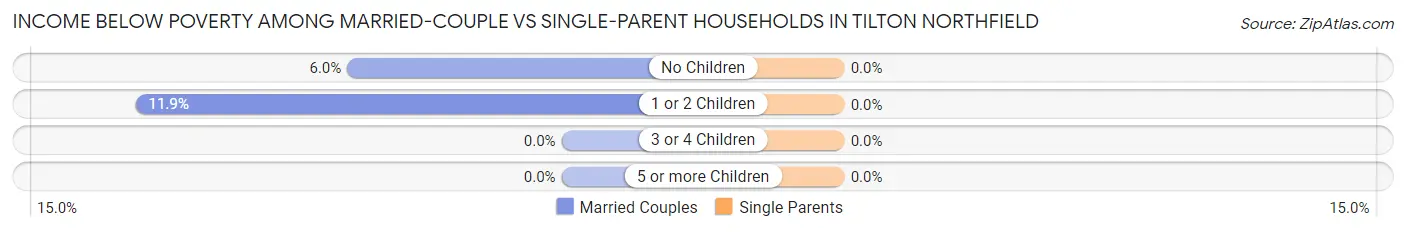
| Children | Married-Couple Families | Single-Parent Households |
| No Children | 16 (6.0%) | 0 (0.0%) |
| 1 or 2 Children | 15 (11.9%) | 0 (0.0%) |
| 3 or 4 Children | 0 (0.0%) | 0 (0.0%) |
| 5 or more Children | 0 (0.0%) | 0 (0.0%) |
| Total | 31 (7.4%) | 0 (0.0%) |
Race in Tilton Northfield
The most populous races in Tilton Northfield are White / Caucasian (2,897 | 95.5%), Two or more Races (85 | 2.8%), and Black / African American (49 | 1.6%).
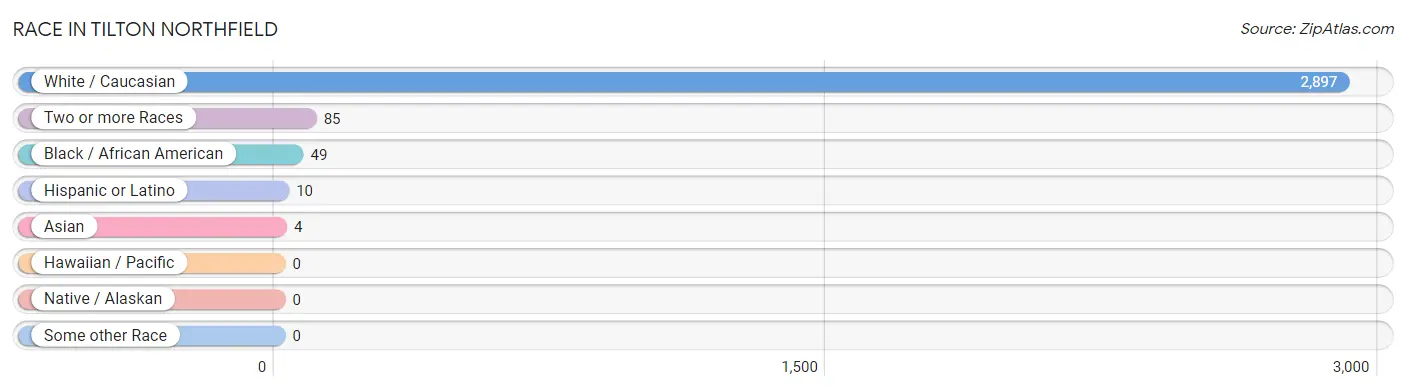
| Race | # Population | % Population |
| Asian | 4 | 0.1% |
| Black / African American | 49 | 1.6% |
| Hawaiian / Pacific | 0 | 0.0% |
| Hispanic or Latino | 10 | 0.3% |
| Native / Alaskan | 0 | 0.0% |
| White / Caucasian | 2,897 | 95.5% |
| Two or more Races | 85 | 2.8% |
| Some other Race | 0 | 0.0% |
| Total | 3,035 | 100.0% |
Ancestry in Tilton Northfield
The most populous ancestries reported in Tilton Northfield are English (720 | 23.7%), Irish (528 | 17.4%), French Canadian (439 | 14.5%), French (347 | 11.4%), and German (267 | 8.8%), together accounting for 75.8% of all Tilton Northfield residents.
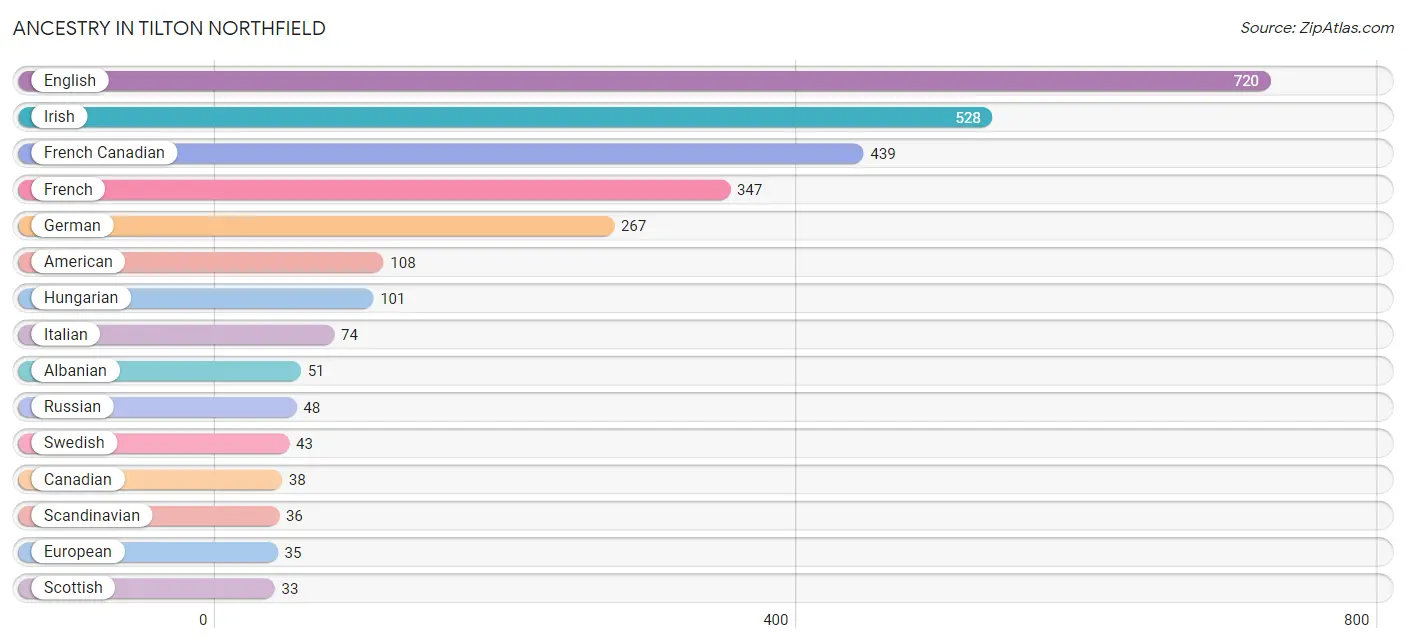
| Ancestry | # Population | % Population |
| Albanian | 51 | 1.7% |
| American | 108 | 3.6% |
| Canadian | 38 | 1.3% |
| English | 720 | 23.7% |
| European | 35 | 1.1% |
| French | 347 | 11.4% |
| French Canadian | 439 | 14.5% |
| German | 267 | 8.8% |
| Greek | 24 | 0.8% |
| Hungarian | 101 | 3.3% |
| Irish | 528 | 17.4% |
| Italian | 74 | 2.4% |
| Jamaican | 23 | 0.8% |
| Korean | 4 | 0.1% |
| Norwegian | 32 | 1.1% |
| Polish | 6 | 0.2% |
| Portuguese | 19 | 0.6% |
| Russian | 48 | 1.6% |
| Samoan | 8 | 0.3% |
| Scandinavian | 36 | 1.2% |
| Scotch-Irish | 29 | 1.0% |
| Scottish | 33 | 1.1% |
| Slovene | 5 | 0.2% |
| Spaniard | 10 | 0.3% |
| Swedish | 43 | 1.4% |
| Swiss | 26 | 0.9% |
| Welsh | 9 | 0.3% | View All 27 Rows |
Immigrants in Tilton Northfield
The most numerous immigrant groups reported in Tilton Northfield came from Eastern Europe (51 | 1.7%), Europe (51 | 1.7%), North Macedonia (51 | 1.7%), Caribbean (11 | 0.4%), and Jamaica (11 | 0.4%), together accounting for 5.8% of all Tilton Northfield residents.
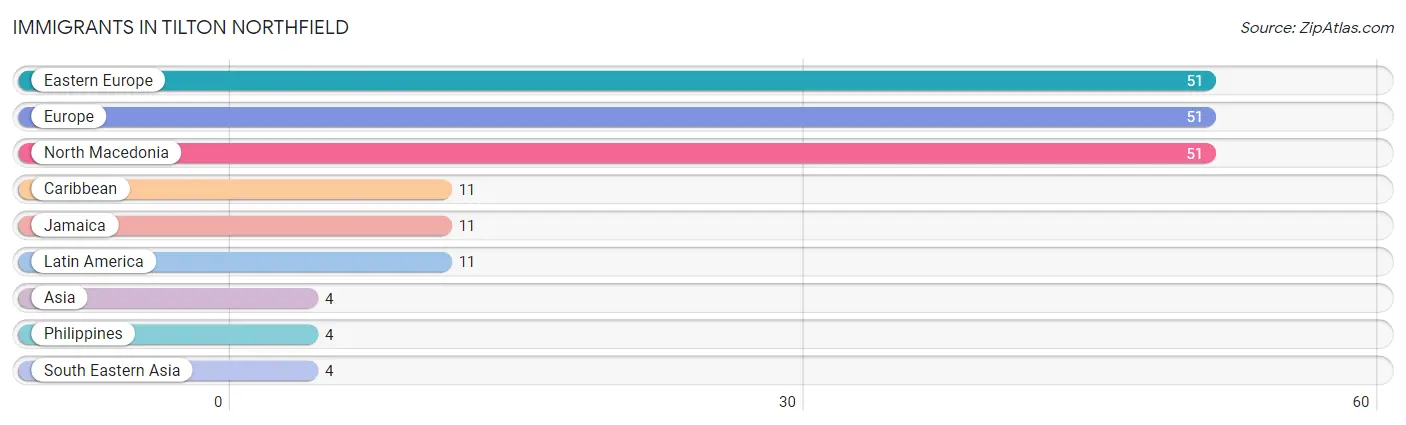
| Immigration Origin | # Population | % Population |
| Asia | 4 | 0.1% |
| Caribbean | 11 | 0.4% |
| Eastern Europe | 51 | 1.7% |
| Europe | 51 | 1.7% |
| Jamaica | 11 | 0.4% |
| Latin America | 11 | 0.4% |
| North Macedonia | 51 | 1.7% |
| Philippines | 4 | 0.1% |
| South Eastern Asia | 4 | 0.1% | View All 9 Rows |
Sex and Age in Tilton Northfield
Sex and Age in Tilton Northfield
The most populous age groups in Tilton Northfield are 25 to 29 Years (157 | 10.7%) for men and 25 to 29 Years (168 | 10.8%) for women.
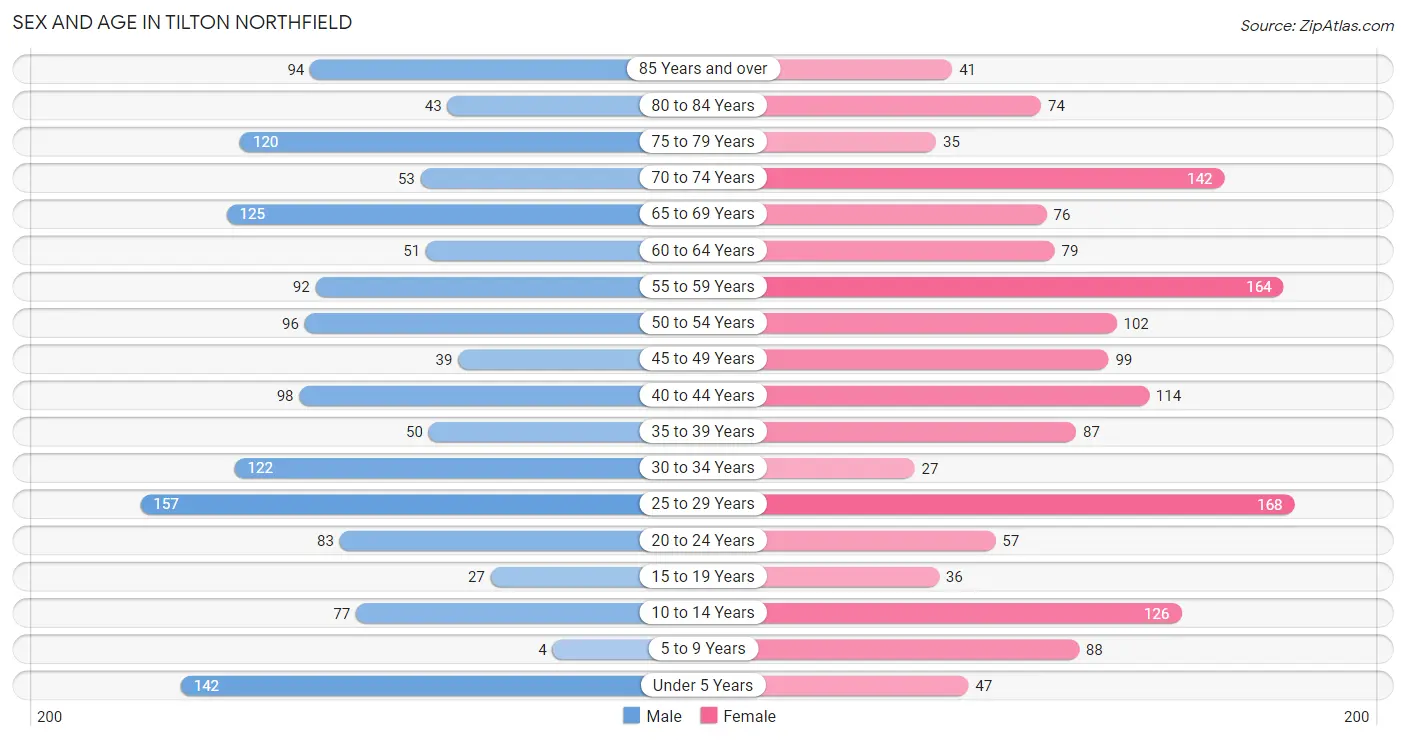
| Age Bracket | Male | Female |
| Under 5 Years | 142 (9.6%) | 47 (3.0%) |
| 5 to 9 Years | 4 (0.3%) | 88 (5.6%) |
| 10 to 14 Years | 77 (5.2%) | 126 (8.1%) |
| 15 to 19 Years | 27 (1.8%) | 36 (2.3%) |
| 20 to 24 Years | 83 (5.6%) | 57 (3.6%) |
| 25 to 29 Years | 157 (10.7%) | 168 (10.8%) |
| 30 to 34 Years | 122 (8.3%) | 27 (1.7%) |
| 35 to 39 Years | 50 (3.4%) | 87 (5.6%) |
| 40 to 44 Years | 98 (6.7%) | 114 (7.3%) |
| 45 to 49 Years | 39 (2.6%) | 99 (6.3%) |
| 50 to 54 Years | 96 (6.5%) | 102 (6.5%) |
| 55 to 59 Years | 92 (6.2%) | 164 (10.5%) |
| 60 to 64 Years | 51 (3.5%) | 79 (5.1%) |
| 65 to 69 Years | 125 (8.5%) | 76 (4.9%) |
| 70 to 74 Years | 53 (3.6%) | 142 (9.1%) |
| 75 to 79 Years | 120 (8.2%) | 35 (2.2%) |
| 80 to 84 Years | 43 (2.9%) | 74 (4.7%) |
| 85 Years and over | 94 (6.4%) | 41 (2.6%) |
| Total | 1,473 (100.0%) | 1,562 (100.0%) |
Families and Households in Tilton Northfield
Median Family Size in Tilton Northfield
The median family size in Tilton Northfield is 2.97 persons per family, with single male/father families (21 | 3.1%) accounting for the largest median family size of 4.05 persons per family. On the other hand, married-couple families (419 | 62.3%) represent the smallest median family size with 2.81 persons per family.
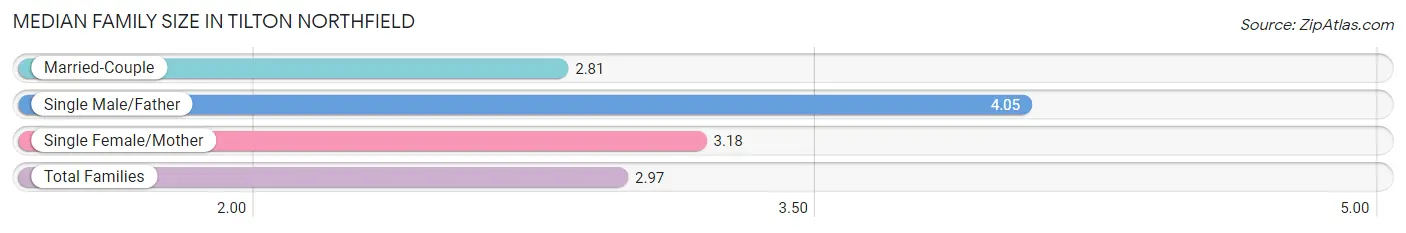
| Family Type | # Families | Family Size |
| Married-Couple | 419 (62.3%) | 2.81 |
| Single Male/Father | 21 (3.1%) | 4.05 |
| Single Female/Mother | 233 (34.6%) | 3.18 |
| Total Families | 673 (100.0%) | 2.97 |
Median Household Size in Tilton Northfield
The median household size in Tilton Northfield is 2.23 persons per household, with single male/father households (21 | 1.7%) accounting for the largest median household size of 4.52 persons per household. non-family households (559 | 45.4%) represent the smallest median household size with 1.23 persons per household.
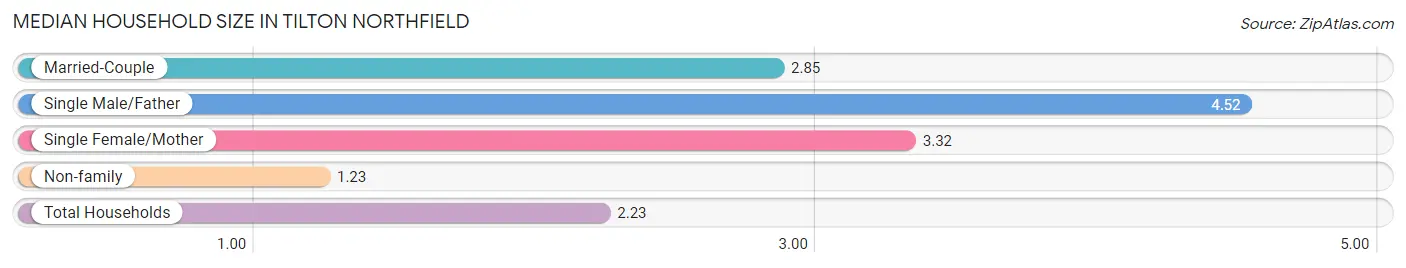
| Household Type | # Households | Household Size |
| Married-Couple | 419 (34.0%) | 2.85 |
| Single Male/Father | 21 (1.7%) | 4.52 |
| Single Female/Mother | 233 (18.9%) | 3.32 |
| Non-family | 559 (45.4%) | 1.23 |
| Total Households | 1,232 (100.0%) | 2.23 |
Household Size by Marriage Status in Tilton Northfield
Out of a total of 1,232 households in Tilton Northfield, 673 (54.6%) are family households, while 559 (45.4%) are nonfamily households. The most numerous type of family households are 2-person households, comprising 362, and the most common type of nonfamily households are 1-person households, comprising 459.
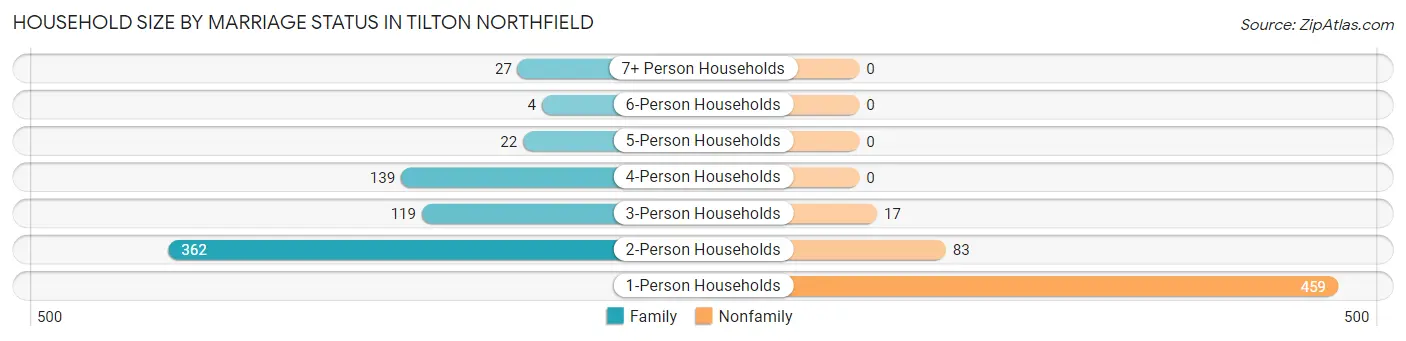
| Household Size | Family Households | Nonfamily Households |
| 1-Person Households | - | 459 (37.3%) |
| 2-Person Households | 362 (29.4%) | 83 (6.7%) |
| 3-Person Households | 119 (9.7%) | 17 (1.4%) |
| 4-Person Households | 139 (11.3%) | 0 (0.0%) |
| 5-Person Households | 22 (1.8%) | 0 (0.0%) |
| 6-Person Households | 4 (0.3%) | 0 (0.0%) |
| 7+ Person Households | 27 (2.2%) | 0 (0.0%) |
| Total | 673 (54.6%) | 559 (45.4%) |
Female Fertility in Tilton Northfield
Fertility by Age in Tilton Northfield
Average fertility rate in Tilton Northfield is 39.0 births per 1,000 women. Women in the age bracket of 35 to 50 years have the highest fertility rate with 72.0 births per 1,000 women. Women in the age bracket of 35 to 50 years acount for 100.0% of all women with births.
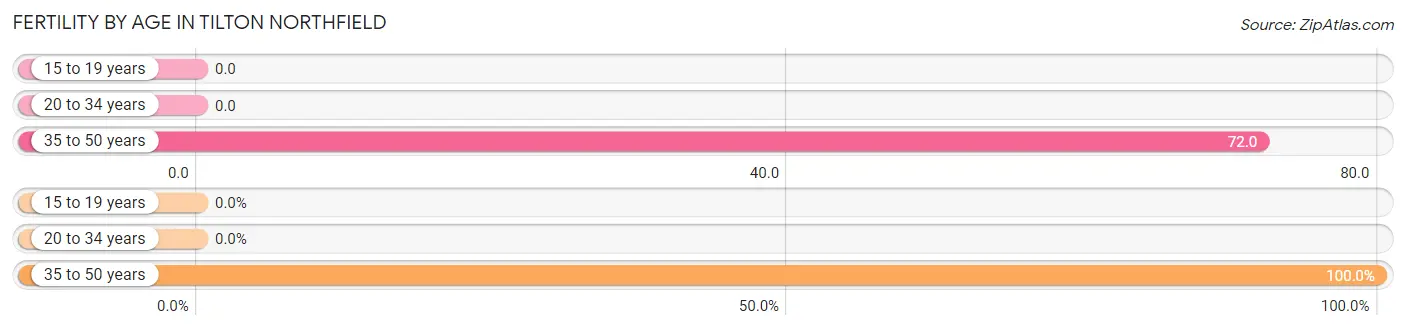
| Age Bracket | Women with Births | Births / 1,000 Women |
| 15 to 19 years | 0 (0.0%) | 0.0 |
| 20 to 34 years | 0 (0.0%) | 0.0 |
| 35 to 50 years | 25 (100.0%) | 72.0 |
| Total | 25 (100.0%) | 39.0 |
Fertility by Age by Marriage Status in Tilton Northfield
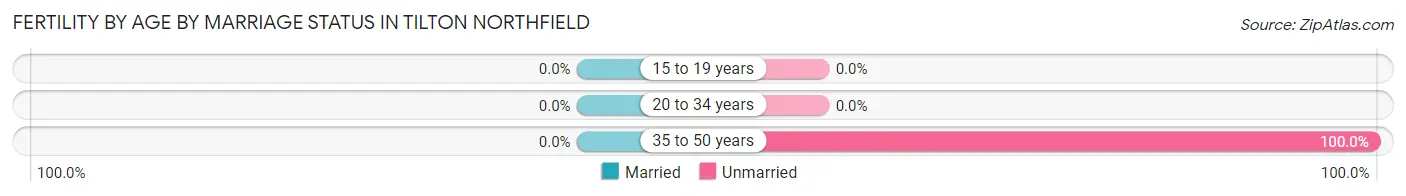
| Age Bracket | Married | Unmarried |
| 15 to 19 years | 0 (0.0%) | 0 (0.0%) |
| 20 to 34 years | 0 (0.0%) | 0 (0.0%) |
| 35 to 50 years | 0 (0.0%) | 25 (100.0%) |
| Total | 0 (0.0%) | 25 (100.0%) |
Fertility by Education in Tilton Northfield
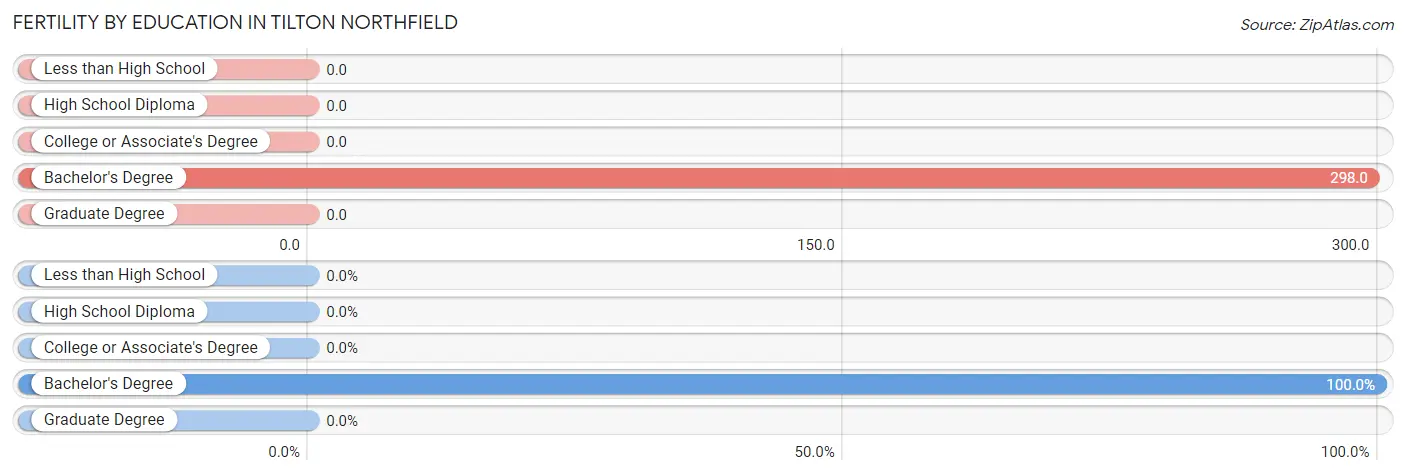
| Educational Attainment | Women with Births | Births / 1,000 Women |
| Less than High School | 0 (0.0%) | 0.0 |
| High School Diploma | 0 (0.0%) | 0.0 |
| College or Associate's Degree | 0 (0.0%) | 0.0 |
| Bachelor's Degree | 25 (100.0%) | 298.0 |
| Graduate Degree | 0 (0.0%) | 0.0 |
| Total | 25 (100.0%) | 39.0 |
Fertility by Education by Marriage Status in Tilton Northfield
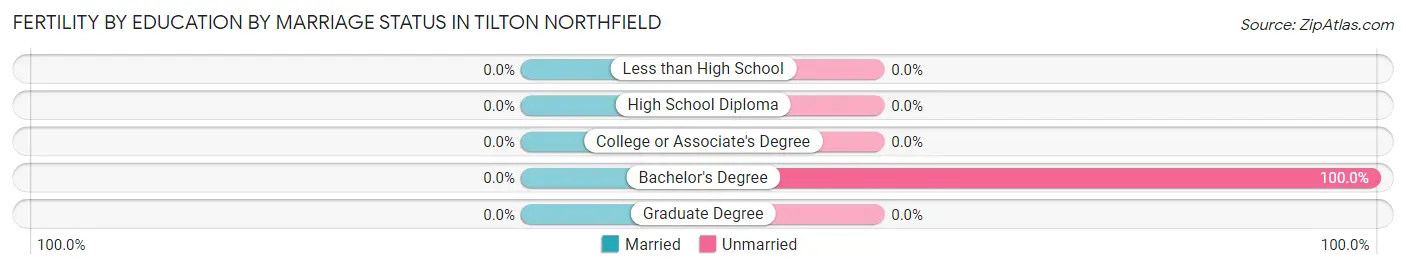
| Educational Attainment | Married | Unmarried |
| Less than High School | 0 (0.0%) | 0 (0.0%) |
| High School Diploma | 0 (0.0%) | 0 (0.0%) |
| College or Associate's Degree | 0 (0.0%) | 0 (0.0%) |
| Bachelor's Degree | 0 (0.0%) | 25 (100.0%) |
| Graduate Degree | 0 (0.0%) | 0 (0.0%) |
| Total | 0 (0.0%) | 25 (100.0%) |
Employment Characteristics in Tilton Northfield
Employment by Class of Employer in Tilton Northfield
Among the 1,549 employed individuals in Tilton Northfield, private company employees (1,008 | 65.1%), not-for-profit organizations (234 | 15.1%), and state government employees (107 | 6.9%) make up the most common classes of employment.
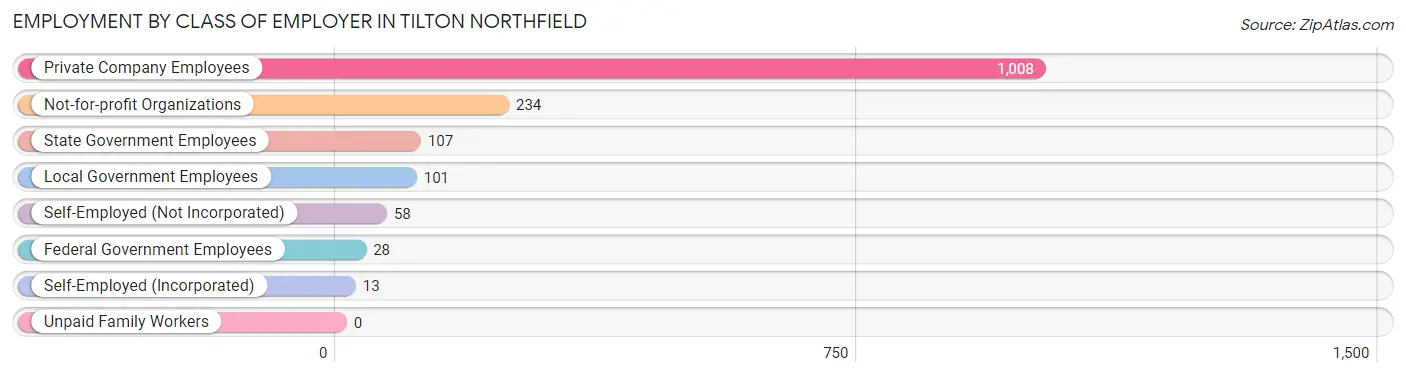
| Employer Class | # Employees | % Employees |
| Private Company Employees | 1,008 | 65.1% |
| Self-Employed (Incorporated) | 13 | 0.8% |
| Self-Employed (Not Incorporated) | 58 | 3.7% |
| Not-for-profit Organizations | 234 | 15.1% |
| Local Government Employees | 101 | 6.5% |
| State Government Employees | 107 | 6.9% |
| Federal Government Employees | 28 | 1.8% |
| Unpaid Family Workers | 0 | 0.0% |
| Total | 1,549 | 100.0% |
Employment Status by Age in Tilton Northfield
According to the labor force statistics for Tilton Northfield, out of the total population over 16 years of age (2,537), 63.9% or 1,621 individuals are in the labor force, with 1.8% or 29 of them unemployed. The age group with the highest labor force participation rate is 60 to 64 years, with 100.0% or 130 individuals in the labor force. Within the labor force, the 55 to 59 years age range has the highest percentage of unemployed individuals, with 5.9% or 11 of them being unemployed.
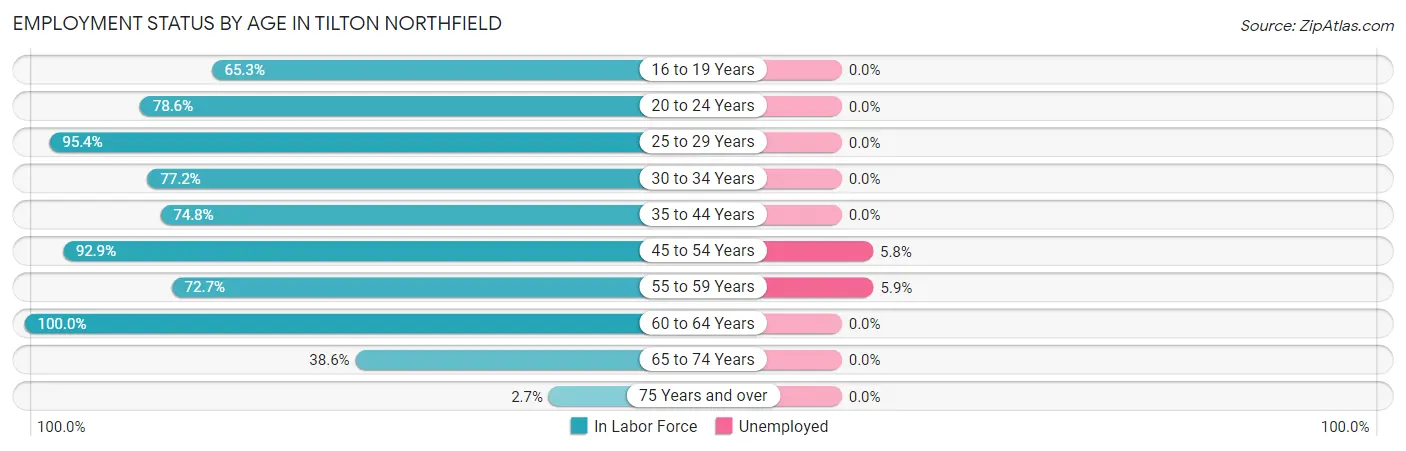
| Age Bracket | In Labor Force | Unemployed |
| 16 to 19 Years | 32 (65.3%) | 0 (0.0%) |
| 20 to 24 Years | 110 (78.6%) | 0 (0.0%) |
| 25 to 29 Years | 310 (95.4%) | 0 (0.0%) |
| 30 to 34 Years | 115 (77.2%) | 0 (0.0%) |
| 35 to 44 Years | 261 (74.8%) | 0 (0.0%) |
| 45 to 54 Years | 312 (92.9%) | 18 (5.8%) |
| 55 to 59 Years | 186 (72.7%) | 11 (5.9%) |
| 60 to 64 Years | 130 (100.0%) | 0 (0.0%) |
| 65 to 74 Years | 153 (38.6%) | 0 (0.0%) |
| 75 Years and over | 11 (2.7%) | 0 (0.0%) |
| Total | 1,621 (63.9%) | 29 (1.8%) |
Employment Status by Educational Attainment in Tilton Northfield
According to labor force statistics for Tilton Northfield, 85.0% of individuals (1,313) out of the total population between 25 and 64 years of age (1,545) are in the labor force, with 2.2% or 29 of them being unemployed. The group with the highest labor force participation rate are those with the educational attainment of bachelor's degree or higher, with 94.4% or 334 individuals in the labor force. Within the labor force, individuals with less than high school education have the highest percentage of unemployment, with 27.8% or 10 of them being unemployed.
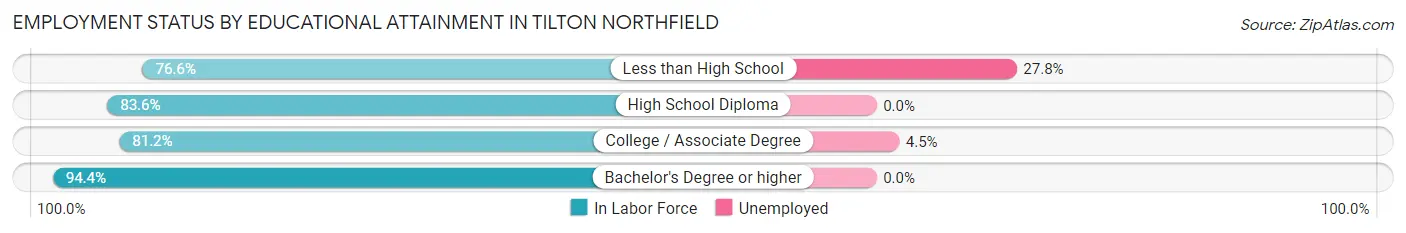
| Educational Attainment | In Labor Force | Unemployed |
| Less than High School | 36 (76.6%) | 13 (27.8%) |
| High School Diploma | 521 (83.6%) | 0 (0.0%) |
| College / Associate Degree | 423 (81.2%) | 23 (4.5%) |
| Bachelor's Degree or higher | 334 (94.4%) | 0 (0.0%) |
| Total | 1,313 (85.0%) | 34 (2.2%) |
Employment Occupations by Sex in Tilton Northfield
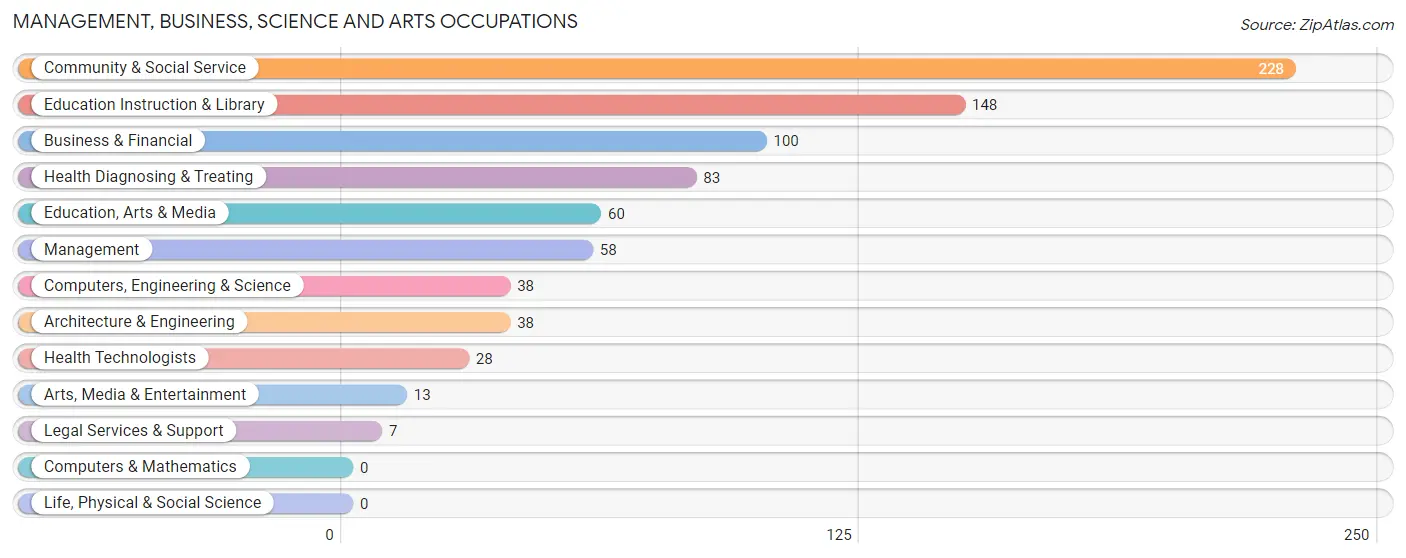
Management, Business, Science and Arts Occupations
The most common Management, Business, Science and Arts occupations in Tilton Northfield are Community & Social Service (228 | 14.3%), Education Instruction & Library (148 | 9.3%), Business & Financial (100 | 6.3%), Health Diagnosing & Treating (83 | 5.2%), and Education, Arts & Media (60 | 3.8%).
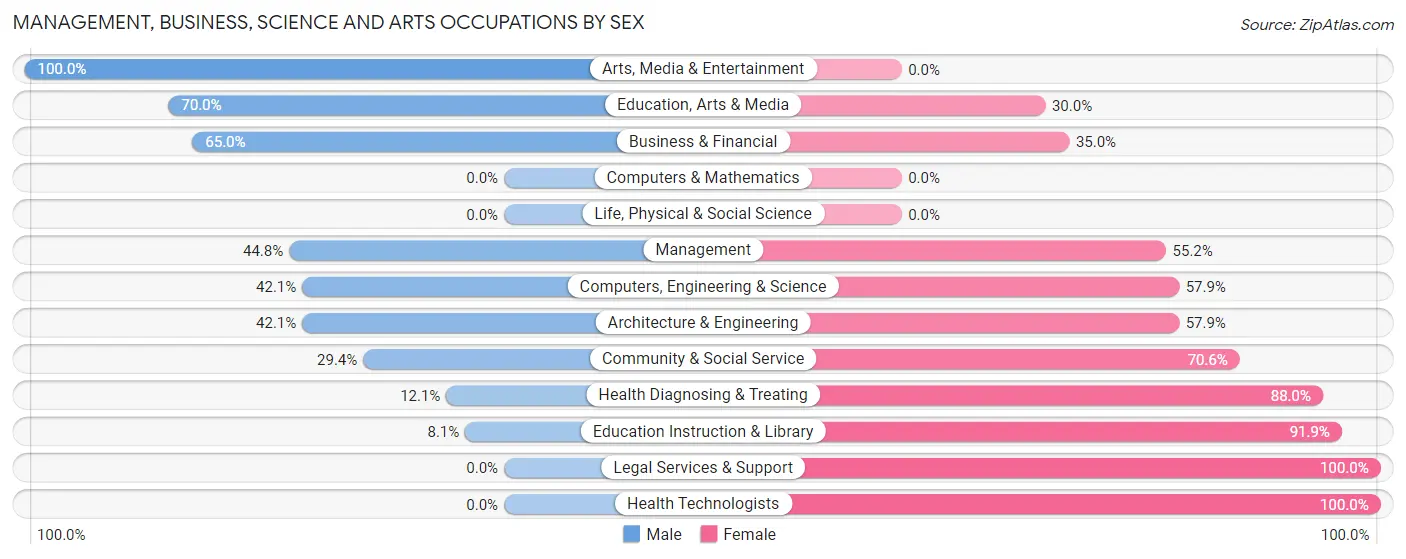
Management, Business, Science and Arts Occupations by Sex
Within the Management, Business, Science and Arts occupations in Tilton Northfield, the most male-oriented occupations are Arts, Media & Entertainment (100.0%), Education, Arts & Media (70.0%), and Business & Financial (65.0%), while the most female-oriented occupations are Legal Services & Support (100.0%), Health Technologists (100.0%), and Education Instruction & Library (91.9%).
| Occupation | Male | Female |
| Management | 26 (44.8%) | 32 (55.2%) |
| Business & Financial | 65 (65.0%) | 35 (35.0%) |
| Computers, Engineering & Science | 16 (42.1%) | 22 (57.9%) |
| Computers & Mathematics | 0 (0.0%) | 0 (0.0%) |
| Architecture & Engineering | 16 (42.1%) | 22 (57.9%) |
| Life, Physical & Social Science | 0 (0.0%) | 0 (0.0%) |
| Community & Social Service | 67 (29.4%) | 161 (70.6%) |
| Education, Arts & Media | 42 (70.0%) | 18 (30.0%) |
| Legal Services & Support | 0 (0.0%) | 7 (100.0%) |
| Education Instruction & Library | 12 (8.1%) | 136 (91.9%) |
| Arts, Media & Entertainment | 13 (100.0%) | 0 (0.0%) |
| Health Diagnosing & Treating | 10 (12.0%) | 73 (87.9%) |
| Health Technologists | 0 (0.0%) | 28 (100.0%) |
| Total (Category) | 184 (36.3%) | 323 (63.7%) |
| Total (Overall) | 783 (49.2%) | 808 (50.8%) |
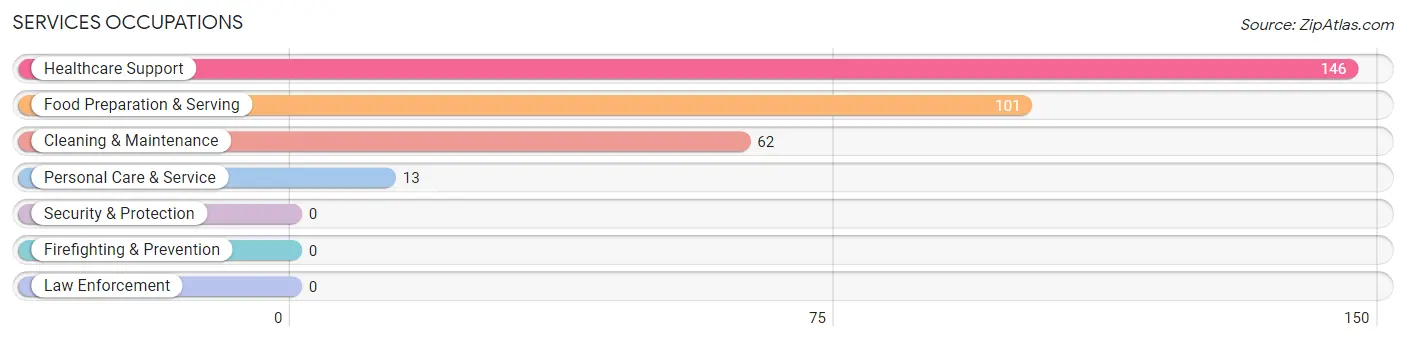
Services Occupations
The most common Services occupations in Tilton Northfield are Healthcare Support (146 | 9.2%), Food Preparation & Serving (101 | 6.4%), Cleaning & Maintenance (62 | 3.9%), and Personal Care & Service (13 | 0.8%).
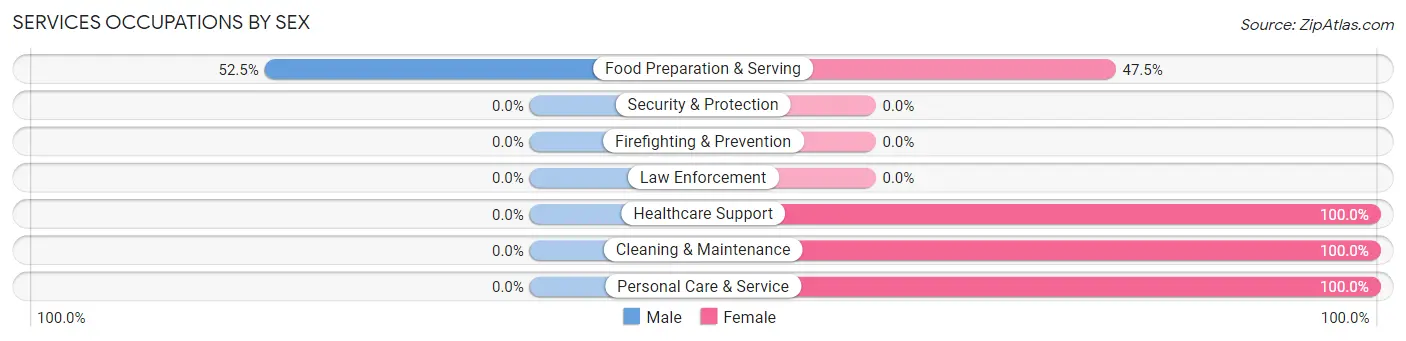
Services Occupations by Sex
| Occupation | Male | Female |
| Healthcare Support | 0 (0.0%) | 146 (100.0%) |
| Security & Protection | 0 (0.0%) | 0 (0.0%) |
| Firefighting & Prevention | 0 (0.0%) | 0 (0.0%) |
| Law Enforcement | 0 (0.0%) | 0 (0.0%) |
| Food Preparation & Serving | 53 (52.5%) | 48 (47.5%) |
| Cleaning & Maintenance | 0 (0.0%) | 62 (100.0%) |
| Personal Care & Service | 0 (0.0%) | 13 (100.0%) |
| Total (Category) | 53 (16.5%) | 269 (83.5%) |
| Total (Overall) | 783 (49.2%) | 808 (50.8%) |
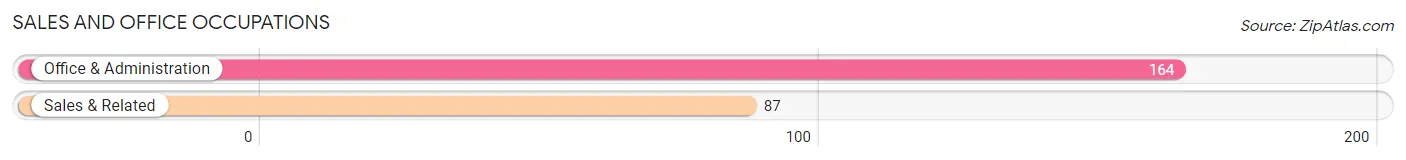
Sales and Office Occupations
The most common Sales and Office occupations in Tilton Northfield are Office & Administration (164 | 10.3%), and Sales & Related (87 | 5.5%).
Sales and Office Occupations by Sex
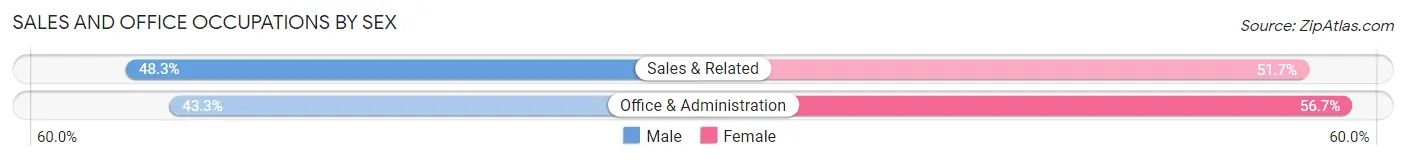
| Occupation | Male | Female |
| Sales & Related | 42 (48.3%) | 45 (51.7%) |
| Office & Administration | 71 (43.3%) | 93 (56.7%) |
| Total (Category) | 113 (45.0%) | 138 (55.0%) |
| Total (Overall) | 783 (49.2%) | 808 (50.8%) |
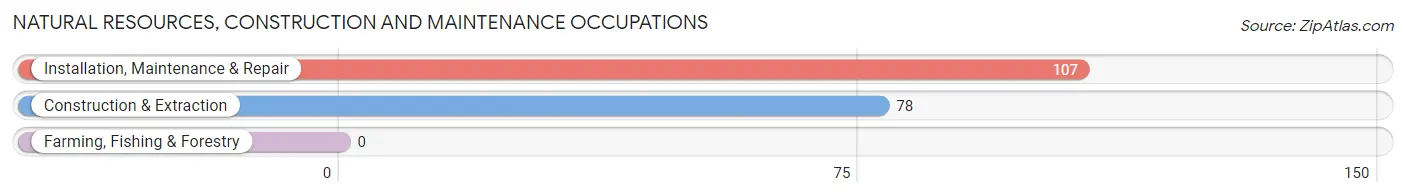
Natural Resources, Construction and Maintenance Occupations
The most common Natural Resources, Construction and Maintenance occupations in Tilton Northfield are Installation, Maintenance & Repair (107 | 6.7%), and Construction & Extraction (78 | 4.9%).
Natural Resources, Construction and Maintenance Occupations by Sex
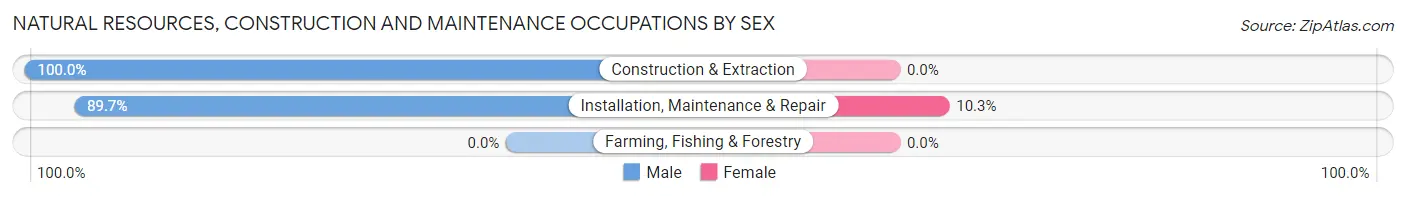
| Occupation | Male | Female |
| Farming, Fishing & Forestry | 0 (0.0%) | 0 (0.0%) |
| Construction & Extraction | 78 (100.0%) | 0 (0.0%) |
| Installation, Maintenance & Repair | 96 (89.7%) | 11 (10.3%) |
| Total (Category) | 174 (94.1%) | 11 (5.9%) |
| Total (Overall) | 783 (49.2%) | 808 (50.8%) |
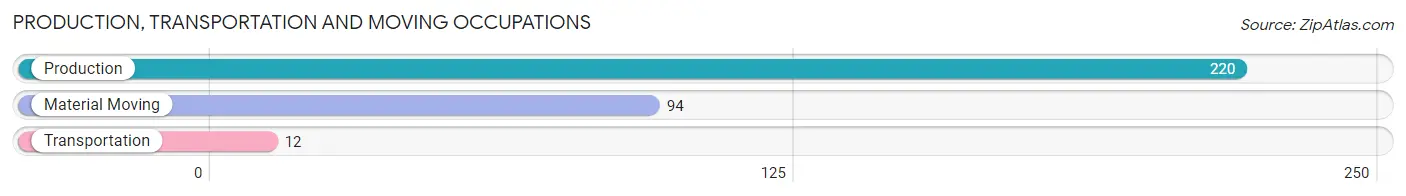
Production, Transportation and Moving Occupations
The most common Production, Transportation and Moving occupations in Tilton Northfield are Production (220 | 13.8%), Material Moving (94 | 5.9%), and Transportation (12 | 0.7%).
Production, Transportation and Moving Occupations by Sex
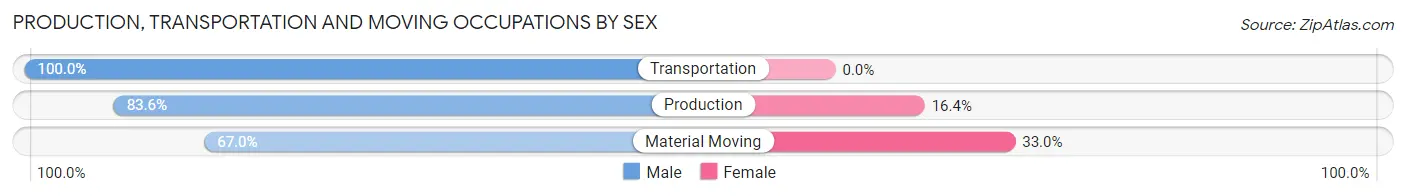
| Occupation | Male | Female |
| Production | 184 (83.6%) | 36 (16.4%) |
| Transportation | 12 (100.0%) | 0 (0.0%) |
| Material Moving | 63 (67.0%) | 31 (33.0%) |
| Total (Category) | 259 (79.4%) | 67 (20.5%) |
| Total (Overall) | 783 (49.2%) | 808 (50.8%) |
Employment Industries by Sex in Tilton Northfield
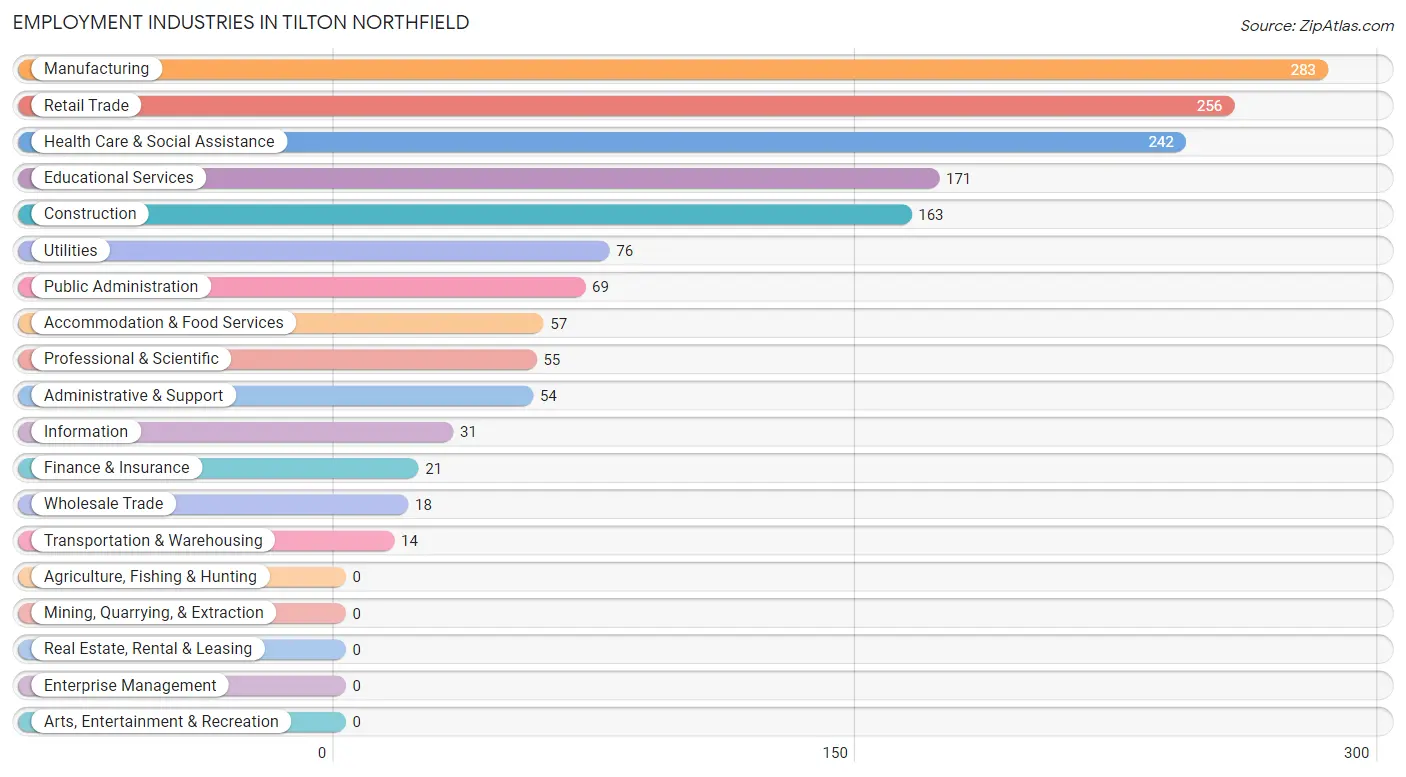
Employment Industries in Tilton Northfield
The major employment industries in Tilton Northfield include Manufacturing (283 | 17.8%), Retail Trade (256 | 16.1%), Health Care & Social Assistance (242 | 15.2%), Educational Services (171 | 10.7%), and Construction (163 | 10.2%).
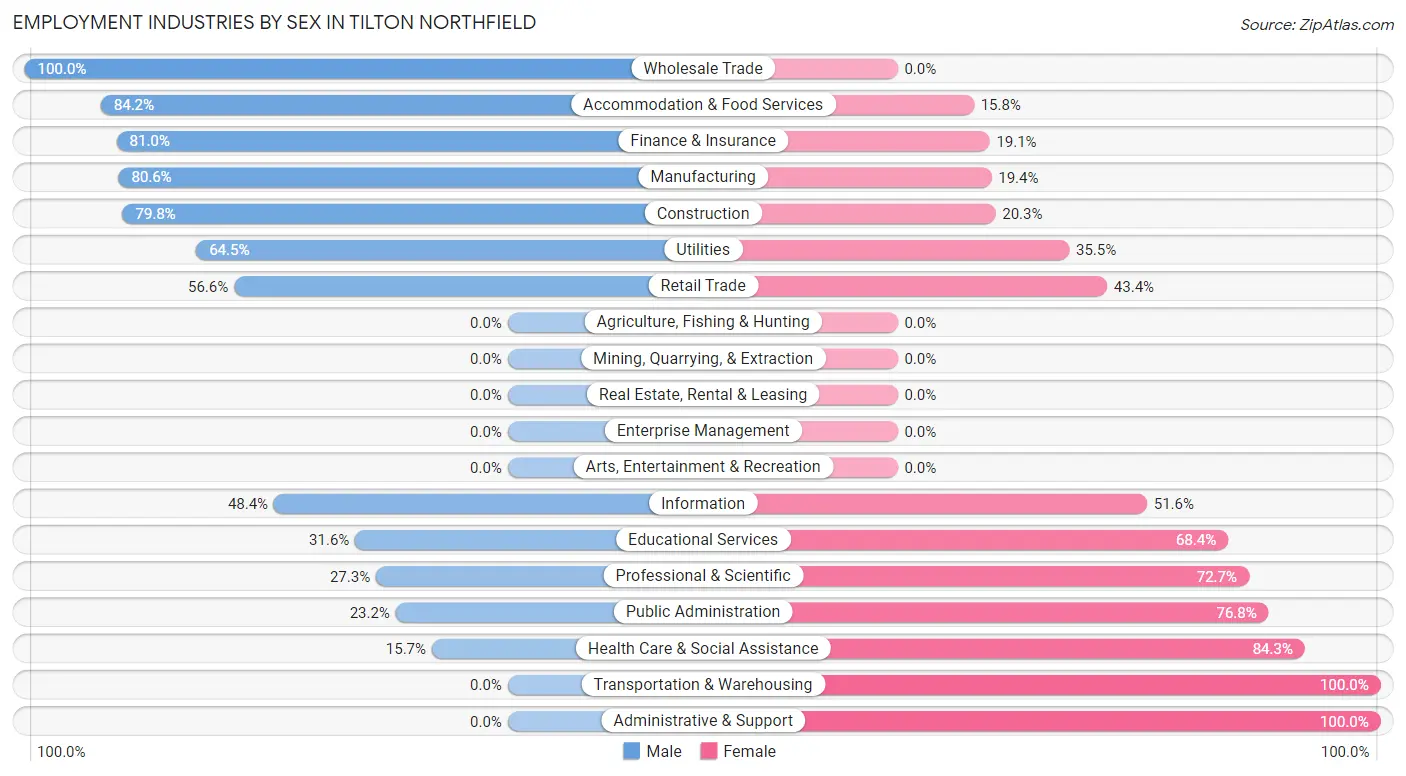
Employment Industries by Sex in Tilton Northfield
The Tilton Northfield industries that see more men than women are Wholesale Trade (100.0%), Accommodation & Food Services (84.2%), and Finance & Insurance (80.9%), whereas the industries that tend to have a higher number of women are Transportation & Warehousing (100.0%), Administrative & Support (100.0%), and Health Care & Social Assistance (84.3%).
| Industry | Male | Female |
| Agriculture, Fishing & Hunting | 0 (0.0%) | 0 (0.0%) |
| Mining, Quarrying, & Extraction | 0 (0.0%) | 0 (0.0%) |
| Construction | 130 (79.7%) | 33 (20.3%) |
| Manufacturing | 228 (80.6%) | 55 (19.4%) |
| Wholesale Trade | 18 (100.0%) | 0 (0.0%) |
| Retail Trade | 145 (56.6%) | 111 (43.4%) |
| Transportation & Warehousing | 0 (0.0%) | 14 (100.0%) |
| Utilities | 49 (64.5%) | 27 (35.5%) |
| Information | 15 (48.4%) | 16 (51.6%) |
| Finance & Insurance | 17 (80.9%) | 4 (19.1%) |
| Real Estate, Rental & Leasing | 0 (0.0%) | 0 (0.0%) |
| Professional & Scientific | 15 (27.3%) | 40 (72.7%) |
| Enterprise Management | 0 (0.0%) | 0 (0.0%) |
| Administrative & Support | 0 (0.0%) | 54 (100.0%) |
| Educational Services | 54 (31.6%) | 117 (68.4%) |
| Health Care & Social Assistance | 38 (15.7%) | 204 (84.3%) |
| Arts, Entertainment & Recreation | 0 (0.0%) | 0 (0.0%) |
| Accommodation & Food Services | 48 (84.2%) | 9 (15.8%) |
| Public Administration | 16 (23.2%) | 53 (76.8%) |
| Total | 783 (49.2%) | 808 (50.8%) |
Education in Tilton Northfield
School Enrollment in Tilton Northfield
The most common levels of schooling among the 501 students in Tilton Northfield are middle school (139 | 27.7%), high school (86 | 17.2%), and nursery / preschool (71 | 14.2%).
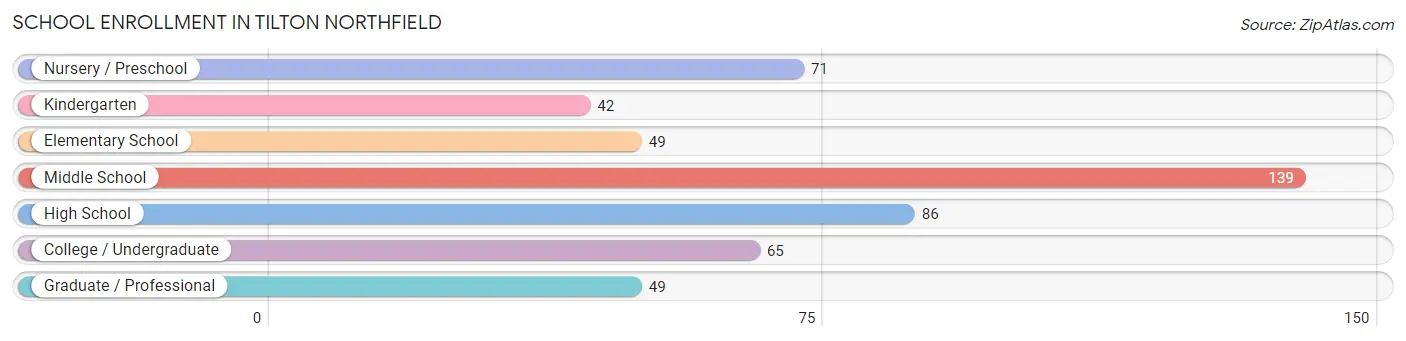
| School Level | # Students | % Students |
| Nursery / Preschool | 71 | 14.2% |
| Kindergarten | 42 | 8.4% |
| Elementary School | 49 | 9.8% |
| Middle School | 139 | 27.7% |
| High School | 86 | 17.2% |
| College / Undergraduate | 65 | 13.0% |
| Graduate / Professional | 49 | 9.8% |
| Total | 501 | 100.0% |
School Enrollment by Age by Funding Source in Tilton Northfield
Out of a total of 501 students who are enrolled in schools in Tilton Northfield, 69 (13.8%) attend a private institution, while the remaining 432 (86.2%) are enrolled in public schools. The age group of 25 to 34 year olds has the highest likelihood of being enrolled in private schools, with 49 (73.1% in the age bracket) enrolled. Conversely, the age group of 3 to 4 year olds has the lowest likelihood of being enrolled in a private school, with 39 (100.0% in the age bracket) attending a public institution.
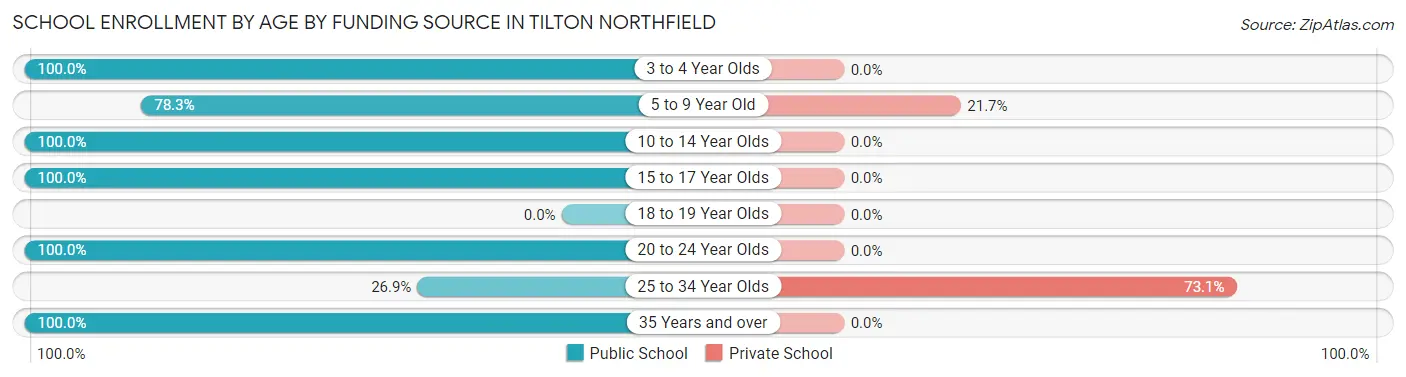
| Age Bracket | Public School | Private School |
| 3 to 4 Year Olds | 39 (100.0%) | 0 (0.0%) |
| 5 to 9 Year Old | 72 (78.3%) | 20 (21.7%) |
| 10 to 14 Year Olds | 203 (100.0%) | 0 (0.0%) |
| 15 to 17 Year Olds | 53 (100.0%) | 0 (0.0%) |
| 18 to 19 Year Olds | 0 (0.0%) | 0 (0.0%) |
| 20 to 24 Year Olds | 28 (100.0%) | 0 (0.0%) |
| 25 to 34 Year Olds | 18 (26.9%) | 49 (73.1%) |
| 35 Years and over | 19 (100.0%) | 0 (0.0%) |
| Total | 432 (86.2%) | 69 (13.8%) |
Educational Attainment by Field of Study in Tilton Northfield
Business (130 | 24.4%), education (74 | 13.9%), liberal arts & history (51 | 9.6%), literature & languages (48 | 9.0%), and computers & mathematics (40 | 7.5%) are the most common fields of study among 532 individuals in Tilton Northfield who have obtained a bachelor's degree or higher.
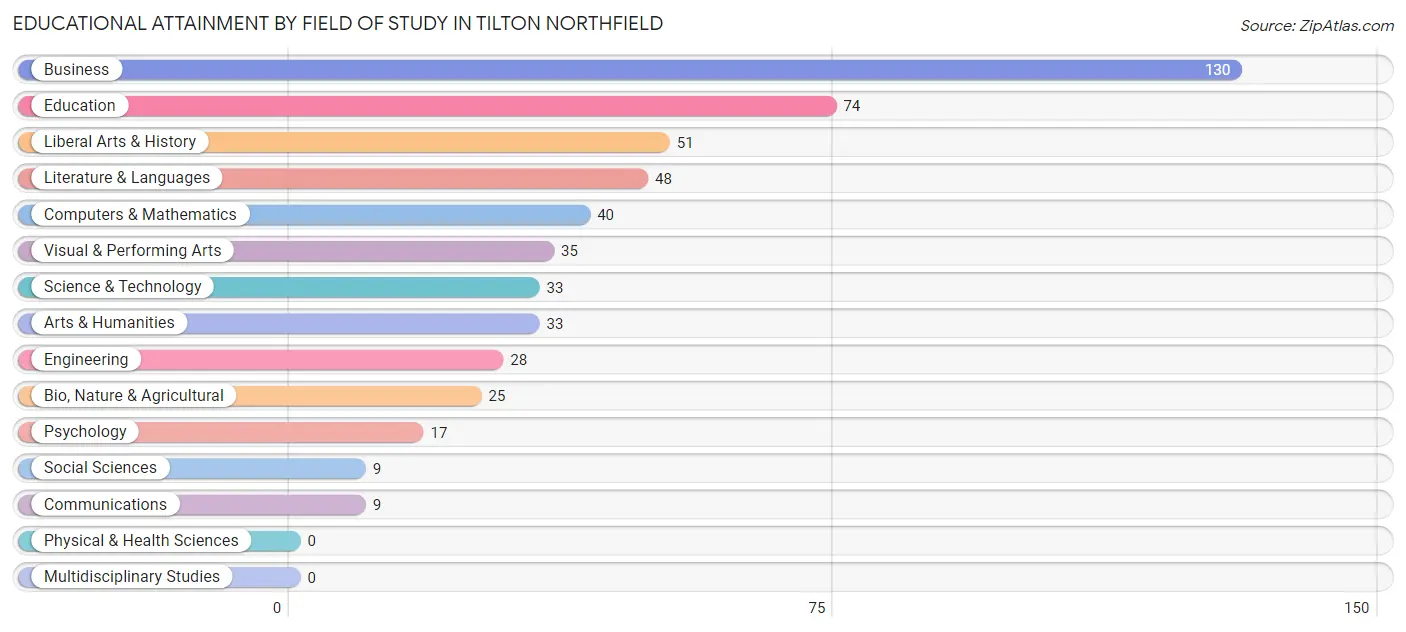
| Field of Study | # Graduates | % Graduates |
| Computers & Mathematics | 40 | 7.5% |
| Bio, Nature & Agricultural | 25 | 4.7% |
| Physical & Health Sciences | 0 | 0.0% |
| Psychology | 17 | 3.2% |
| Social Sciences | 9 | 1.7% |
| Engineering | 28 | 5.3% |
| Multidisciplinary Studies | 0 | 0.0% |
| Science & Technology | 33 | 6.2% |
| Business | 130 | 24.4% |
| Education | 74 | 13.9% |
| Literature & Languages | 48 | 9.0% |
| Liberal Arts & History | 51 | 9.6% |
| Visual & Performing Arts | 35 | 6.6% |
| Communications | 9 | 1.7% |
| Arts & Humanities | 33 | 6.2% |
| Total | 532 | 100.0% |
Transportation & Commute in Tilton Northfield
Vehicle Availability by Sex in Tilton Northfield
The most prevalent vehicle ownership categories in Tilton Northfield are males with 2 vehicles (465, accounting for 62.7%) and females with 2 vehicles (313, making up 59.5%).
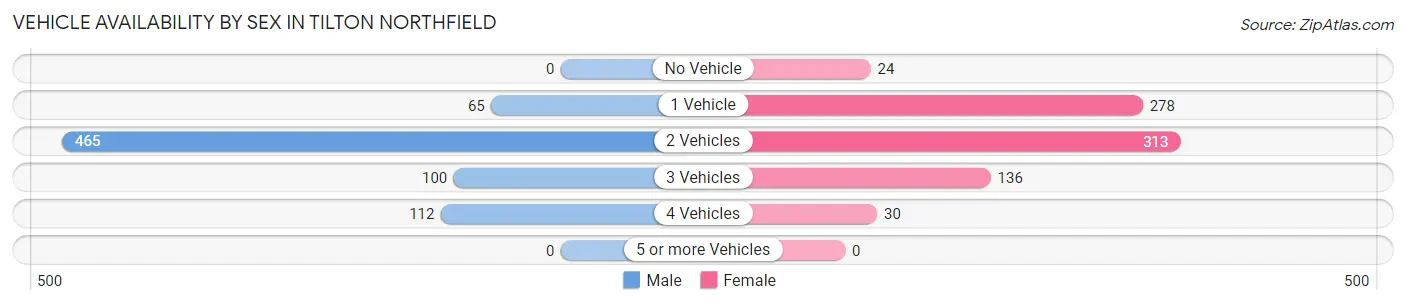
| Vehicles Available | Male | Female |
| No Vehicle | 0 (0.0%) | 24 (3.1%) |
| 1 Vehicle | 65 (8.8%) | 278 (35.6%) |
| 2 Vehicles | 465 (62.7%) | 313 (40.1%) |
| 3 Vehicles | 100 (13.5%) | 136 (17.4%) |
| 4 Vehicles | 112 (15.1%) | 30 (3.8%) |
| 5 or more Vehicles | 0 (0.0%) | 0 (0.0%) |
| Total | 742 (100.0%) | 781 (100.0%) |
Commute Time in Tilton Northfield
The most frequently occuring commute durations in Tilton Northfield are 10 to 14 minutes (232 commuters, 15.4%), 5 to 9 minutes (201 commuters, 13.3%), and 20 to 24 minutes (197 commuters, 13.1%).
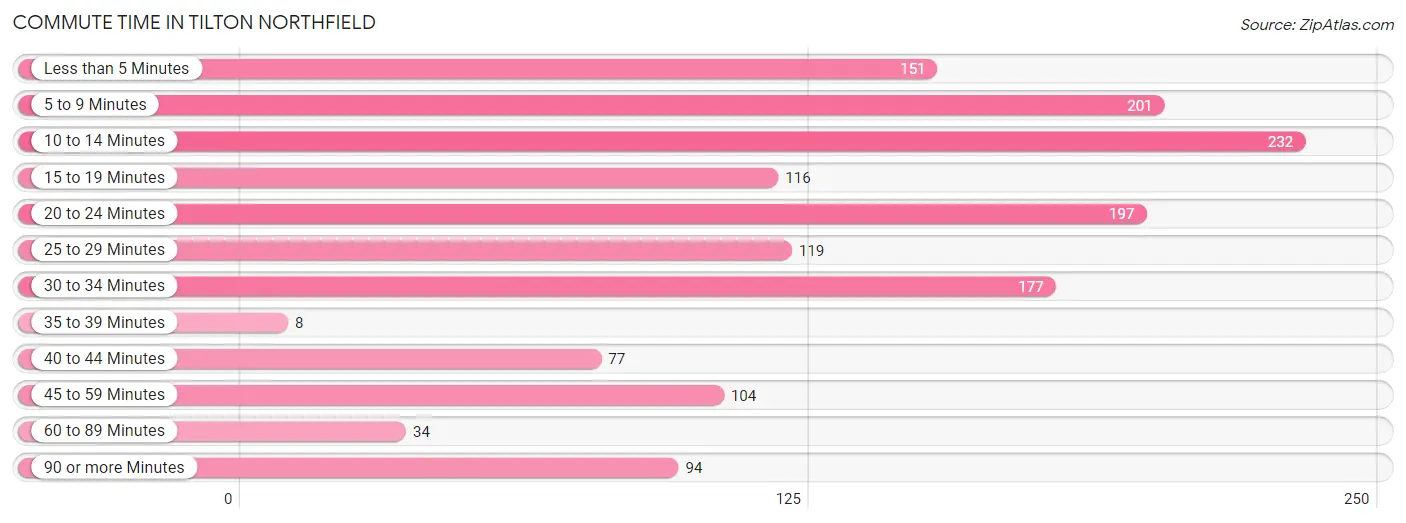
| Commute Time | # Commuters | % Commuters |
| Less than 5 Minutes | 151 | 10.0% |
| 5 to 9 Minutes | 201 | 13.3% |
| 10 to 14 Minutes | 232 | 15.4% |
| 15 to 19 Minutes | 116 | 7.7% |
| 20 to 24 Minutes | 197 | 13.1% |
| 25 to 29 Minutes | 119 | 7.9% |
| 30 to 34 Minutes | 177 | 11.7% |
| 35 to 39 Minutes | 8 | 0.5% |
| 40 to 44 Minutes | 77 | 5.1% |
| 45 to 59 Minutes | 104 | 6.9% |
| 60 to 89 Minutes | 34 | 2.2% |
| 90 or more Minutes | 94 | 6.2% |
Commute Time by Sex in Tilton Northfield
The most common commute times in Tilton Northfield are less than 5 minutes (140 commuters, 18.6%) for males and 20 to 24 minutes (142 commuters, 18.7%) for females.
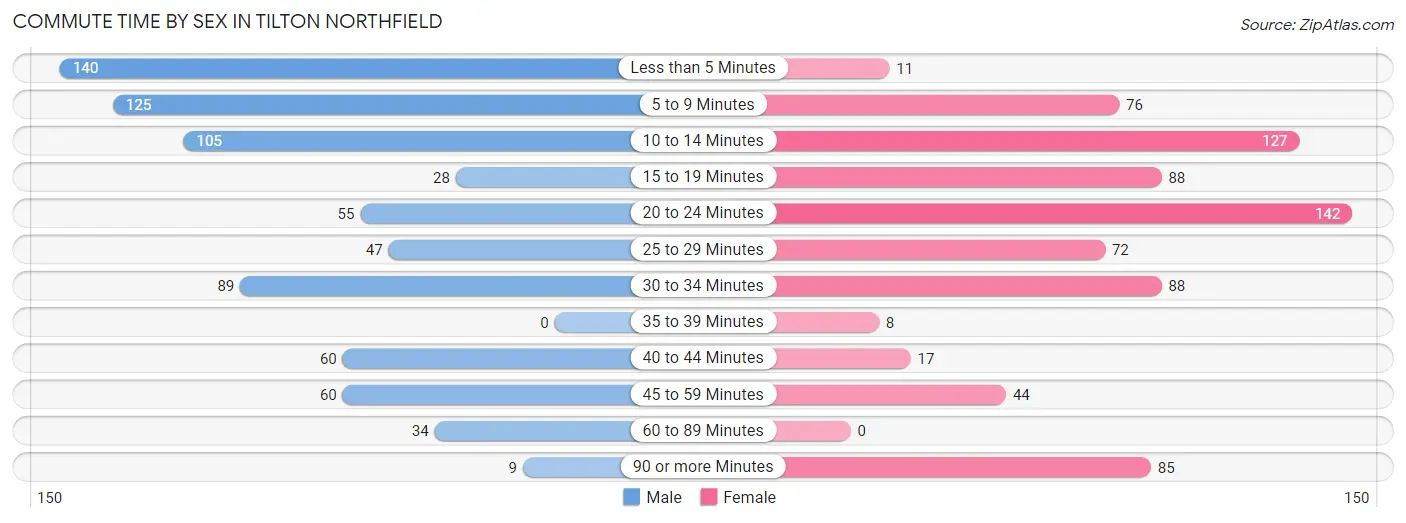
| Commute Time | Male | Female |
| Less than 5 Minutes | 140 (18.6%) | 11 (1.5%) |
| 5 to 9 Minutes | 125 (16.6%) | 76 (10.0%) |
| 10 to 14 Minutes | 105 (14.0%) | 127 (16.8%) |
| 15 to 19 Minutes | 28 (3.7%) | 88 (11.6%) |
| 20 to 24 Minutes | 55 (7.3%) | 142 (18.7%) |
| 25 to 29 Minutes | 47 (6.2%) | 72 (9.5%) |
| 30 to 34 Minutes | 89 (11.8%) | 88 (11.6%) |
| 35 to 39 Minutes | 0 (0.0%) | 8 (1.1%) |
| 40 to 44 Minutes | 60 (8.0%) | 17 (2.2%) |
| 45 to 59 Minutes | 60 (8.0%) | 44 (5.8%) |
| 60 to 89 Minutes | 34 (4.5%) | 0 (0.0%) |
| 90 or more Minutes | 9 (1.2%) | 85 (11.2%) |
Time of Departure to Work by Sex in Tilton Northfield
The most frequent times of departure to work in Tilton Northfield are 6:00 AM to 6:29 AM (164, 21.8%) for males and 7:30 AM to 7:59 AM (168, 22.2%) for females.
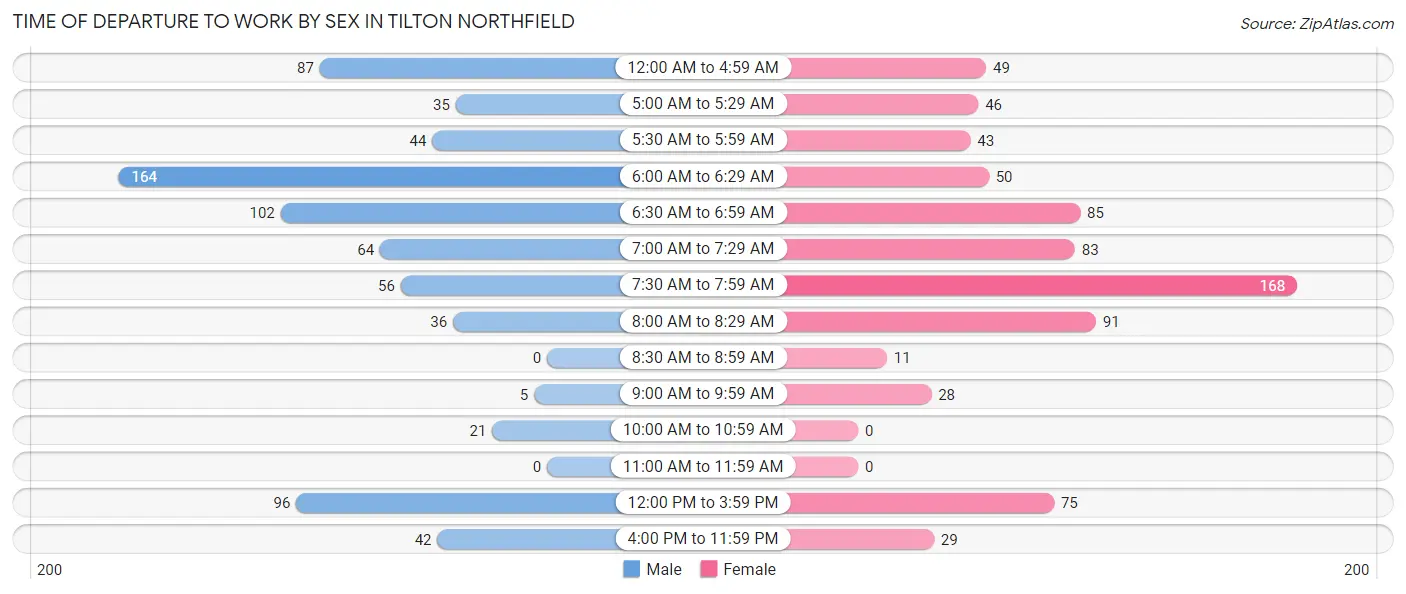
| Time of Departure | Male | Female |
| 12:00 AM to 4:59 AM | 87 (11.6%) | 49 (6.5%) |
| 5:00 AM to 5:29 AM | 35 (4.6%) | 46 (6.1%) |
| 5:30 AM to 5:59 AM | 44 (5.9%) | 43 (5.7%) |
| 6:00 AM to 6:29 AM | 164 (21.8%) | 50 (6.6%) |
| 6:30 AM to 6:59 AM | 102 (13.6%) | 85 (11.2%) |
| 7:00 AM to 7:29 AM | 64 (8.5%) | 83 (11.0%) |
| 7:30 AM to 7:59 AM | 56 (7.4%) | 168 (22.2%) |
| 8:00 AM to 8:29 AM | 36 (4.8%) | 91 (12.0%) |
| 8:30 AM to 8:59 AM | 0 (0.0%) | 11 (1.5%) |
| 9:00 AM to 9:59 AM | 5 (0.7%) | 28 (3.7%) |
| 10:00 AM to 10:59 AM | 21 (2.8%) | 0 (0.0%) |
| 11:00 AM to 11:59 AM | 0 (0.0%) | 0 (0.0%) |
| 12:00 PM to 3:59 PM | 96 (12.8%) | 75 (9.9%) |
| 4:00 PM to 11:59 PM | 42 (5.6%) | 29 (3.8%) |
| Total | 752 (100.0%) | 758 (100.0%) |
Housing Occupancy in Tilton Northfield
Occupancy by Ownership in Tilton Northfield
Of the total 1,232 dwellings in Tilton Northfield, owner-occupied units account for 550 (44.6%), while renter-occupied units make up 682 (55.4%).
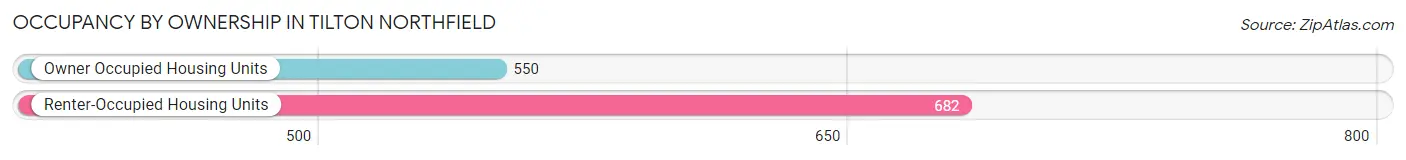
| Occupancy | # Housing Units | % Housing Units |
| Owner Occupied Housing Units | 550 | 44.6% |
| Renter-Occupied Housing Units | 682 | 55.4% |
| Total Occupied Housing Units | 1,232 | 100.0% |
Occupancy by Household Size in Tilton Northfield
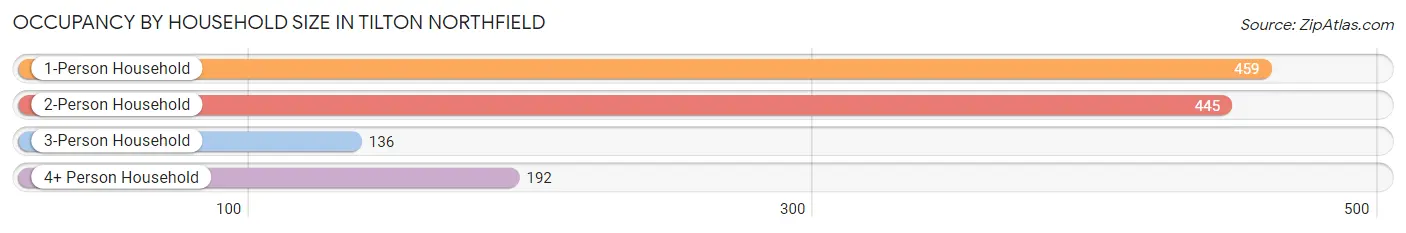
| Household Size | # Housing Units | % Housing Units |
| 1-Person Household | 459 | 37.3% |
| 2-Person Household | 445 | 36.1% |
| 3-Person Household | 136 | 11.0% |
| 4+ Person Household | 192 | 15.6% |
| Total Housing Units | 1,232 | 100.0% |
Occupancy by Ownership by Household Size in Tilton Northfield
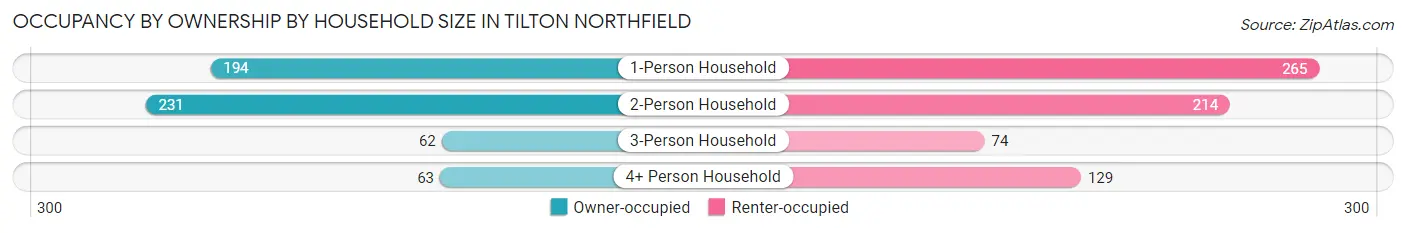
| Household Size | Owner-occupied | Renter-occupied |
| 1-Person Household | 194 (42.3%) | 265 (57.7%) |
| 2-Person Household | 231 (51.9%) | 214 (48.1%) |
| 3-Person Household | 62 (45.6%) | 74 (54.4%) |
| 4+ Person Household | 63 (32.8%) | 129 (67.2%) |
| Total Housing Units | 550 (44.6%) | 682 (55.4%) |
Occupancy by Educational Attainment in Tilton Northfield
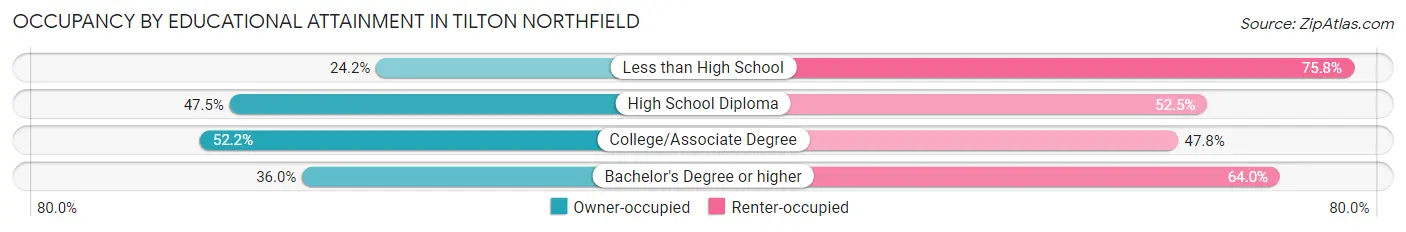
| Household Size | Owner-occupied | Renter-occupied |
| Less than High School | 8 (24.2%) | 25 (75.8%) |
| High School Diploma | 244 (47.5%) | 270 (52.5%) |
| College/Associate Degree | 166 (52.2%) | 152 (47.8%) |
| Bachelor's Degree or higher | 132 (36.0%) | 235 (64.0%) |
Occupancy by Age of Householder in Tilton Northfield
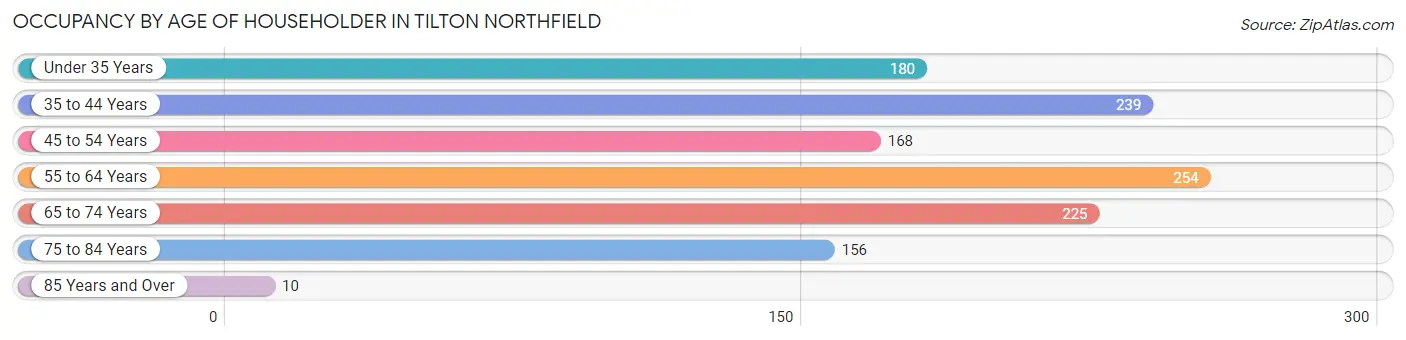
| Age Bracket | # Households | % Households |
| Under 35 Years | 180 | 14.6% |
| 35 to 44 Years | 239 | 19.4% |
| 45 to 54 Years | 168 | 13.6% |
| 55 to 64 Years | 254 | 20.6% |
| 65 to 74 Years | 225 | 18.3% |
| 75 to 84 Years | 156 | 12.7% |
| 85 Years and Over | 10 | 0.8% |
| Total | 1,232 | 100.0% |
Housing Finances in Tilton Northfield
Median Income by Occupancy in Tilton Northfield
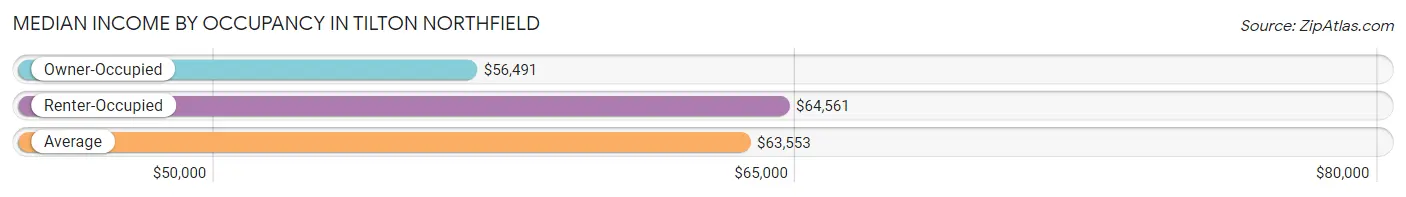
| Occupancy Type | # Households | Median Income |
| Owner-Occupied | 550 (44.6%) | $56,491 |
| Renter-Occupied | 682 (55.4%) | $64,561 |
| Average | 1,232 (100.0%) | $63,553 |
Occupancy by Householder Income Bracket in Tilton Northfield
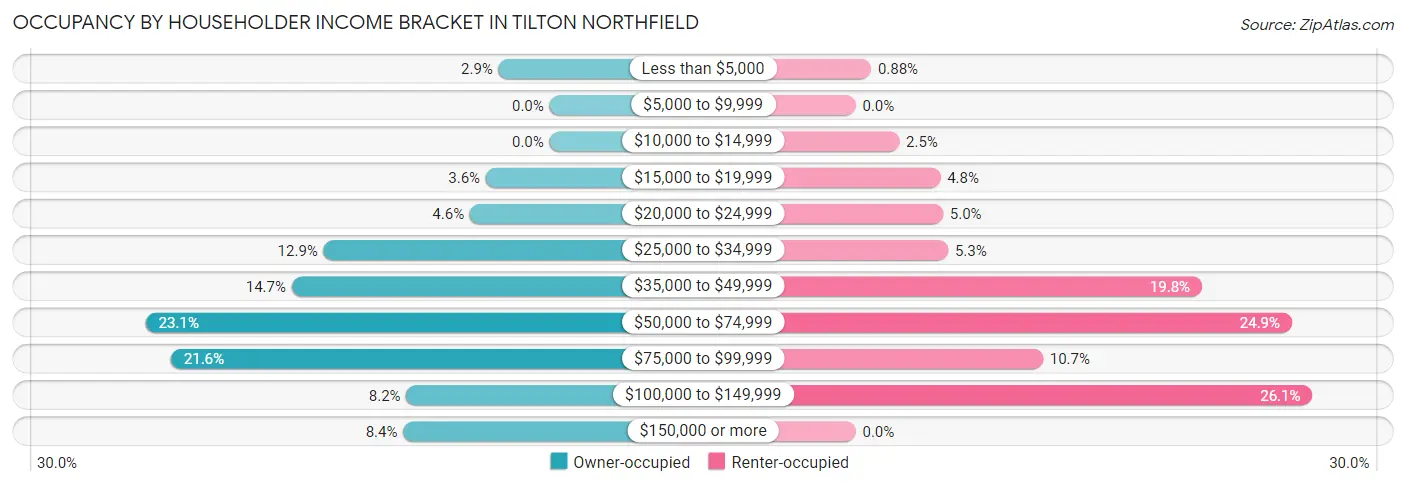
| Income Bracket | Owner-occupied | Renter-occupied |
| Less than $5,000 | 16 (2.9%) | 6 (0.9%) |
| $5,000 to $9,999 | 0 (0.0%) | 0 (0.0%) |
| $10,000 to $14,999 | 0 (0.0%) | 17 (2.5%) |
| $15,000 to $19,999 | 20 (3.6%) | 33 (4.8%) |
| $20,000 to $24,999 | 25 (4.5%) | 34 (5.0%) |
| $25,000 to $34,999 | 71 (12.9%) | 36 (5.3%) |
| $35,000 to $49,999 | 81 (14.7%) | 135 (19.8%) |
| $50,000 to $74,999 | 127 (23.1%) | 170 (24.9%) |
| $75,000 to $99,999 | 119 (21.6%) | 73 (10.7%) |
| $100,000 to $149,999 | 45 (8.2%) | 178 (26.1%) |
| $150,000 or more | 46 (8.4%) | 0 (0.0%) |
| Total | 550 (100.0%) | 682 (100.0%) |
Monthly Housing Cost Tiers in Tilton Northfield
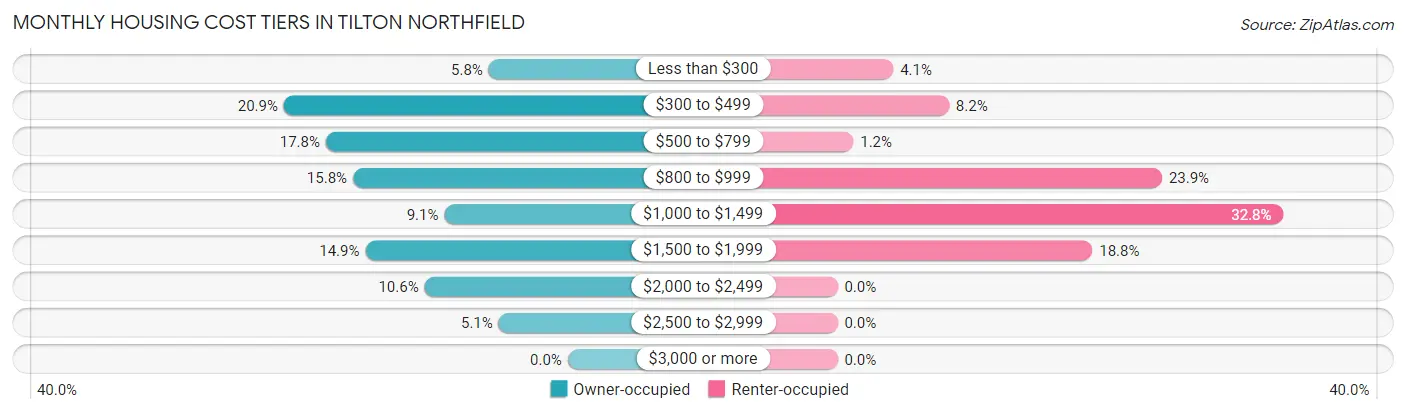
| Monthly Cost | Owner-occupied | Renter-occupied |
| Less than $300 | 32 (5.8%) | 28 (4.1%) |
| $300 to $499 | 115 (20.9%) | 56 (8.2%) |
| $500 to $799 | 98 (17.8%) | 8 (1.2%) |
| $800 to $999 | 87 (15.8%) | 163 (23.9%) |
| $1,000 to $1,499 | 50 (9.1%) | 224 (32.8%) |
| $1,500 to $1,999 | 82 (14.9%) | 128 (18.8%) |
| $2,000 to $2,499 | 58 (10.5%) | 0 (0.0%) |
| $2,500 to $2,999 | 28 (5.1%) | 0 (0.0%) |
| $3,000 or more | 0 (0.0%) | 0 (0.0%) |
| Total | 550 (100.0%) | 682 (100.0%) |
Physical Housing Characteristics in Tilton Northfield
Housing Structures in Tilton Northfield
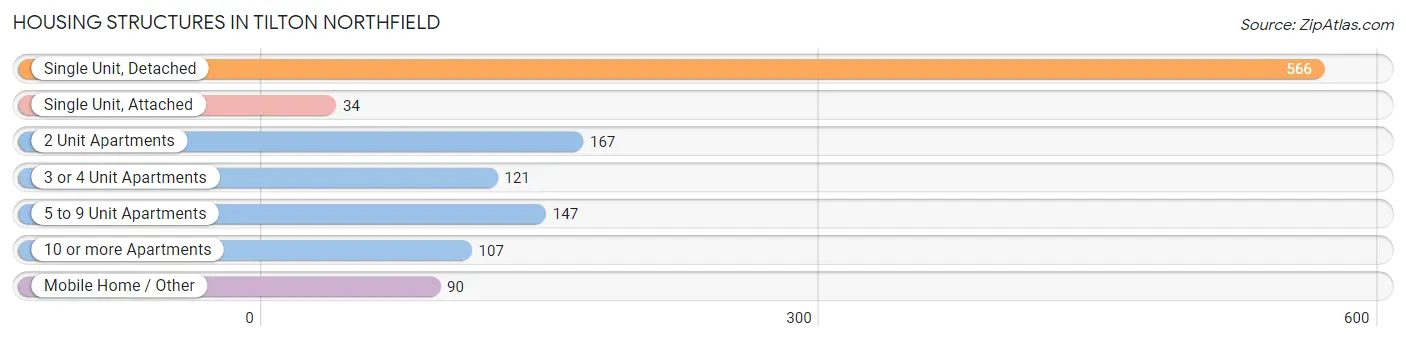
| Structure Type | # Housing Units | % Housing Units |
| Single Unit, Detached | 566 | 45.9% |
| Single Unit, Attached | 34 | 2.8% |
| 2 Unit Apartments | 167 | 13.6% |
| 3 or 4 Unit Apartments | 121 | 9.8% |
| 5 to 9 Unit Apartments | 147 | 11.9% |
| 10 or more Apartments | 107 | 8.7% |
| Mobile Home / Other | 90 | 7.3% |
| Total | 1,232 | 100.0% |
Housing Structures by Occupancy in Tilton Northfield
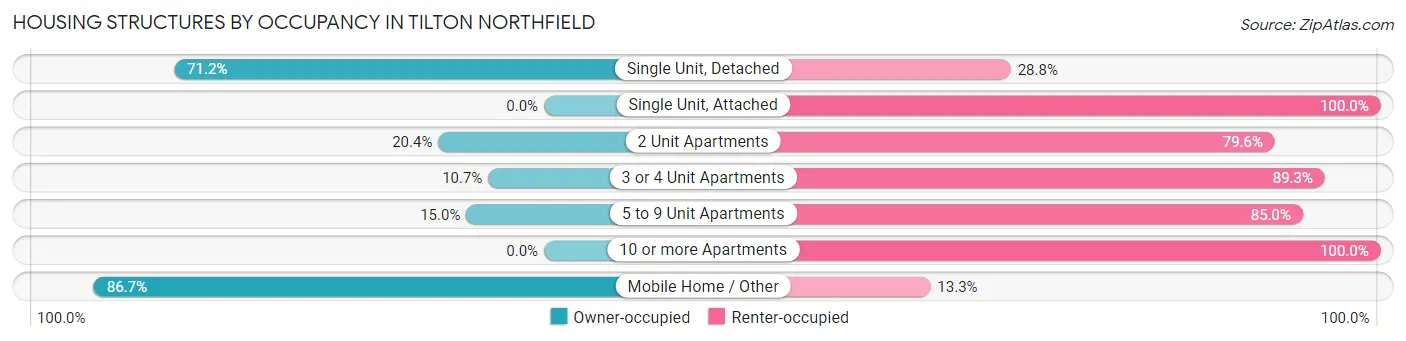
| Structure Type | Owner-occupied | Renter-occupied |
| Single Unit, Detached | 403 (71.2%) | 163 (28.8%) |
| Single Unit, Attached | 0 (0.0%) | 34 (100.0%) |
| 2 Unit Apartments | 34 (20.4%) | 133 (79.6%) |
| 3 or 4 Unit Apartments | 13 (10.7%) | 108 (89.3%) |
| 5 to 9 Unit Apartments | 22 (15.0%) | 125 (85.0%) |
| 10 or more Apartments | 0 (0.0%) | 107 (100.0%) |
| Mobile Home / Other | 78 (86.7%) | 12 (13.3%) |
| Total | 550 (44.6%) | 682 (55.4%) |
Housing Structures by Number of Rooms in Tilton Northfield
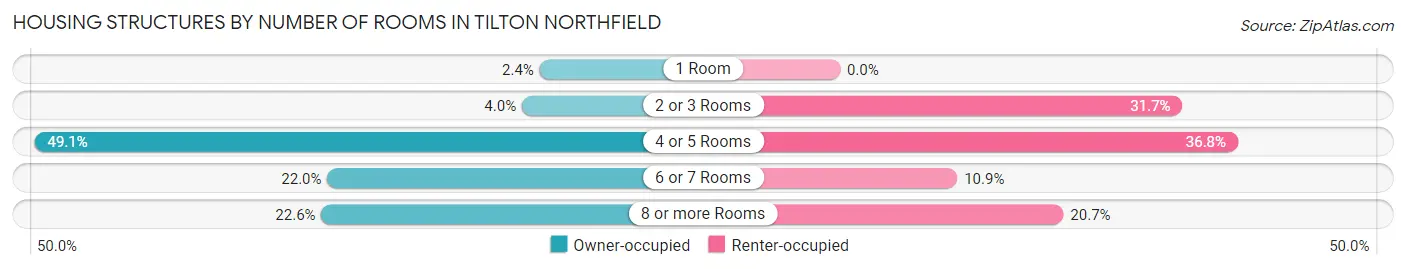
| Number of Rooms | Owner-occupied | Renter-occupied |
| 1 Room | 13 (2.4%) | 0 (0.0%) |
| 2 or 3 Rooms | 22 (4.0%) | 216 (31.7%) |
| 4 or 5 Rooms | 270 (49.1%) | 251 (36.8%) |
| 6 or 7 Rooms | 121 (22.0%) | 74 (10.8%) |
| 8 or more Rooms | 124 (22.6%) | 141 (20.7%) |
| Total | 550 (100.0%) | 682 (100.0%) |
Housing Structure by Heating Type in Tilton Northfield
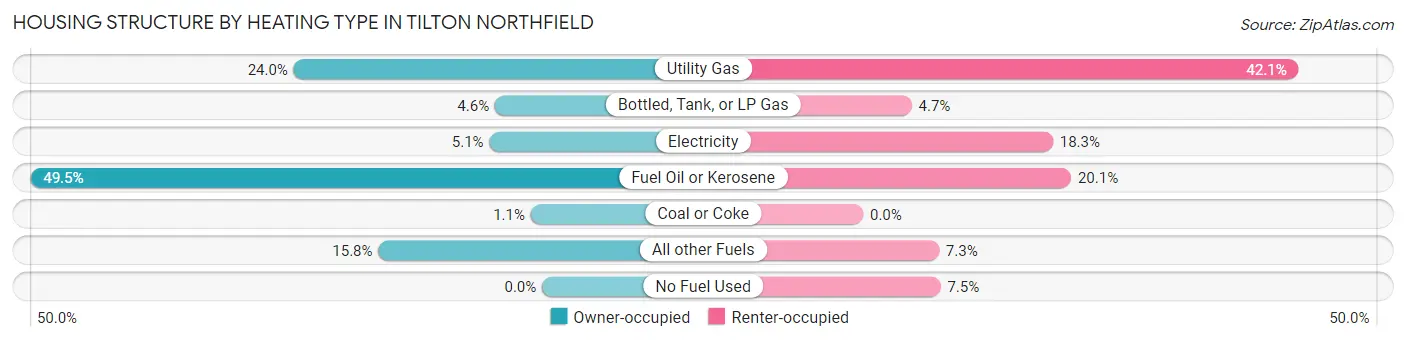
| Heating Type | Owner-occupied | Renter-occupied |
| Utility Gas | 132 (24.0%) | 287 (42.1%) |
| Bottled, Tank, or LP Gas | 25 (4.5%) | 32 (4.7%) |
| Electricity | 28 (5.1%) | 125 (18.3%) |
| Fuel Oil or Kerosene | 272 (49.4%) | 137 (20.1%) |
| Coal or Coke | 6 (1.1%) | 0 (0.0%) |
| All other Fuels | 87 (15.8%) | 50 (7.3%) |
| No Fuel Used | 0 (0.0%) | 51 (7.5%) |
| Total | 550 (100.0%) | 682 (100.0%) |
Household Vehicle Usage in Tilton Northfield
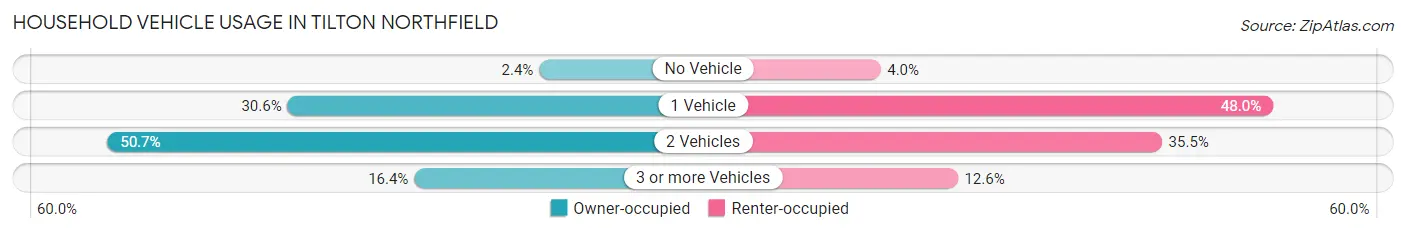
| Vehicles per Household | Owner-occupied | Renter-occupied |
| No Vehicle | 13 (2.4%) | 27 (4.0%) |
| 1 Vehicle | 168 (30.5%) | 327 (47.9%) |
| 2 Vehicles | 279 (50.7%) | 242 (35.5%) |
| 3 or more Vehicles | 90 (16.4%) | 86 (12.6%) |
| Total | 550 (100.0%) | 682 (100.0%) |
Real Estate & Mortgages in Tilton Northfield
Real Estate and Mortgage Overview in Tilton Northfield
| Characteristic | Without Mortgage | With Mortgage |
| Housing Units | 300 | 250 |
| Median Property Value | $175,600 | $222,900 |
| Median Household Income | $50,179 | $30 |
| Monthly Housing Costs | $606 | $0 |
| Real Estate Taxes | $3,647 | $10 |
Property Value by Mortgage Status in Tilton Northfield
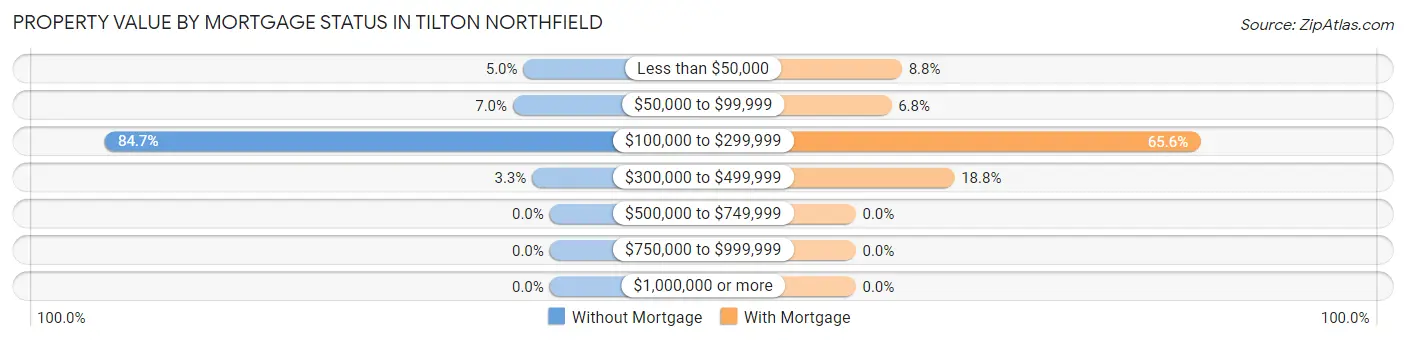
| Property Value | Without Mortgage | With Mortgage |
| Less than $50,000 | 15 (5.0%) | 22 (8.8%) |
| $50,000 to $99,999 | 21 (7.0%) | 17 (6.8%) |
| $100,000 to $299,999 | 254 (84.7%) | 164 (65.6%) |
| $300,000 to $499,999 | 10 (3.3%) | 47 (18.8%) |
| $500,000 to $749,999 | 0 (0.0%) | 0 (0.0%) |
| $750,000 to $999,999 | 0 (0.0%) | 0 (0.0%) |
| $1,000,000 or more | 0 (0.0%) | 0 (0.0%) |
| Total | 300 (100.0%) | 250 (100.0%) |
Household Income by Mortgage Status in Tilton Northfield
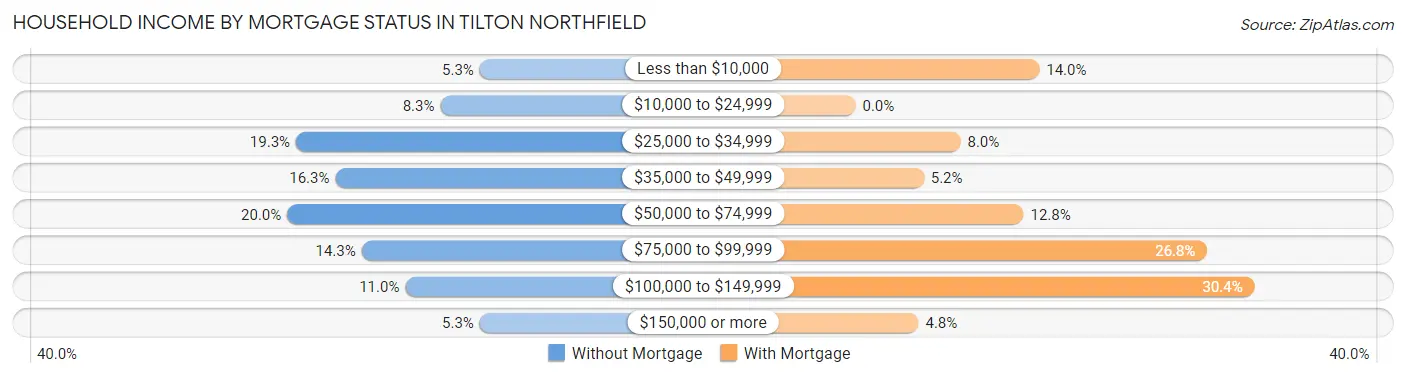
| Household Income | Without Mortgage | With Mortgage |
| Less than $10,000 | 16 (5.3%) | 35 (14.0%) |
| $10,000 to $24,999 | 25 (8.3%) | 0 (0.0%) |
| $25,000 to $34,999 | 58 (19.3%) | 20 (8.0%) |
| $35,000 to $49,999 | 49 (16.3%) | 13 (5.2%) |
| $50,000 to $74,999 | 60 (20.0%) | 32 (12.8%) |
| $75,000 to $99,999 | 43 (14.3%) | 67 (26.8%) |
| $100,000 to $149,999 | 33 (11.0%) | 76 (30.4%) |
| $150,000 or more | 16 (5.3%) | 12 (4.8%) |
| Total | 300 (100.0%) | 250 (100.0%) |
Property Value to Household Income Ratio in Tilton Northfield
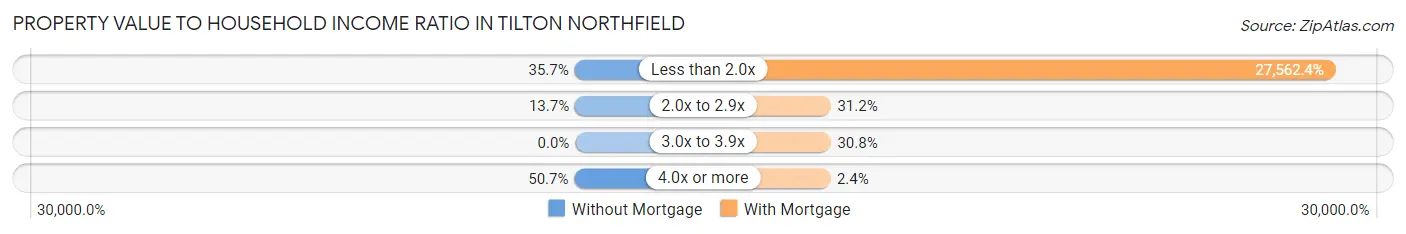
| Value-to-Income Ratio | Without Mortgage | With Mortgage |
| Less than 2.0x | 107 (35.7%) | 68,906 (27,562.4%) |
| 2.0x to 2.9x | 41 (13.7%) | 78 (31.2%) |
| 3.0x to 3.9x | 0 (0.0%) | 77 (30.8%) |
| 4.0x or more | 152 (50.7%) | 6 (2.4%) |
| Total | 300 (100.0%) | 250 (100.0%) |
Real Estate Taxes by Mortgage Status in Tilton Northfield
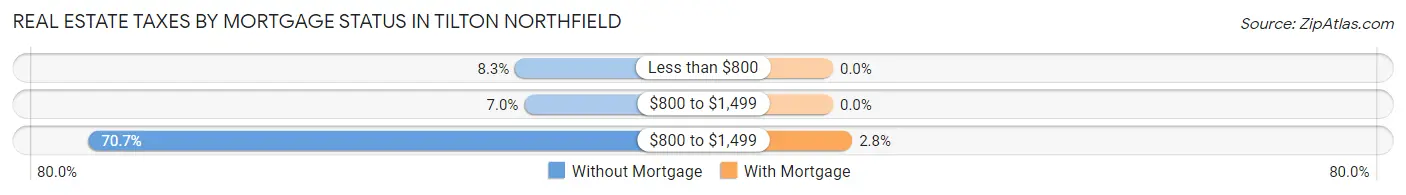
| Property Taxes | Without Mortgage | With Mortgage |
| Less than $800 | 25 (8.3%) | 0 (0.0%) |
| $800 to $1,499 | 21 (7.0%) | 0 (0.0%) |
| $800 to $1,499 | 212 (70.7%) | 7 (2.8%) |
| Total | 300 (100.0%) | 250 (100.0%) |
Health & Disability in Tilton Northfield
Health Insurance Coverage by Age in Tilton Northfield
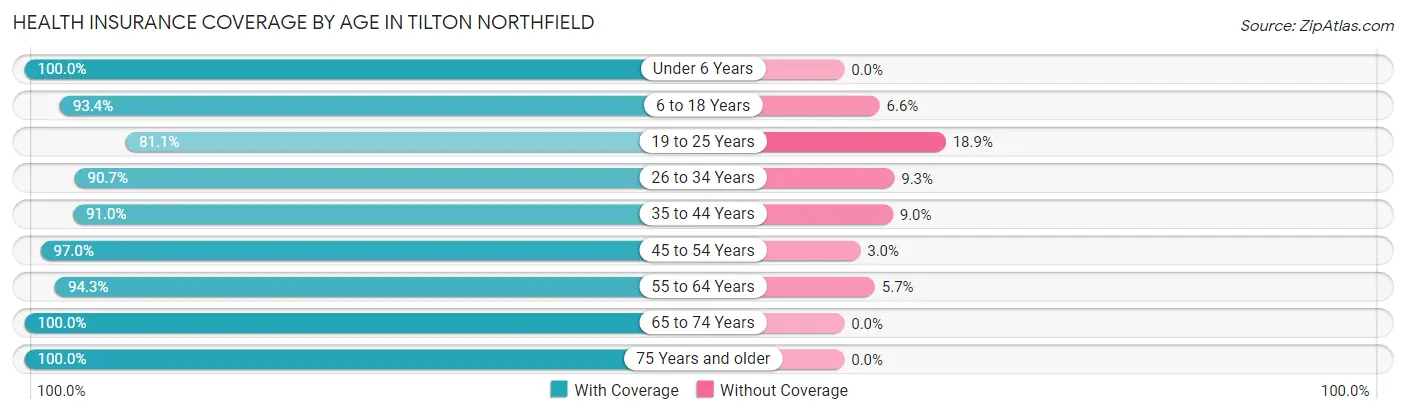
| Age Bracket | With Coverage | Without Coverage |
| Under 6 Years | 243 (100.0%) | 0 (0.0%) |
| 6 to 18 Years | 284 (93.4%) | 20 (6.6%) |
| 19 to 25 Years | 150 (81.1%) | 35 (18.9%) |
| 26 to 34 Years | 389 (90.7%) | 40 (9.3%) |
| 35 to 44 Years | 312 (91.0%) | 31 (9.0%) |
| 45 to 54 Years | 326 (97.0%) | 10 (3.0%) |
| 55 to 64 Years | 364 (94.3%) | 22 (5.7%) |
| 65 to 74 Years | 352 (100.0%) | 0 (0.0%) |
| 75 Years and older | 231 (100.0%) | 0 (0.0%) |
| Total | 2,651 (94.4%) | 158 (5.6%) |
Health Insurance Coverage by Citizenship Status in Tilton Northfield
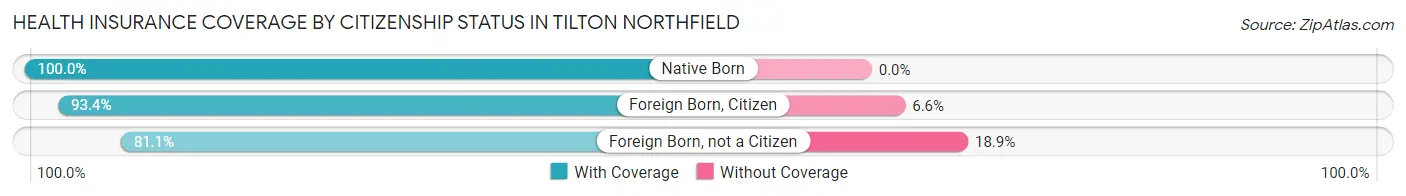
| Citizenship Status | With Coverage | Without Coverage |
| Native Born | 243 (100.0%) | 0 (0.0%) |
| Foreign Born, Citizen | 284 (93.4%) | 20 (6.6%) |
| Foreign Born, not a Citizen | 150 (81.1%) | 35 (18.9%) |
Health Insurance Coverage by Household Income in Tilton Northfield
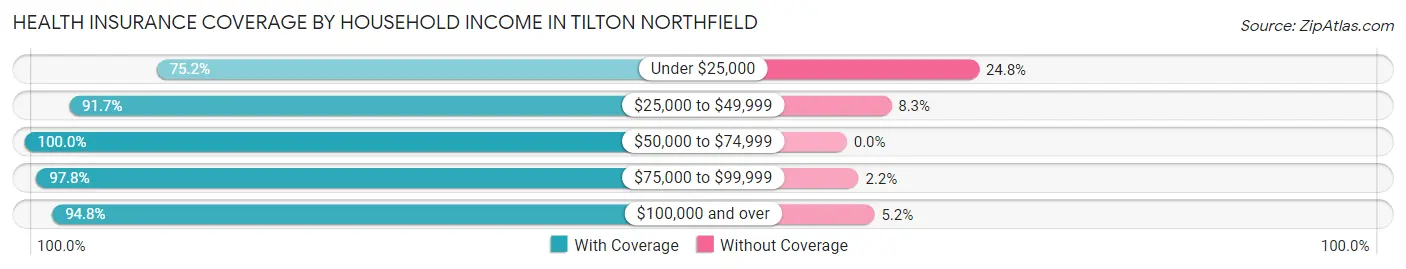
| Household Income | With Coverage | Without Coverage |
| Under $25,000 | 155 (75.2%) | 51 (24.8%) |
| $25,000 to $49,999 | 616 (91.7%) | 56 (8.3%) |
| $50,000 to $74,999 | 600 (100.0%) | 0 (0.0%) |
| $75,000 to $99,999 | 488 (97.8%) | 11 (2.2%) |
| $100,000 and over | 732 (94.8%) | 40 (5.2%) |
Public vs Private Health Insurance Coverage by Age in Tilton Northfield
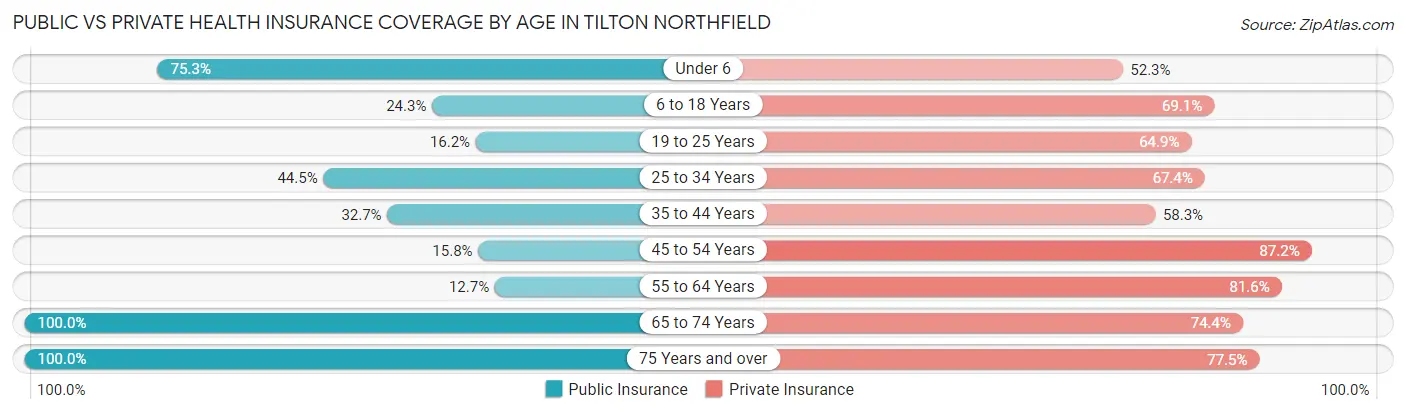
| Age Bracket | Public Insurance | Private Insurance |
| Under 6 | 183 (75.3%) | 127 (52.3%) |
| 6 to 18 Years | 74 (24.3%) | 210 (69.1%) |
| 19 to 25 Years | 30 (16.2%) | 120 (64.9%) |
| 25 to 34 Years | 191 (44.5%) | 289 (67.4%) |
| 35 to 44 Years | 112 (32.7%) | 200 (58.3%) |
| 45 to 54 Years | 53 (15.8%) | 293 (87.2%) |
| 55 to 64 Years | 49 (12.7%) | 315 (81.6%) |
| 65 to 74 Years | 352 (100.0%) | 262 (74.4%) |
| 75 Years and over | 231 (100.0%) | 179 (77.5%) |
| Total | 1,275 (45.4%) | 1,995 (71.0%) |
Disability Status by Sex by Age in Tilton Northfield
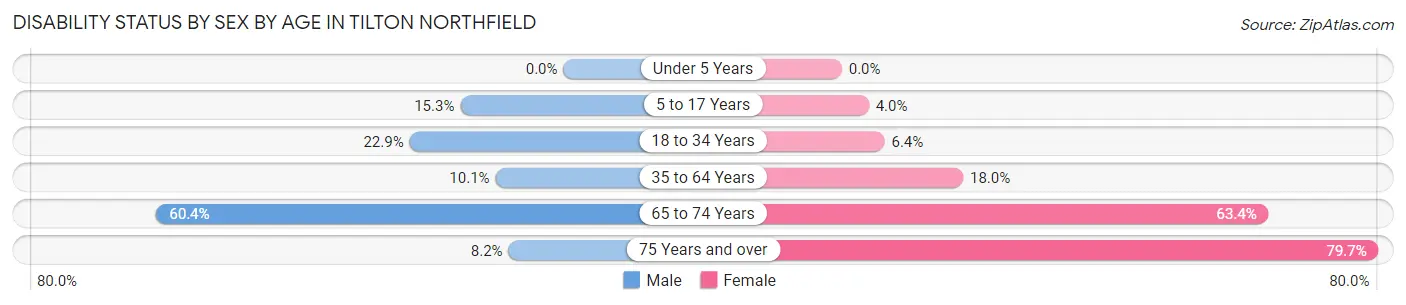
| Age Bracket | Male | Female |
| Under 5 Years | 0 (0.0%) | 0 (0.0%) |
| 5 to 17 Years | 15 (15.3%) | 10 (4.0%) |
| 18 to 34 Years | 85 (22.9%) | 16 (6.4%) |
| 35 to 64 Years | 43 (10.1%) | 115 (18.0%) |
| 65 to 74 Years | 84 (60.4%) | 135 (63.4%) |
| 75 Years and over | 8 (8.2%) | 106 (79.7%) |
Disability Class by Sex by Age in Tilton Northfield
Disability Class: Hearing Difficulty
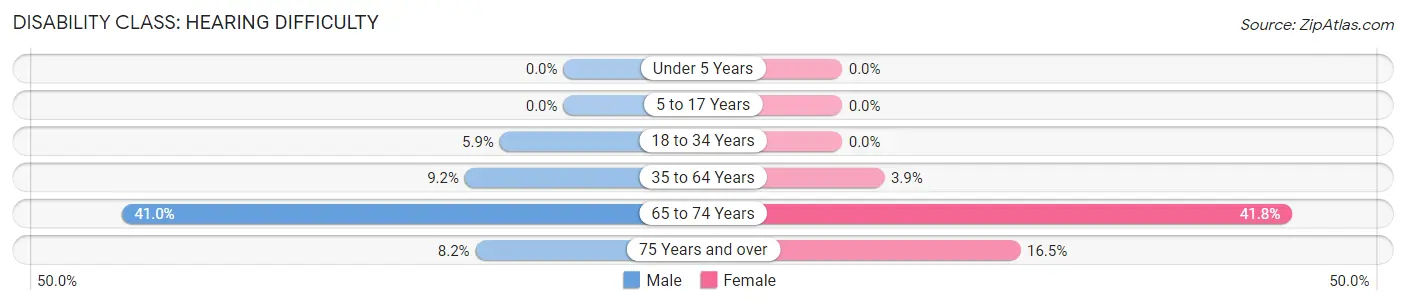
| Age Bracket | Male | Female |
| Under 5 Years | 0 (0.0%) | 0 (0.0%) |
| 5 to 17 Years | 0 (0.0%) | 0 (0.0%) |
| 18 to 34 Years | 22 (5.9%) | 0 (0.0%) |
| 35 to 64 Years | 39 (9.1%) | 25 (3.9%) |
| 65 to 74 Years | 57 (41.0%) | 89 (41.8%) |
| 75 Years and over | 8 (8.2%) | 22 (16.5%) |
Disability Class: Vision Difficulty
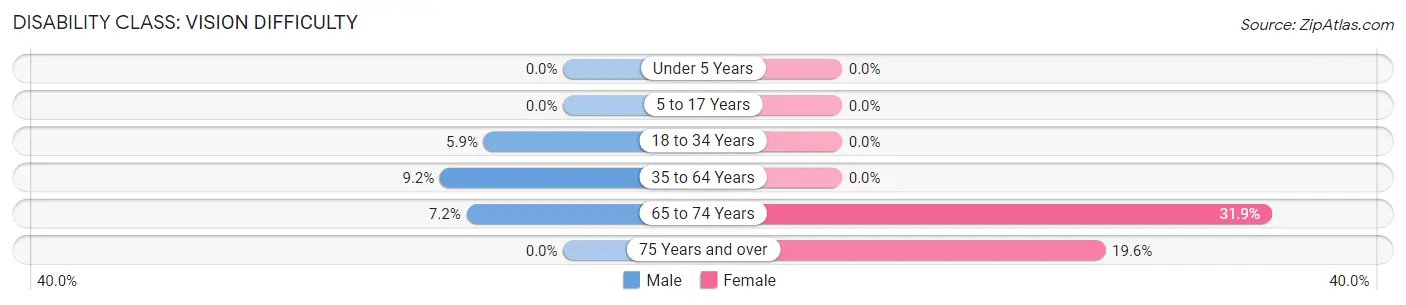
| Age Bracket | Male | Female |
| Under 5 Years | 0 (0.0%) | 0 (0.0%) |
| 5 to 17 Years | 0 (0.0%) | 0 (0.0%) |
| 18 to 34 Years | 22 (5.9%) | 0 (0.0%) |
| 35 to 64 Years | 39 (9.1%) | 0 (0.0%) |
| 65 to 74 Years | 10 (7.2%) | 68 (31.9%) |
| 75 Years and over | 0 (0.0%) | 26 (19.6%) |
Disability Class: Cognitive Difficulty
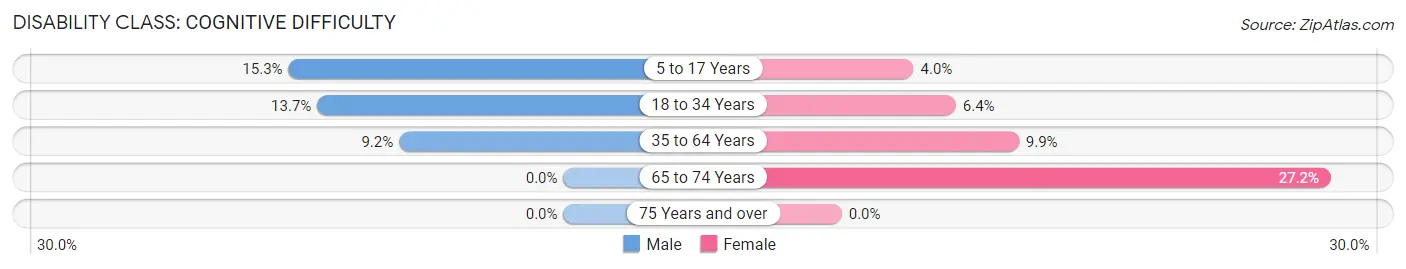
| Age Bracket | Male | Female |
| 5 to 17 Years | 15 (15.3%) | 10 (4.0%) |
| 18 to 34 Years | 51 (13.7%) | 16 (6.4%) |
| 35 to 64 Years | 39 (9.1%) | 63 (9.9%) |
| 65 to 74 Years | 0 (0.0%) | 58 (27.2%) |
| 75 Years and over | 0 (0.0%) | 0 (0.0%) |
Disability Class: Ambulatory Difficulty
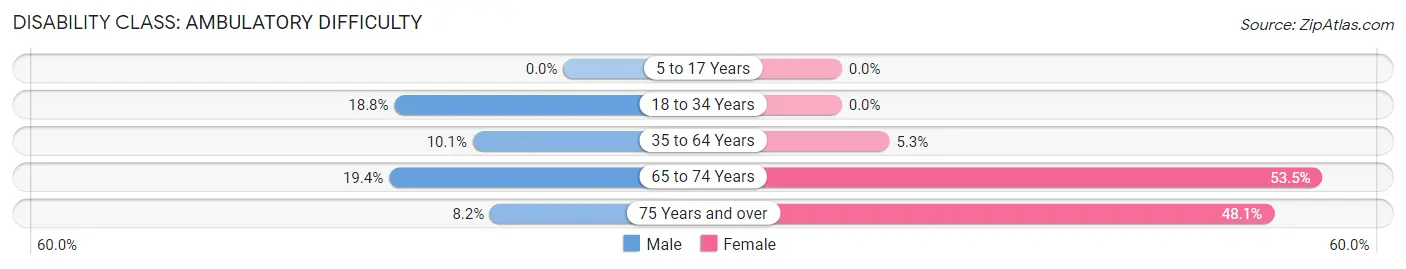
| Age Bracket | Male | Female |
| 5 to 17 Years | 0 (0.0%) | 0 (0.0%) |
| 18 to 34 Years | 70 (18.8%) | 0 (0.0%) |
| 35 to 64 Years | 43 (10.1%) | 34 (5.3%) |
| 65 to 74 Years | 27 (19.4%) | 114 (53.5%) |
| 75 Years and over | 8 (8.2%) | 64 (48.1%) |
Disability Class: Self-Care Difficulty
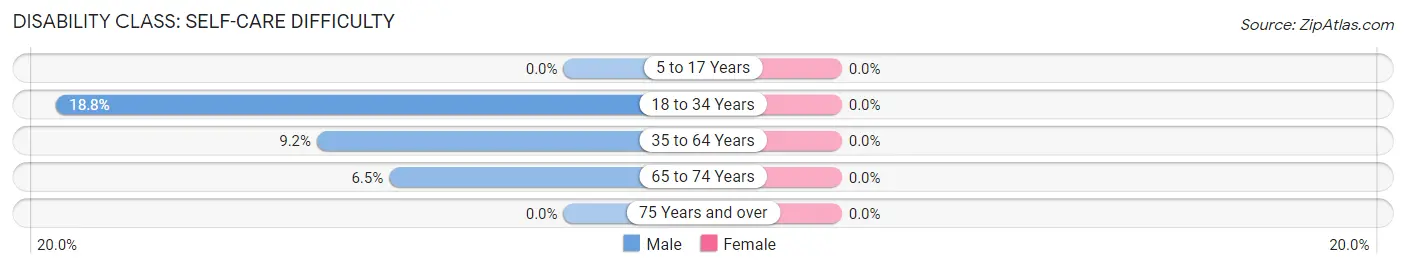
| Age Bracket | Male | Female |
| 5 to 17 Years | 0 (0.0%) | 0 (0.0%) |
| 18 to 34 Years | 70 (18.8%) | 0 (0.0%) |
| 35 to 64 Years | 39 (9.1%) | 0 (0.0%) |
| 65 to 74 Years | 9 (6.5%) | 0 (0.0%) |
| 75 Years and over | 0 (0.0%) | 0 (0.0%) |
Technology Access in Tilton Northfield
Computing Device Access in Tilton Northfield
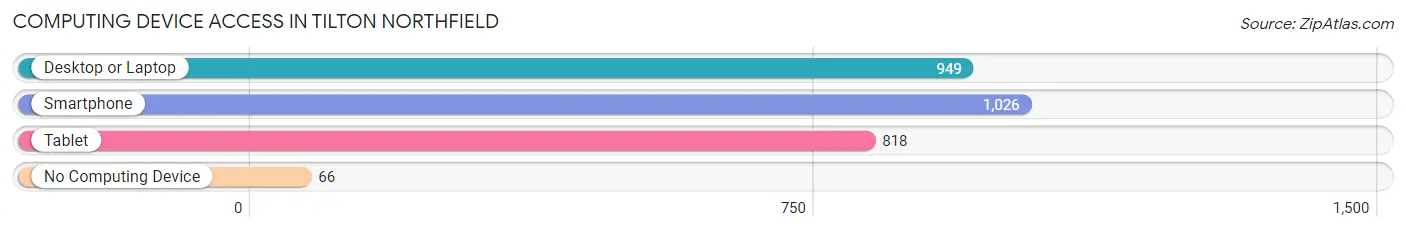
| Device Type | # Households | % Households |
| Desktop or Laptop | 949 | 77.0% |
| Smartphone | 1,026 | 83.3% |
| Tablet | 818 | 66.4% |
| No Computing Device | 66 | 5.4% |
| Total | 1,232 | 100.0% |
Internet Access in Tilton Northfield
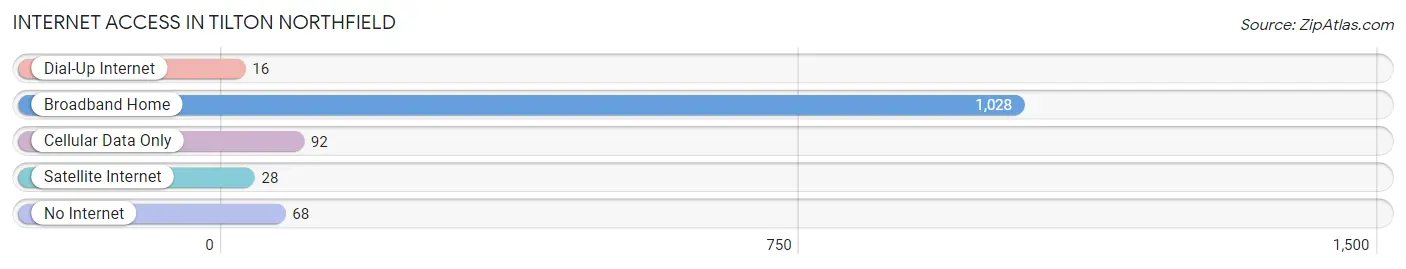
| Internet Type | # Households | % Households |
| Dial-Up Internet | 16 | 1.3% |
| Broadband Home | 1,028 | 83.4% |
| Cellular Data Only | 92 | 7.5% |
| Satellite Internet | 28 | 2.3% |
| No Internet | 68 | 5.5% |
| Total | 1,232 | 100.0% |
Tilton Northfield Summary
Tilton Northfield is a small town located in the state of New Hampshire, in the United States. It is situated in Belknap County, and is part of the Lakes Region of the state. The town has a population of approximately 4,000 people, and is located in the foothills of the White Mountains.
Geography
Tilton Northfield is located in the foothills of the White Mountains, and is situated in the Merrimack Valley. The town is bordered by the towns of Sanbornton to the north, Franklin to the east, and Tilton to the south. The town is located on the banks of the Winnipesaukee River, and is home to several small lakes, including Lake Winnisquam, Lake Waukewan, and Lake Opechee. The town is also home to the Tilton-Northfield State Forest, which is a popular destination for outdoor recreation.
The town has a total area of 11.2 square miles, of which 10.9 square miles is land and 0.3 square miles is water. The town is located at an elevation of approximately 500 feet above sea level.
History
Tilton Northfield was first settled in 1764, and was originally part of the town of Sanbornton. In 1820, the town was incorporated as the town of Northfield, and was named after the town of Northfield, Massachusetts. In 1869, the town of Tilton was annexed to Northfield, and the town was renamed Tilton Northfield.
The town was an important center of industry in the 19th century, and was home to several mills and factories. The town was also home to a large granite quarry, which supplied granite for many of the buildings in the area.
Economy
The economy of Tilton Northfield is largely based on tourism and retail. The town is home to several small businesses, including restaurants, shops, and lodging. The town is also home to several large employers, including the Tilton-Northfield State Forest, which is a popular destination for outdoor recreation.
The town is also home to several large manufacturing companies, including the Tilton-Northfield Manufacturing Company, which produces a variety of products, including furniture, tools, and automotive parts. The town is also home to several large retail stores, including Walmart, Target, and Home Depot.
Demographics
As of the 2010 census, the population of Tilton Northfield was 4,000 people. The racial makeup of the town was 97.2% White, 0.7% African American, 0.3% Native American, 0.3% Asian, 0.2% from other races, and 1.5% from two or more races. Hispanic or Latino of any race were 1.2% of the population.
The median household income in Tilton Northfield was $50,000, and the median family income was $60,000. The per capita income for the town was $25,000. About 8.5% of families and 10.2% of the population were below the poverty line, including 14.2% of those under age 18 and 5.2% of those age 65 or over.
Common Questions
What is Per Capita Income in Tilton Northfield?
Per Capita income in Tilton Northfield is $30,649.
What is the Median Family Income in Tilton Northfield?
Median Family Income in Tilton Northfield is $64,250.
What is the Median Household income in Tilton Northfield?
Median Household Income in Tilton Northfield is $63,553.
What is Income or Wage Gap in Tilton Northfield?
Income or Wage Gap in Tilton Northfield is 21.0%.
Women in Tilton Northfield earn 79.0 cents for every dollar earned by a man.
What is Family Income Deficit in Tilton Northfield?
Family Income Deficit in Tilton Northfield is $4,852.
Families that are below poverty line in Tilton Northfield earn $4,852 less on average than the poverty threshold level.
What is Inequality or Gini Index in Tilton Northfield?
Inequality or Gini Index in Tilton Northfield is 0.32.
What is the Total Population of Tilton Northfield?
Total Population of Tilton Northfield is 3,035.
What is the Total Male Population of Tilton Northfield?
Total Male Population of Tilton Northfield is 1,473.
What is the Total Female Population of Tilton Northfield?
Total Female Population of Tilton Northfield is 1,562.
What is the Ratio of Males per 100 Females in Tilton Northfield?
There are 94.30 Males per 100 Females in Tilton Northfield.
What is the Ratio of Females per 100 Males in Tilton Northfield?
There are 106.04 Females per 100 Males in Tilton Northfield.
What is the Median Population Age in Tilton Northfield?
Median Population Age in Tilton Northfield is 46.2 Years.
What is the Average Family Size in Tilton Northfield
Average Family Size in Tilton Northfield is 3.0 People.
What is the Average Household Size in Tilton Northfield
Average Household Size in Tilton Northfield is 2.2 People.
How Large is the Labor Force in Tilton Northfield?
There are 1,621 People in the Labor Forcein in Tilton Northfield.
What is the Percentage of People in the Labor Force in Tilton Northfield?
63.9% of People are in the Labor Force in Tilton Northfield.
What is the Unemployment Rate in Tilton Northfield?
Unemployment Rate in Tilton Northfield is 1.8%.