Zip Codes with the Highest Percentage of Population Employed in Food Preparation & Serving in Nashua, NH
RELATED REPORTS & OPTIONS
Food Preparation & Serving
Nashua
Compare Zip Codes
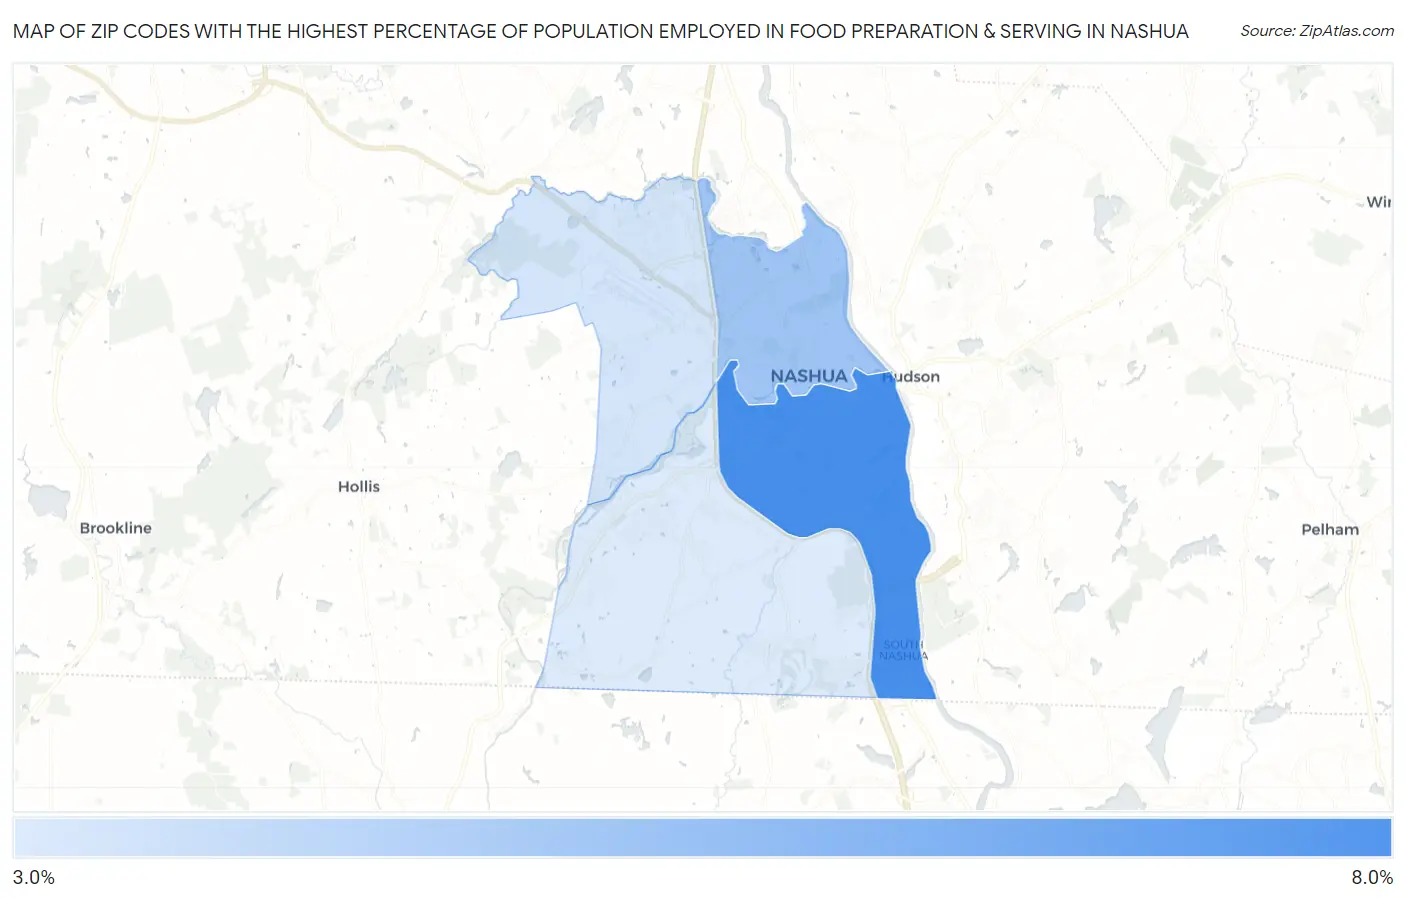
Map of Zip Codes with the Highest Percentage of Population Employed in Food Preparation & Serving in Nashua
3.0%
8.0%
Zip Codes with the Highest Percentage of Population Employed in Food Preparation & Serving in Nashua, NH
| Zip Code | % Employed | vs State | vs National | |
| 1. | 03060 | 8.0% | 5.2%(+2.76)#50 | 5.3%(+2.66)#4,805 |
| 2. | 03064 | 5.0% | 5.2%(-0.159)#96 | 5.3%(-0.253)#12,818 |
| 3. | 03063 | 3.3% | 5.2%(-1.90)#152 | 5.3%(-2.00)#20,118 |
| 4. | 03062 | 3.0% | 5.2%(-2.19)#165 | 5.3%(-2.28)#21,246 |
1
Common Questions
What are the Top 3 Zip Codes with the Highest Percentage of Population Employed in Food Preparation & Serving in Nashua, NH?
Top 3 Zip Codes with the Highest Percentage of Population Employed in Food Preparation & Serving in Nashua, NH are:
What zip code has the Highest Percentage of Population Employed in Food Preparation & Serving in Nashua, NH?
03060 has the Highest Percentage of Population Employed in Food Preparation & Serving in Nashua, NH with 8.0%.
What is the Percentage of Population Employed in Food Preparation & Serving in Nashua, NH?
Percentage of Population Employed in Food Preparation & Serving in Nashua is 5.1%.
What is the Percentage of Population Employed in Food Preparation & Serving in New Hampshire?
Percentage of Population Employed in Food Preparation & Serving in New Hampshire is 5.2%.
What is the Percentage of Population Employed in Food Preparation & Serving in the United States?
Percentage of Population Employed in Food Preparation & Serving in the United States is 5.3%.