Newport, NH Map & Demographics
Newport Map
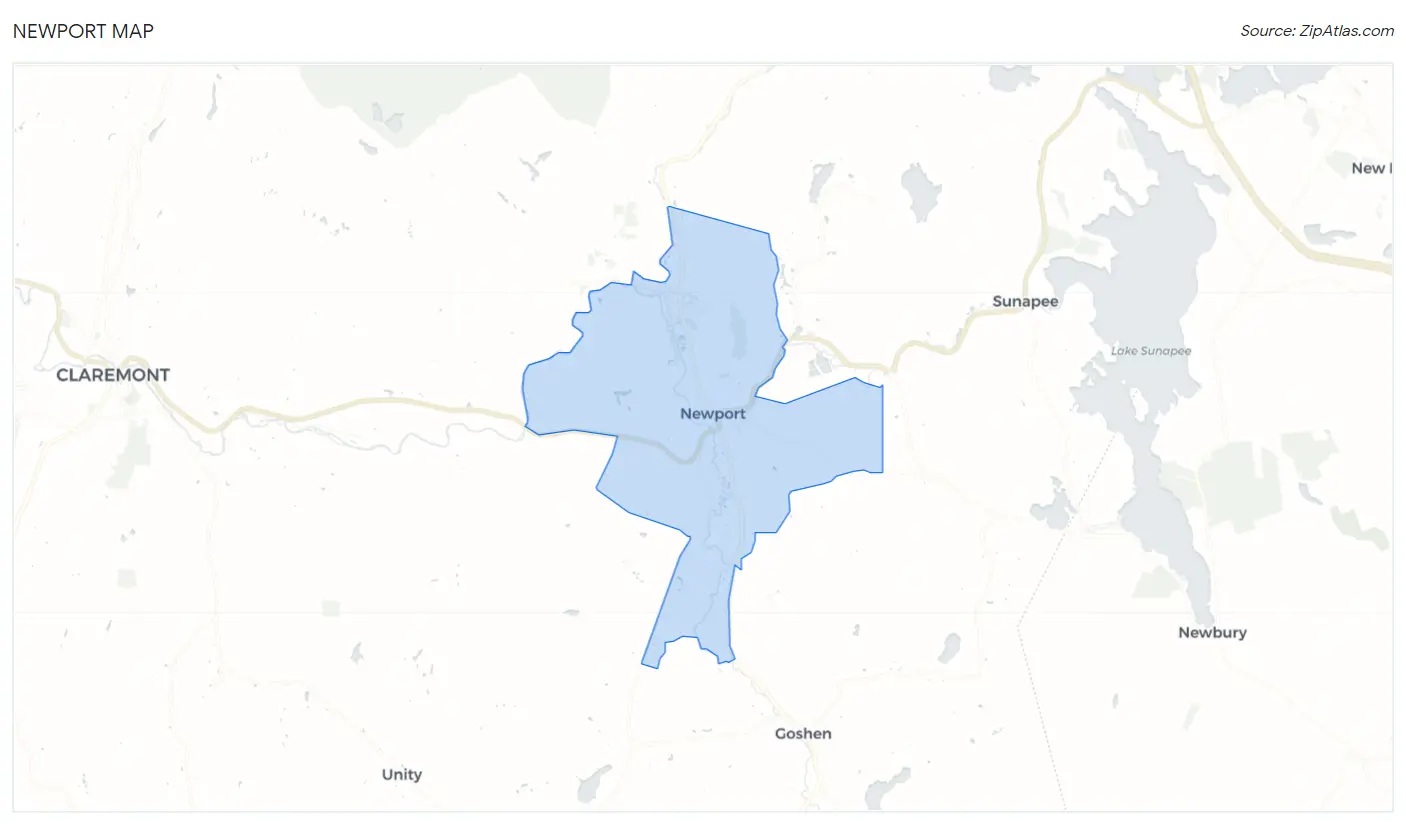
Newport Overview
$31,386
PER CAPITA INCOME
$67,008
AVG FAMILY INCOME
$67,500
AVG HOUSEHOLD INCOME
36.2%
WAGE / INCOME GAP [ % ]
63.8¢/ $1
WAGE / INCOME GAP [ $ ]
0.43
INEQUALITY / GINI INDEX
5,228
TOTAL POPULATION
2,778
MALE POPULATION
2,450
FEMALE POPULATION
113.39
MALES / 100 FEMALES
88.19
FEMALES / 100 MALES
43.7
MEDIAN AGE
3.2
AVG FAMILY SIZE
2.6
AVG HOUSEHOLD SIZE
2,732
LABOR FORCE [ PEOPLE ]
57.3%
PERCENT IN LABOR FORCE
3.9%
UNEMPLOYMENT RATE
Newport Zip Codes
Newport Area Codes
Income in Newport
Income Overview in Newport
Per Capita Income in Newport is $31,386, while median incomes of families and households are $67,008 and $67,500 respectively.
| Characteristic | Number | Measure |
| Per Capita Income | 5,228 | $31,386 |
| Median Family Income | 992 | $67,008 |
| Mean Family Income | 992 | $81,712 |
| Median Household Income | 1,936 | $67,500 |
| Mean Household Income | 1,936 | $75,539 |
| Income Deficit | 992 | $0 |
| Wage / Income Gap (%) | 5,228 | 36.18% |
| Wage / Income Gap ($) | 5,228 | 63.82¢ per $1 |
| Gini / Inequality Index | 5,228 | 0.43 |
Earnings by Sex in Newport
Average Earnings in Newport are $33,833, $36,478 for men and $23,281 for women, a difference of 36.2%.
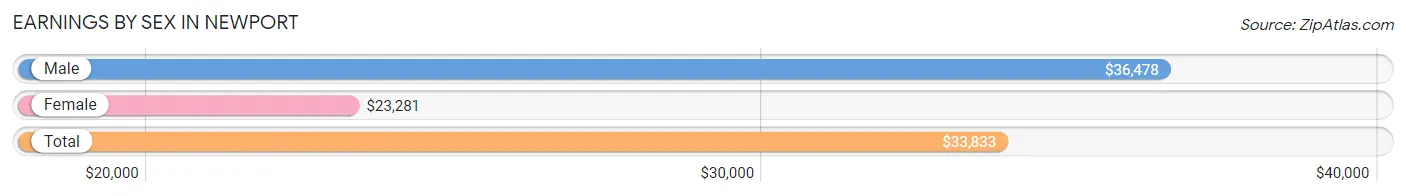
| Sex | Number | Average Earnings |
| Male | 1,644 (56.3%) | $36,478 |
| Female | 1,275 (43.7%) | $23,281 |
| Total | 2,919 (100.0%) | $33,833 |
Earnings by Sex by Income Bracket in Newport
The most common earnings brackets in Newport are $30,000 to $34,999 for men (210 | 12.8%) and $10,000 to $12,499 for women (166 | 13.0%).
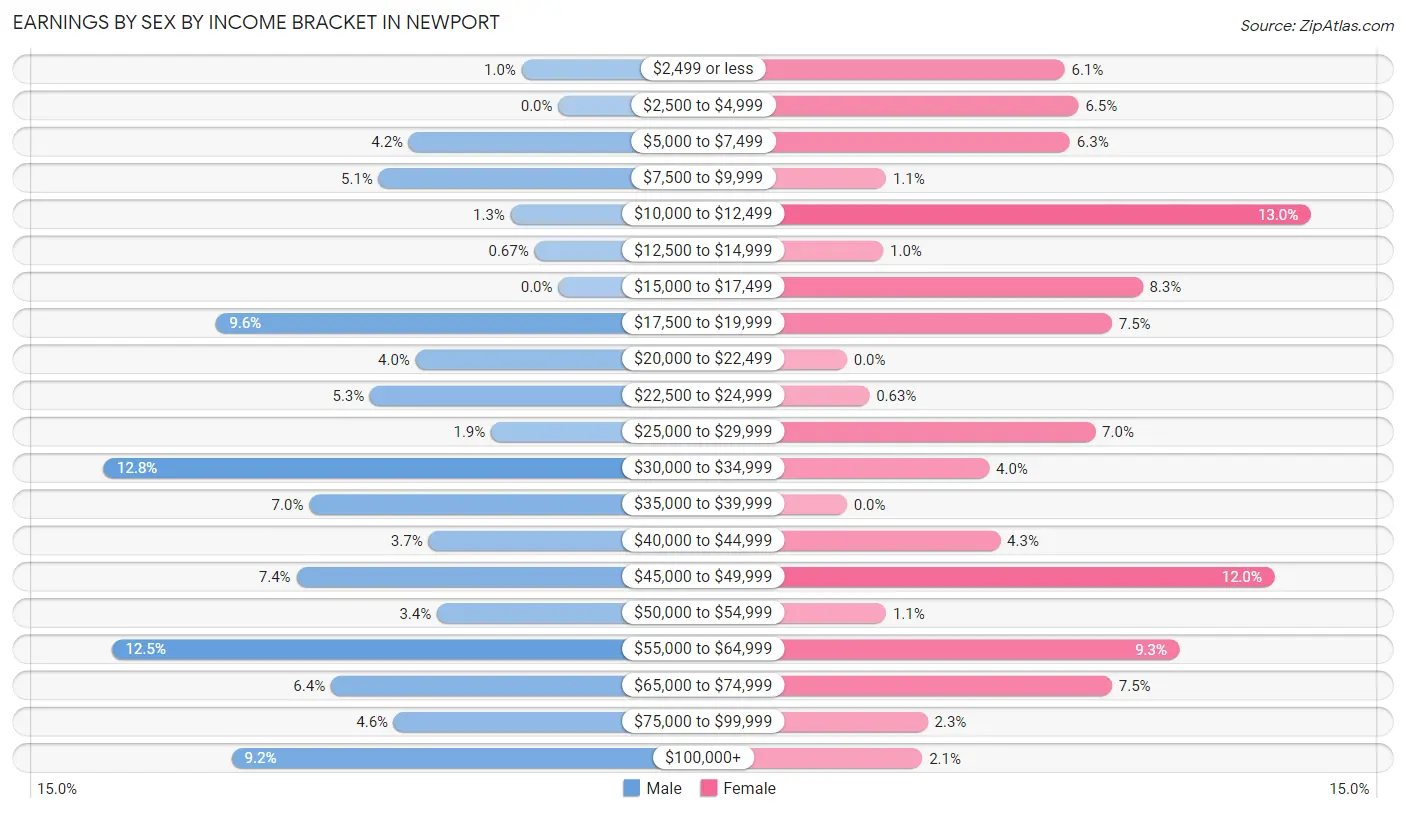
| Income | Male | Female |
| $2,499 or less | 17 (1.0%) | 78 (6.1%) |
| $2,500 to $4,999 | 0 (0.0%) | 83 (6.5%) |
| $5,000 to $7,499 | 69 (4.2%) | 80 (6.3%) |
| $7,500 to $9,999 | 83 (5.1%) | 14 (1.1%) |
| $10,000 to $12,499 | 22 (1.3%) | 166 (13.0%) |
| $12,500 to $14,999 | 11 (0.7%) | 13 (1.0%) |
| $15,000 to $17,499 | 0 (0.0%) | 106 (8.3%) |
| $17,500 to $19,999 | 158 (9.6%) | 95 (7.4%) |
| $20,000 to $22,499 | 66 (4.0%) | 0 (0.0%) |
| $22,500 to $24,999 | 87 (5.3%) | 8 (0.6%) |
| $25,000 to $29,999 | 31 (1.9%) | 89 (7.0%) |
| $30,000 to $34,999 | 210 (12.8%) | 51 (4.0%) |
| $35,000 to $39,999 | 115 (7.0%) | 0 (0.0%) |
| $40,000 to $44,999 | 60 (3.6%) | 55 (4.3%) |
| $45,000 to $49,999 | 121 (7.4%) | 153 (12.0%) |
| $50,000 to $54,999 | 56 (3.4%) | 14 (1.1%) |
| $55,000 to $64,999 | 206 (12.5%) | 119 (9.3%) |
| $65,000 to $74,999 | 105 (6.4%) | 95 (7.4%) |
| $75,000 to $99,999 | 76 (4.6%) | 29 (2.3%) |
| $100,000+ | 151 (9.2%) | 27 (2.1%) |
| Total | 1,644 (100.0%) | 1,275 (100.0%) |
Earnings by Sex by Educational Attainment in Newport
Average earnings in Newport are $46,836 for men and $28,780 for women, a difference of 38.6%. Men with an educational attainment of bachelor's degree enjoy the highest average annual earnings of $57,162, while those with high school diploma education earn the least with $40,861. Women with an educational attainment of high school diploma earn the most with the average annual earnings of $41,938, while those with college or associate's degree education have the smallest earnings of $29,500.
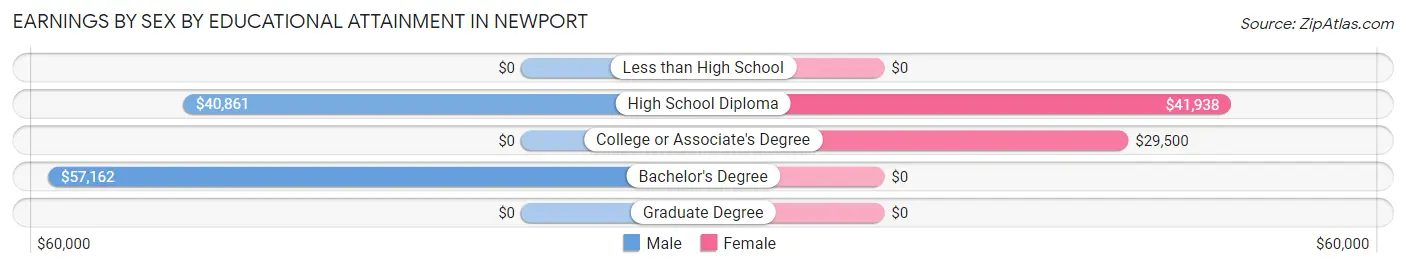
| Educational Attainment | Male Income | Female Income |
| Less than High School | - | - |
| High School Diploma | $40,861 | $41,938 |
| College or Associate's Degree | - | - |
| Bachelor's Degree | $57,162 | $0 |
| Graduate Degree | - | - |
| Total | $46,836 | $28,780 |
Family Income in Newport
Family Income Brackets in Newport
According to the Newport family income data, there are 174 families falling into the $75,000 to $99,999 income range, which is the most common income bracket and makes up 17.5% of all families. Conversely, the $10,000 to $14,999 income bracket is the least frequent group with only 25 families (2.5%) belonging to this category.
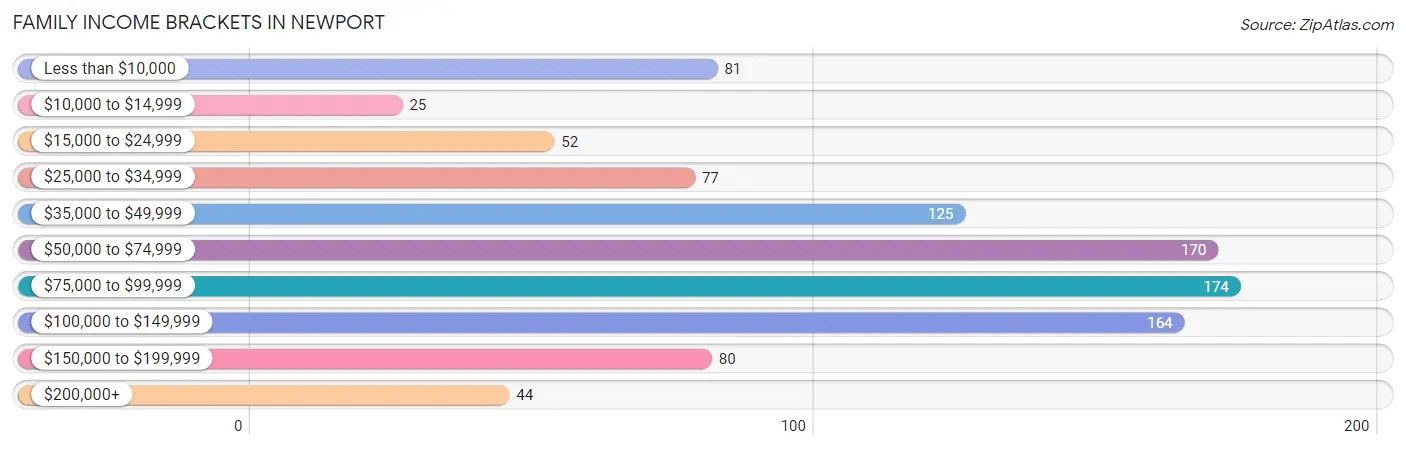
| Income Bracket | # Families | % Families |
| Less than $10,000 | 81 | 8.2% |
| $10,000 to $14,999 | 25 | 2.5% |
| $15,000 to $24,999 | 52 | 5.2% |
| $25,000 to $34,999 | 77 | 7.8% |
| $35,000 to $49,999 | 125 | 12.6% |
| $50,000 to $74,999 | 170 | 17.1% |
| $75,000 to $99,999 | 174 | 17.5% |
| $100,000 to $149,999 | 164 | 16.5% |
| $150,000 to $199,999 | 80 | 8.1% |
| $200,000+ | 44 | 4.4% |
Family Income by Famaliy Size in Newport
3-person families (288 | 29.0%) account for the highest median family income in Newport with $94,500 per family, while 3-person families (288 | 29.0%) have the highest median income of $31,500 per family member.
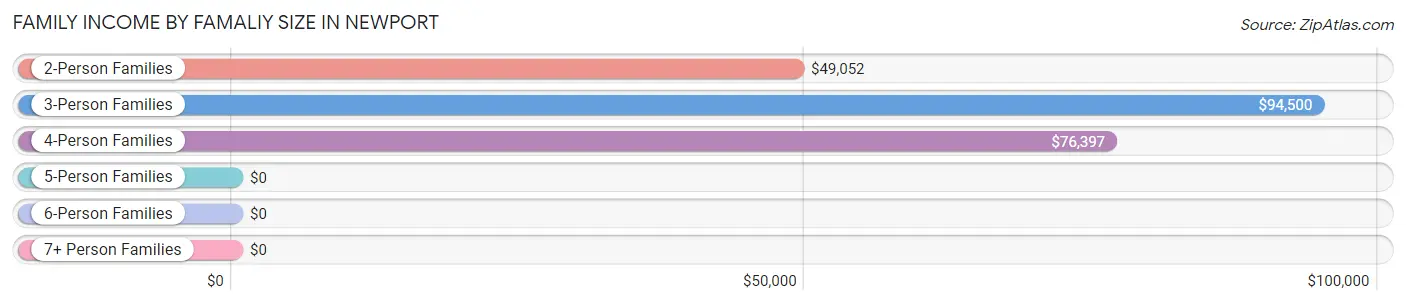
| Income Bracket | # Families | Median Income |
| 2-Person Families | 533 (53.7%) | $49,052 |
| 3-Person Families | 288 (29.0%) | $94,500 |
| 4-Person Families | 120 (12.1%) | $76,397 |
| 5-Person Families | 26 (2.6%) | $0 |
| 6-Person Families | 25 (2.5%) | $0 |
| 7+ Person Families | 0 (0.0%) | $0 |
| Total | 992 (100.0%) | $67,008 |
Family Income by Number of Earners in Newport
The median family income in Newport is $67,008, with families comprising 3+ earners (120) having the highest median family income of $143,315, while families with no earners (256) have the lowest median family income of $30,317, accounting for 12.1% and 25.8% of families, respectively.
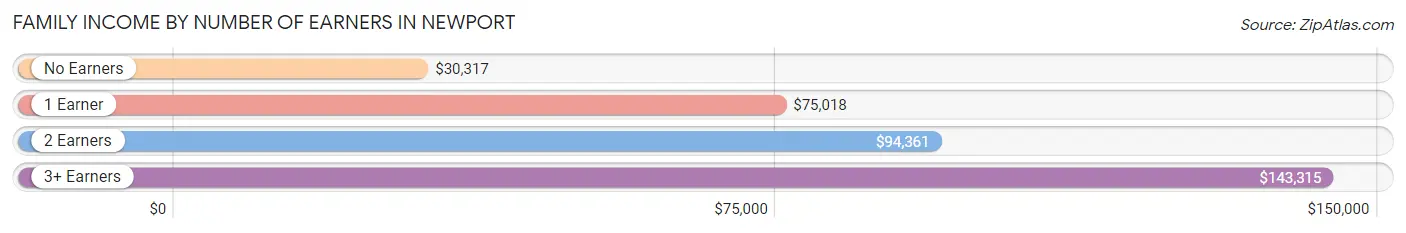
| Number of Earners | # Families | Median Income |
| No Earners | 256 (25.8%) | $30,317 |
| 1 Earner | 345 (34.8%) | $75,018 |
| 2 Earners | 271 (27.3%) | $94,361 |
| 3+ Earners | 120 (12.1%) | $143,315 |
| Total | 992 (100.0%) | $67,008 |
Household Income in Newport
Household Income Brackets in Newport
With 414 households falling in the category, the $75,000 to $99,999 income range is the most frequent in Newport, accounting for 21.4% of all households. In contrast, only 50 households (2.6%) fall into the $10,000 to $14,999 income bracket, making it the least populous group.
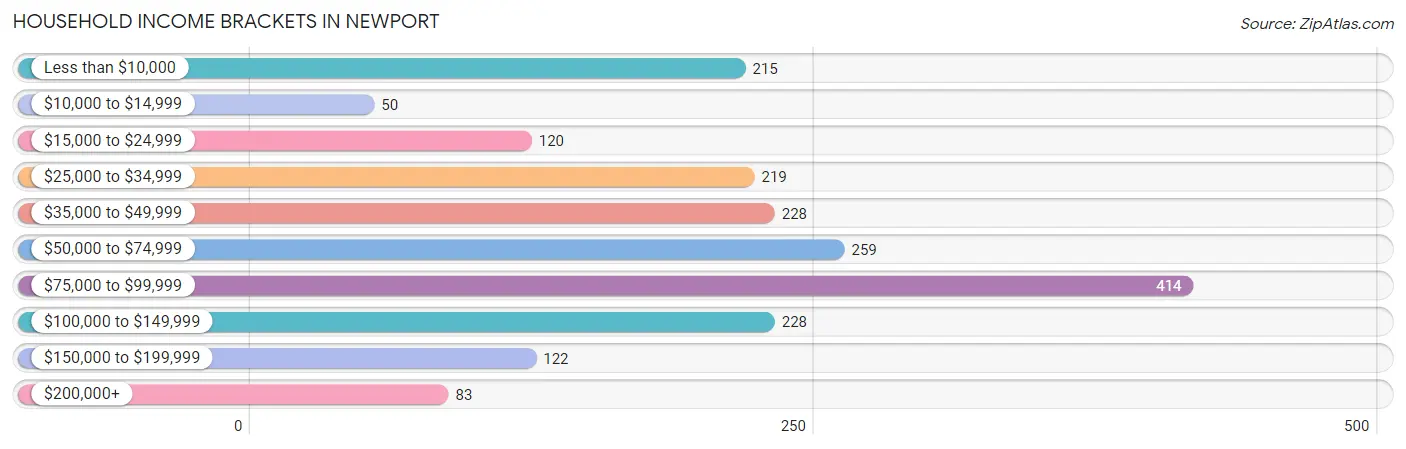
| Income Bracket | # Households | % Households |
| Less than $10,000 | 215 | 11.1% |
| $10,000 to $14,999 | 50 | 2.6% |
| $15,000 to $24,999 | 120 | 6.2% |
| $25,000 to $34,999 | 219 | 11.3% |
| $35,000 to $49,999 | 228 | 11.8% |
| $50,000 to $74,999 | 259 | 13.4% |
| $75,000 to $99,999 | 414 | 21.4% |
| $100,000 to $149,999 | 228 | 11.8% |
| $150,000 to $199,999 | 122 | 6.3% |
| $200,000+ | 83 | 4.3% |
Household Income by Householder Age in Newport
The median household income in Newport is $67,500, with the highest median household income of $98,313 found in the 15 to 24 years age bracket for the primary householder. A total of 112 households (5.8%) fall into this category. Meanwhile, the 65+ years age bracket for the primary householder has the lowest median household income of $32,083, with 614 households (31.7%) in this group.
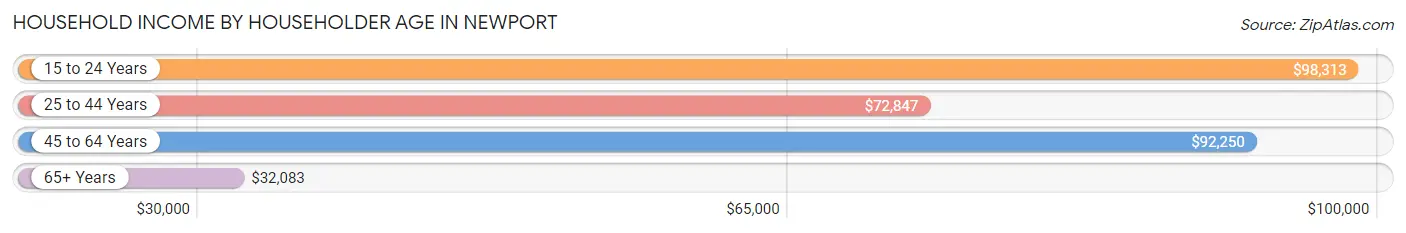
| Income Bracket | # Households | Median Income |
| 15 to 24 Years | 112 (5.8%) | $98,313 |
| 25 to 44 Years | 645 (33.3%) | $72,847 |
| 45 to 64 Years | 565 (29.2%) | $92,250 |
| 65+ Years | 614 (31.7%) | $32,083 |
| Total | 1,936 (100.0%) | $67,500 |
Poverty in Newport
Income Below Poverty by Sex and Age in Newport
With 11.4% poverty level for males and 19.4% for females among the residents of Newport, 75 year old and over males and 6 to 11 year old females are the most vulnerable to poverty, with 48 males (30.0%) and 55 females (49.5%) in their respective age groups living below the poverty level.
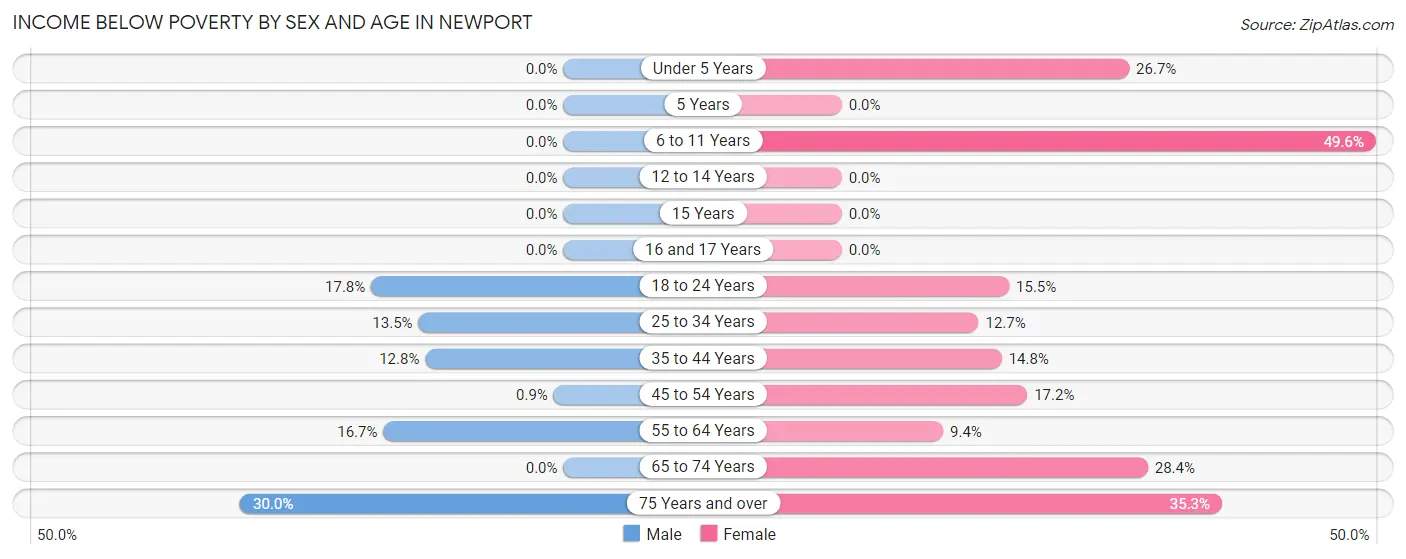
| Age Bracket | Male | Female |
| Under 5 Years | 0 (0.0%) | 24 (26.7%) |
| 5 Years | 0 (0.0%) | 0 (0.0%) |
| 6 to 11 Years | 0 (0.0%) | 55 (49.5%) |
| 12 to 14 Years | 0 (0.0%) | 0 (0.0%) |
| 15 Years | 0 (0.0%) | 0 (0.0%) |
| 16 and 17 Years | 0 (0.0%) | 0 (0.0%) |
| 18 to 24 Years | 99 (17.8%) | 25 (15.5%) |
| 25 to 34 Years | 78 (13.5%) | 33 (12.7%) |
| 35 to 44 Years | 15 (12.8%) | 50 (14.8%) |
| 45 to 54 Years | 3 (0.9%) | 69 (17.2%) |
| 55 to 64 Years | 68 (16.7%) | 44 (9.4%) |
| 65 to 74 Years | 0 (0.0%) | 71 (28.4%) |
| 75 Years and over | 48 (30.0%) | 91 (35.3%) |
| Total | 311 (11.4%) | 462 (19.4%) |
Income Above Poverty by Sex and Age in Newport
According to the poverty statistics in Newport, males aged under 5 years and females aged 12 to 14 years are the age groups that are most secure financially, with 100.0% of males and 100.0% of females in these age groups living above the poverty line.
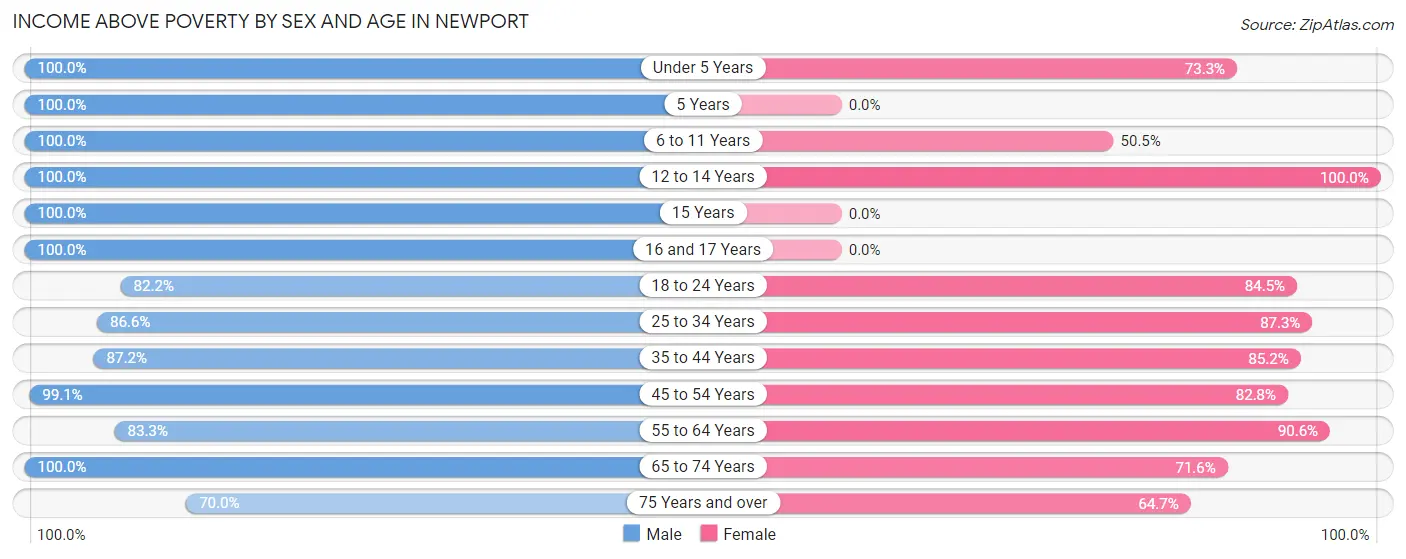
| Age Bracket | Male | Female |
| Under 5 Years | 93 (100.0%) | 66 (73.3%) |
| 5 Years | 35 (100.0%) | 0 (0.0%) |
| 6 to 11 Years | 34 (100.0%) | 56 (50.4%) |
| 12 to 14 Years | 9 (100.0%) | 40 (100.0%) |
| 15 Years | 27 (100.0%) | 0 (0.0%) |
| 16 and 17 Years | 188 (100.0%) | 0 (0.0%) |
| 18 to 24 Years | 456 (82.2%) | 136 (84.5%) |
| 25 to 34 Years | 502 (86.6%) | 227 (87.3%) |
| 35 to 44 Years | 102 (87.2%) | 287 (85.2%) |
| 45 to 54 Years | 331 (99.1%) | 332 (82.8%) |
| 55 to 64 Years | 339 (83.3%) | 424 (90.6%) |
| 65 to 74 Years | 197 (100.0%) | 179 (71.6%) |
| 75 Years and over | 112 (70.0%) | 167 (64.7%) |
| Total | 2,425 (88.6%) | 1,914 (80.6%) |
Income Below Poverty Among Married-Couple Families in Newport
The poverty statistics for married-couple families in Newport show that 8.3% or 64 of the total 769 families live below the poverty line. Families with no children have the highest poverty rate of 12.1%, comprising of 64 families. On the other hand, families with 1 or 2 children have the lowest poverty rate of 0.0%, which includes 0 families.
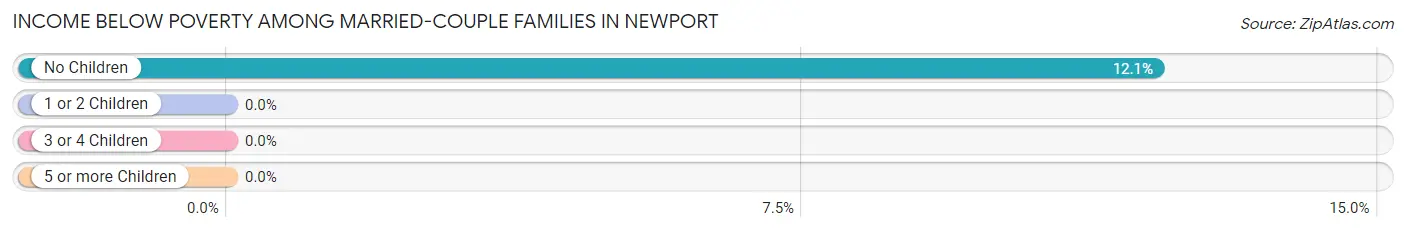
| Children | Above Poverty | Below Poverty |
| No Children | 465 (87.9%) | 64 (12.1%) |
| 1 or 2 Children | 189 (100.0%) | 0 (0.0%) |
| 3 or 4 Children | 51 (100.0%) | 0 (0.0%) |
| 5 or more Children | 0 (0.0%) | 0 (0.0%) |
| Total | 705 (91.7%) | 64 (8.3%) |
Income Below Poverty Among Single-Parent Households in Newport
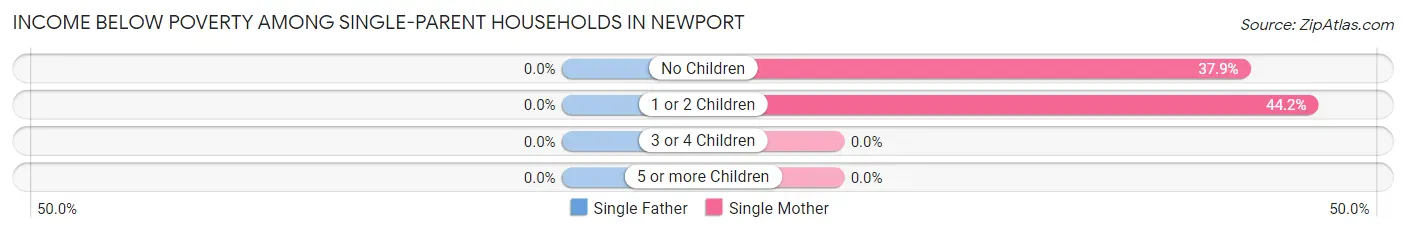
| Children | Single Father | Single Mother |
| No Children | 0 (0.0%) | 25 (37.9%) |
| 1 or 2 Children | 0 (0.0%) | 61 (44.2%) |
| 3 or 4 Children | 0 (0.0%) | 0 (0.0%) |
| 5 or more Children | 0 (0.0%) | 0 (0.0%) |
| Total | 0 (0.0%) | 86 (41.3%) |
Income Below Poverty Among Married-Couple vs Single-Parent Households in Newport
The poverty data for Newport shows that 64 of the married-couple family households (8.3%) and 86 of the single-parent households (38.6%) are living below the poverty level. Within the married-couple family households, those with no children have the highest poverty rate, with 64 households (12.1%) falling below the poverty line. Among the single-parent households, those with 1 or 2 children have the highest poverty rate, with 61 household (41.8%) living below poverty.
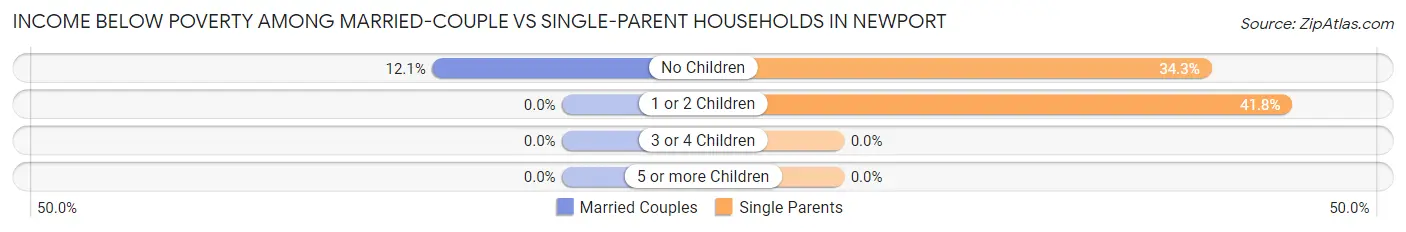
| Children | Married-Couple Families | Single-Parent Households |
| No Children | 64 (12.1%) | 25 (34.3%) |
| 1 or 2 Children | 0 (0.0%) | 61 (41.8%) |
| 3 or 4 Children | 0 (0.0%) | 0 (0.0%) |
| 5 or more Children | 0 (0.0%) | 0 (0.0%) |
| Total | 64 (8.3%) | 86 (38.6%) |
Race in Newport
The most populous races in Newport are White / Caucasian (5,026 | 96.1%), Hispanic or Latino (255 | 4.9%), and Two or more Races (109 | 2.1%).
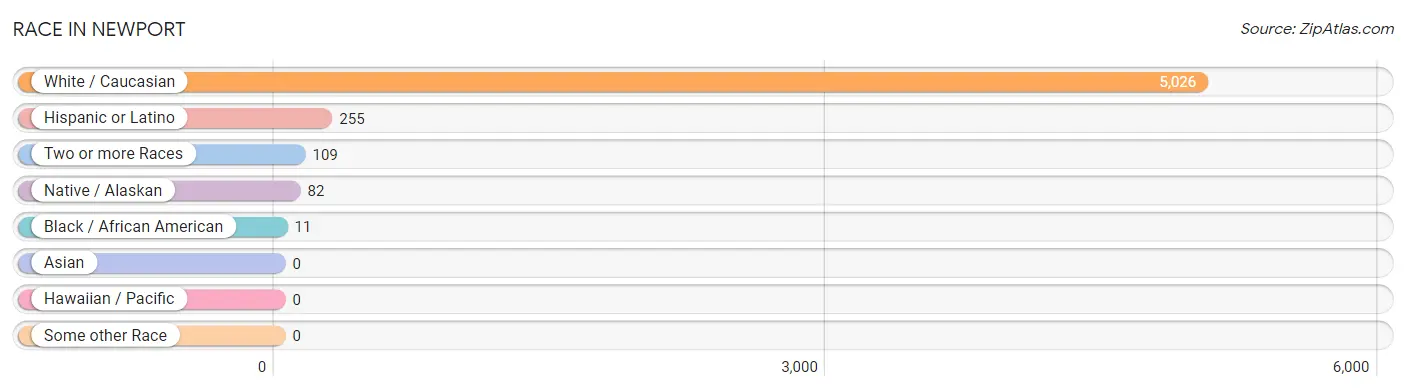
| Race | # Population | % Population |
| Asian | 0 | 0.0% |
| Black / African American | 11 | 0.2% |
| Hawaiian / Pacific | 0 | 0.0% |
| Hispanic or Latino | 255 | 4.9% |
| Native / Alaskan | 82 | 1.6% |
| White / Caucasian | 5,026 | 96.1% |
| Two or more Races | 109 | 2.1% |
| Some other Race | 0 | 0.0% |
| Total | 5,228 | 100.0% |
Ancestry in Newport
The most populous ancestries reported in Newport are English (852 | 16.3%), French (735 | 14.1%), American (509 | 9.7%), Irish (443 | 8.5%), and Mexican (255 | 4.9%), together accounting for 53.4% of all Newport residents.
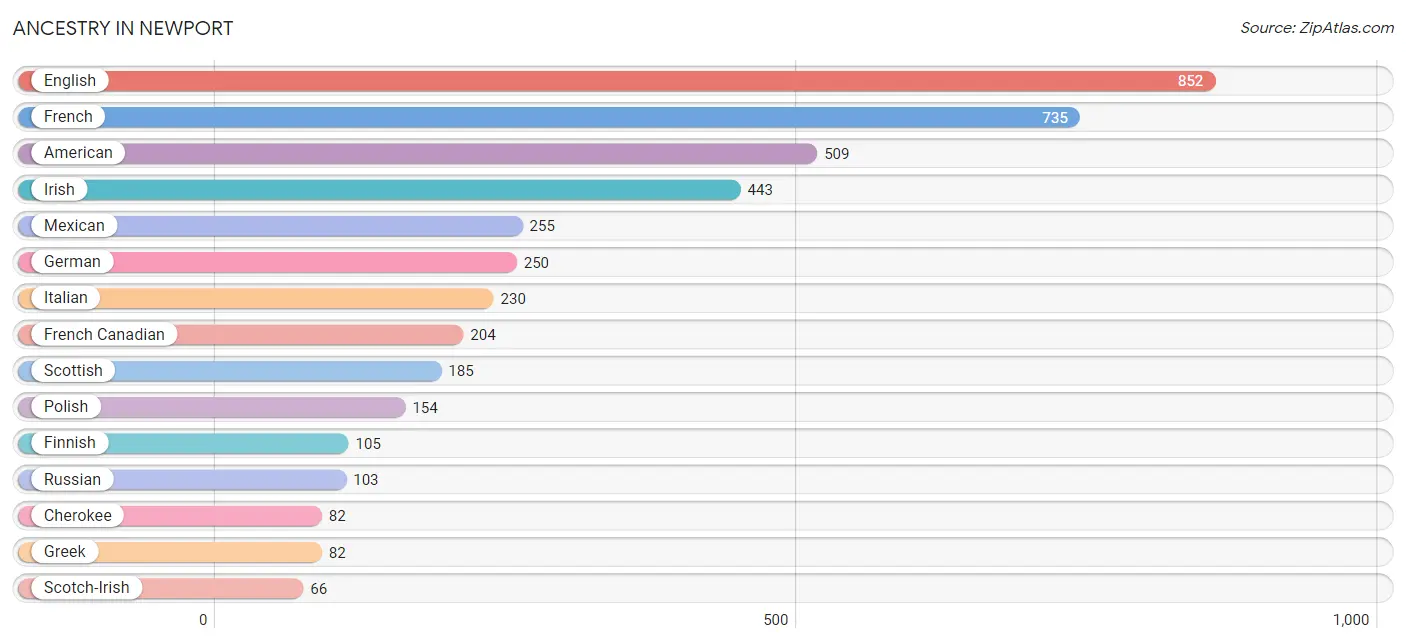
| Ancestry | # Population | % Population |
| American | 509 | 9.7% |
| Austrian | 61 | 1.2% |
| Cherokee | 82 | 1.6% |
| Czech | 9 | 0.2% |
| English | 852 | 16.3% |
| European | 25 | 0.5% |
| Finnish | 105 | 2.0% |
| French | 735 | 14.1% |
| French Canadian | 204 | 3.9% |
| German | 250 | 4.8% |
| Greek | 82 | 1.6% |
| Hungarian | 15 | 0.3% |
| Irish | 443 | 8.5% |
| Italian | 230 | 4.4% |
| Mexican | 255 | 4.9% |
| Norwegian | 36 | 0.7% |
| Polish | 154 | 2.9% |
| Portuguese | 31 | 0.6% |
| Romanian | 9 | 0.2% |
| Russian | 103 | 2.0% |
| Scotch-Irish | 66 | 1.3% |
| Scottish | 185 | 3.5% |
| South African | 24 | 0.5% |
| Subsaharan African | 24 | 0.5% |
| Swedish | 35 | 0.7% |
| Welsh | 5 | 0.1% | View All 26 Rows |
Immigrants in Newport
The most numerous immigrant groups reported in Newport came from Europe (71 | 1.4%), Germany (51 | 1.0%), Western Europe (51 | 1.0%), Northern Europe (14 | 0.3%), and Eastern Europe (6 | 0.1%), together accounting for 3.7% of all Newport residents.
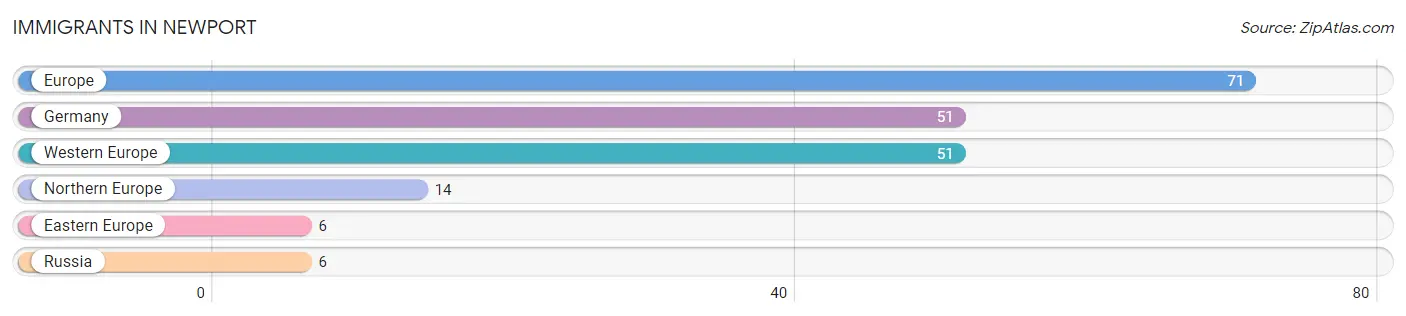
| Immigration Origin | # Population | % Population |
| Eastern Europe | 6 | 0.1% |
| Europe | 71 | 1.4% |
| Germany | 51 | 1.0% |
| Northern Europe | 14 | 0.3% |
| Russia | 6 | 0.1% |
| Western Europe | 51 | 1.0% | View All 6 Rows |
Sex and Age in Newport
Sex and Age in Newport
The most populous age groups in Newport are 15 to 19 Years (393 | 14.1%) for men and 45 to 49 Years (347 | 14.2%) for women.
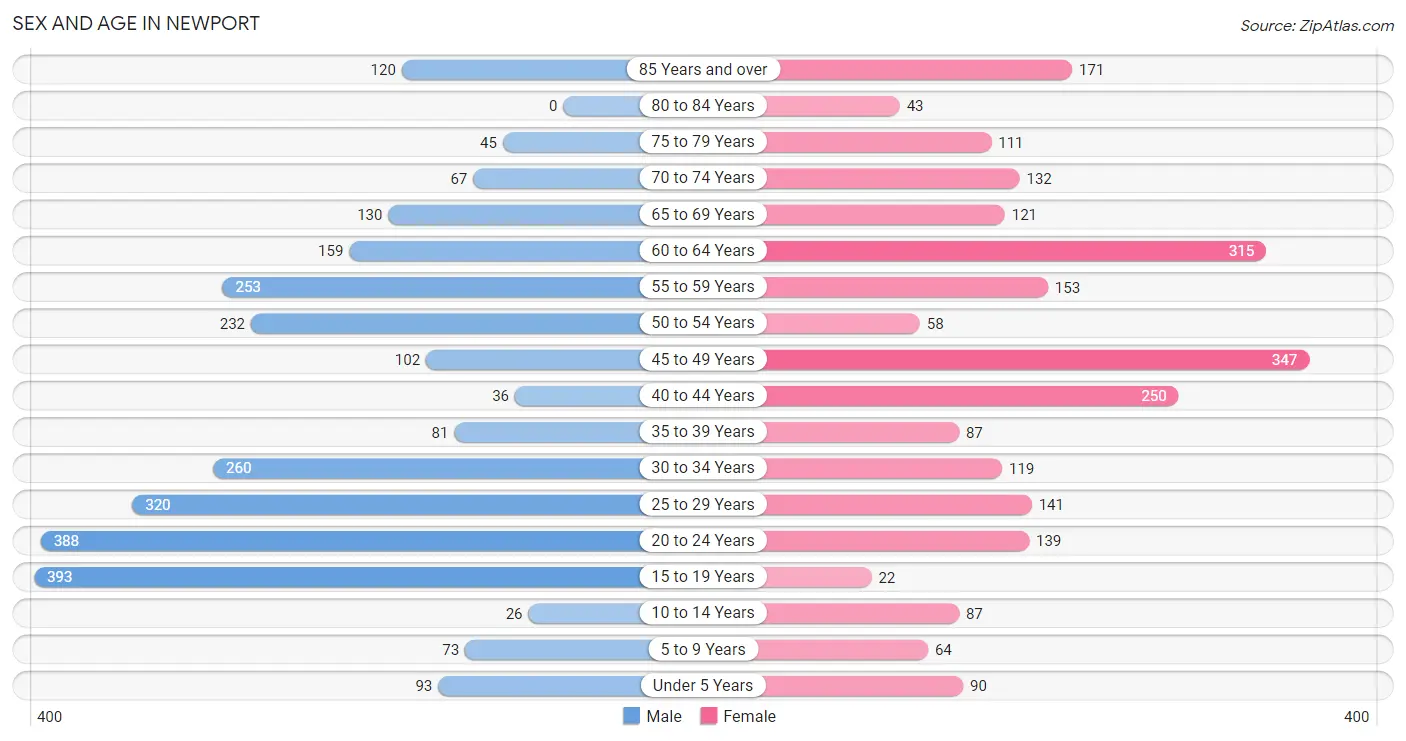
| Age Bracket | Male | Female |
| Under 5 Years | 93 (3.4%) | 90 (3.7%) |
| 5 to 9 Years | 73 (2.6%) | 64 (2.6%) |
| 10 to 14 Years | 26 (0.9%) | 87 (3.5%) |
| 15 to 19 Years | 393 (14.1%) | 22 (0.9%) |
| 20 to 24 Years | 388 (14.0%) | 139 (5.7%) |
| 25 to 29 Years | 320 (11.5%) | 141 (5.8%) |
| 30 to 34 Years | 260 (9.4%) | 119 (4.9%) |
| 35 to 39 Years | 81 (2.9%) | 87 (3.5%) |
| 40 to 44 Years | 36 (1.3%) | 250 (10.2%) |
| 45 to 49 Years | 102 (3.7%) | 347 (14.2%) |
| 50 to 54 Years | 232 (8.4%) | 58 (2.4%) |
| 55 to 59 Years | 253 (9.1%) | 153 (6.2%) |
| 60 to 64 Years | 159 (5.7%) | 315 (12.9%) |
| 65 to 69 Years | 130 (4.7%) | 121 (4.9%) |
| 70 to 74 Years | 67 (2.4%) | 132 (5.4%) |
| 75 to 79 Years | 45 (1.6%) | 111 (4.5%) |
| 80 to 84 Years | 0 (0.0%) | 43 (1.8%) |
| 85 Years and over | 120 (4.3%) | 171 (7.0%) |
| Total | 2,778 (100.0%) | 2,450 (100.0%) |
Families and Households in Newport
Median Family Size in Newport
The median family size in Newport is 3.19 persons per family, with single male/father families (15 | 1.5%) accounting for the largest median family size of 13.53 persons per family. On the other hand, married-couple families (769 | 77.5%) represent the smallest median family size with 3.00 persons per family.
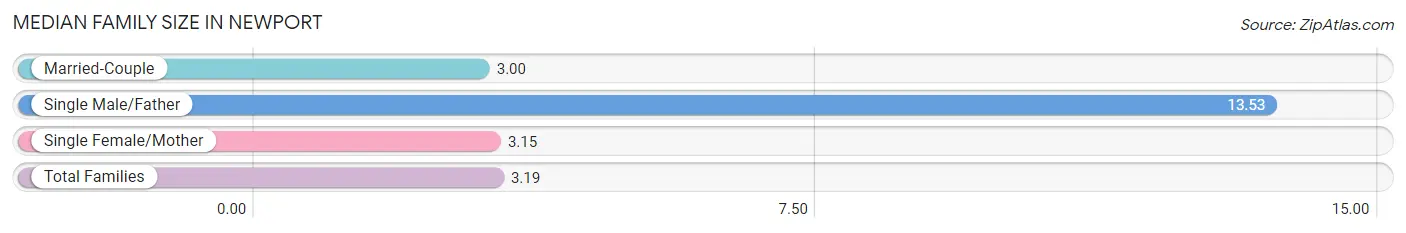
| Family Type | # Families | Family Size |
| Married-Couple | 769 (77.5%) | 3.00 |
| Single Male/Father | 15 (1.5%) | 13.53 |
| Single Female/Mother | 208 (21.0%) | 3.15 |
| Total Families | 992 (100.0%) | 3.19 |
Median Household Size in Newport
The median household size in Newport is 2.63 persons per household, with single male/father households (15 | 0.8%) accounting for the largest median household size of 14.33 persons per household. non-family households (944 | 48.8%) represent the smallest median household size with 1.65 persons per household.
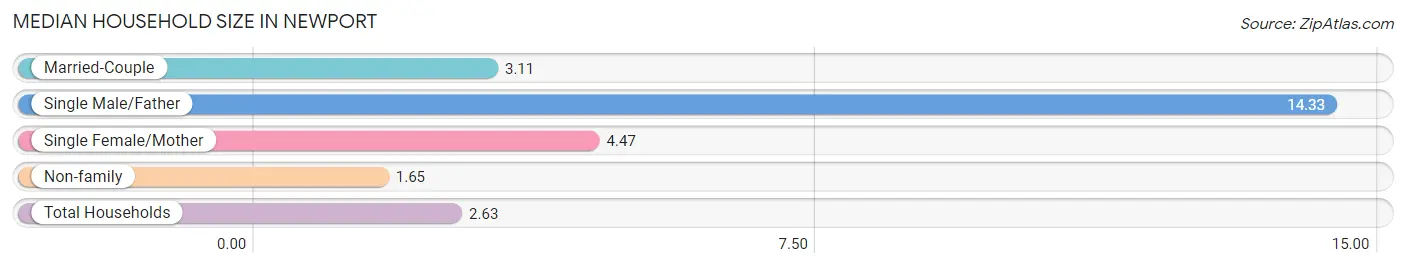
| Household Type | # Households | Household Size |
| Married-Couple | 769 (39.7%) | 3.11 |
| Single Male/Father | 15 (0.8%) | 14.33 |
| Single Female/Mother | 208 (10.7%) | 4.47 |
| Non-family | 944 (48.8%) | 1.65 |
| Total Households | 1,936 (100.0%) | 2.63 |
Household Size by Marriage Status in Newport
Out of a total of 1,936 households in Newport, 992 (51.2%) are family households, while 944 (48.8%) are nonfamily households. The most numerous type of family households are 2-person households, comprising 471, and the most common type of nonfamily households are 1-person households, comprising 597.
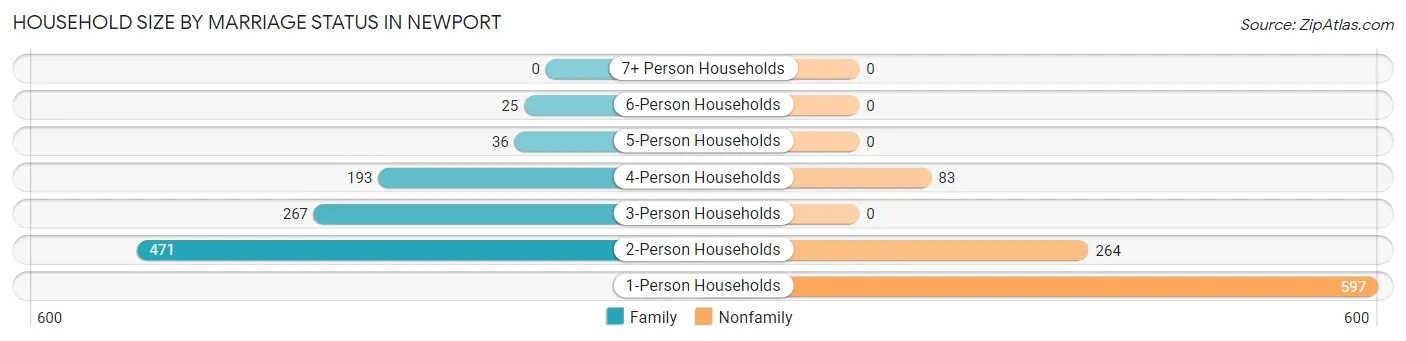
| Household Size | Family Households | Nonfamily Households |
| 1-Person Households | - | 597 (30.8%) |
| 2-Person Households | 471 (24.3%) | 264 (13.6%) |
| 3-Person Households | 267 (13.8%) | 0 (0.0%) |
| 4-Person Households | 193 (10.0%) | 83 (4.3%) |
| 5-Person Households | 36 (1.9%) | 0 (0.0%) |
| 6-Person Households | 25 (1.3%) | 0 (0.0%) |
| 7+ Person Households | 0 (0.0%) | 0 (0.0%) |
| Total | 992 (51.2%) | 944 (48.8%) |
Female Fertility in Newport
Fertility by Age in Newport
Average fertility rate in Newport is 7.0 births per 1,000 women. Women in the age bracket of 20 to 34 years have the highest fertility rate with 20.0 births per 1,000 women. Women in the age bracket of 20 to 34 years acount for 100.0% of all women with births.
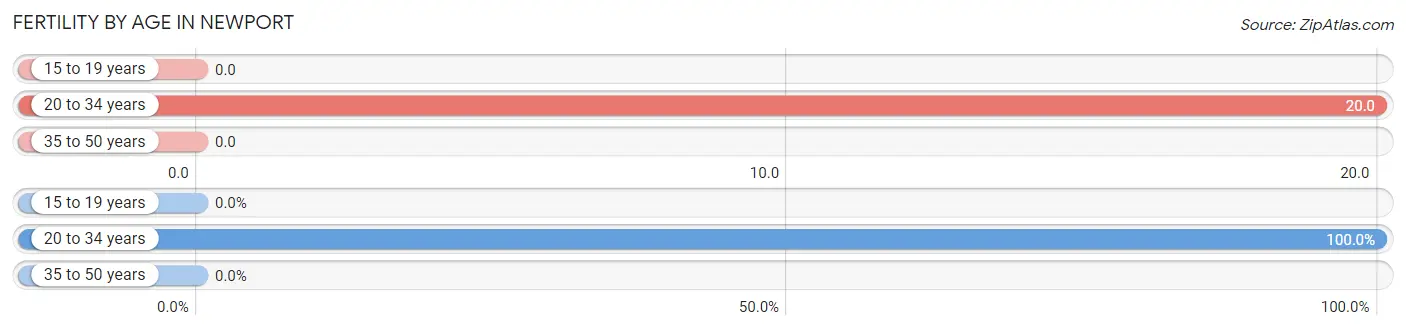
| Age Bracket | Women with Births | Births / 1,000 Women |
| 15 to 19 years | 0 (0.0%) | 0.0 |
| 20 to 34 years | 8 (100.0%) | 20.0 |
| 35 to 50 years | 0 (0.0%) | 0.0 |
| Total | 8 (100.0%) | 7.0 |
Fertility by Age by Marriage Status in Newport
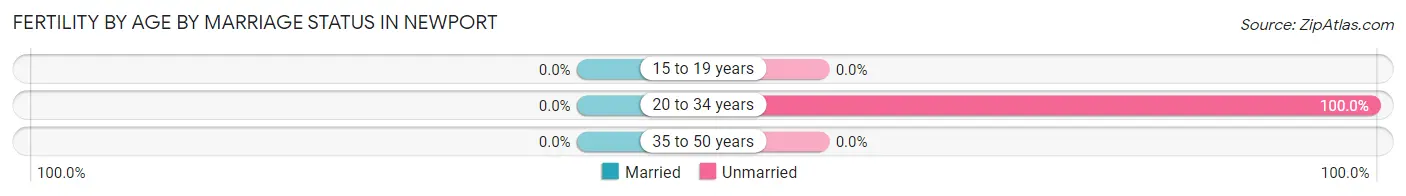
| Age Bracket | Married | Unmarried |
| 15 to 19 years | 0 (0.0%) | 0 (0.0%) |
| 20 to 34 years | 0 (0.0%) | 8 (100.0%) |
| 35 to 50 years | 0 (0.0%) | 0 (0.0%) |
| Total | 0 (0.0%) | 8 (100.0%) |
Fertility by Education in Newport
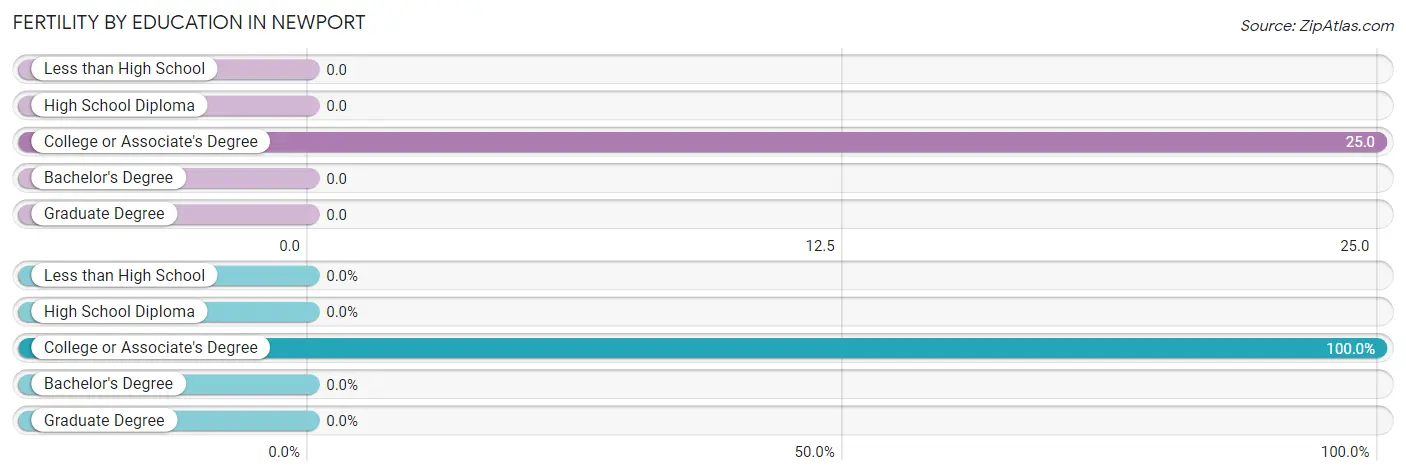
| Educational Attainment | Women with Births | Births / 1,000 Women |
| Less than High School | 0 (0.0%) | 0.0 |
| High School Diploma | 0 (0.0%) | 0.0 |
| College or Associate's Degree | 8 (100.0%) | 25.0 |
| Bachelor's Degree | 0 (0.0%) | 0.0 |
| Graduate Degree | 0 (0.0%) | 0.0 |
| Total | 8 (100.0%) | 7.0 |
Fertility by Education by Marriage Status in Newport
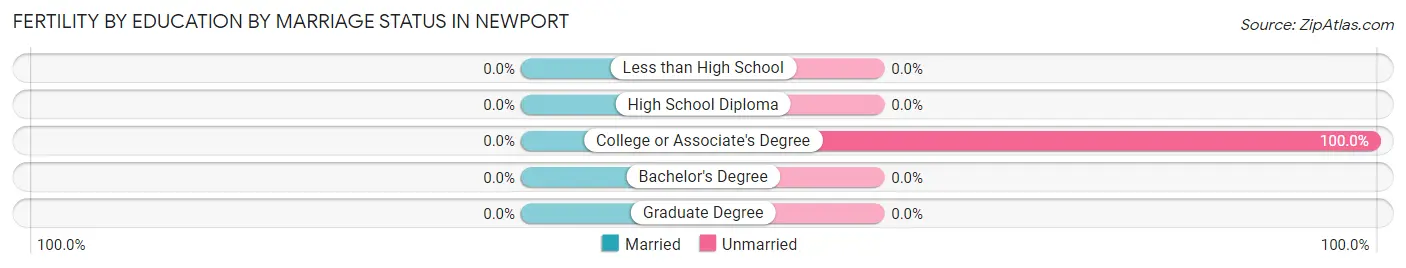
| Educational Attainment | Married | Unmarried |
| Less than High School | 0 (0.0%) | 0 (0.0%) |
| High School Diploma | 0 (0.0%) | 0 (0.0%) |
| College or Associate's Degree | 0 (0.0%) | 8 (100.0%) |
| Bachelor's Degree | 0 (0.0%) | 0 (0.0%) |
| Graduate Degree | 0 (0.0%) | 0 (0.0%) |
| Total | 0 (0.0%) | 8 (100.0%) |
Employment Characteristics in Newport
Employment by Class of Employer in Newport
Among the 2,602 employed individuals in Newport, private company employees (1,649 | 63.4%), self-employed (not incorporated) (264 | 10.2%), and not-for-profit organizations (258 | 9.9%) make up the most common classes of employment.
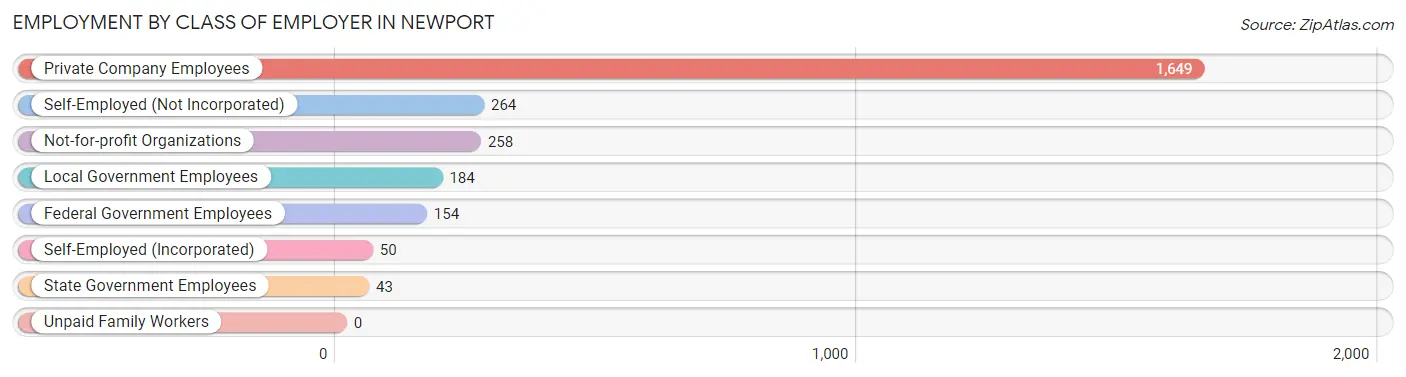
| Employer Class | # Employees | % Employees |
| Private Company Employees | 1,649 | 63.4% |
| Self-Employed (Incorporated) | 50 | 1.9% |
| Self-Employed (Not Incorporated) | 264 | 10.2% |
| Not-for-profit Organizations | 258 | 9.9% |
| Local Government Employees | 184 | 7.1% |
| State Government Employees | 43 | 1.7% |
| Federal Government Employees | 154 | 5.9% |
| Unpaid Family Workers | 0 | 0.0% |
| Total | 2,602 | 100.0% |
Employment Status by Age in Newport
According to the labor force statistics for Newport, out of the total population over 16 years of age (4,768), 57.3% or 2,732 individuals are in the labor force, with 3.9% or 107 of them unemployed. The age group with the highest labor force participation rate is 30 to 34 years, with 86.8% or 329 individuals in the labor force. Within the labor force, the 35 to 44 years age range has the highest percentage of unemployed individuals, with 25.1% or 66 of them being unemployed.
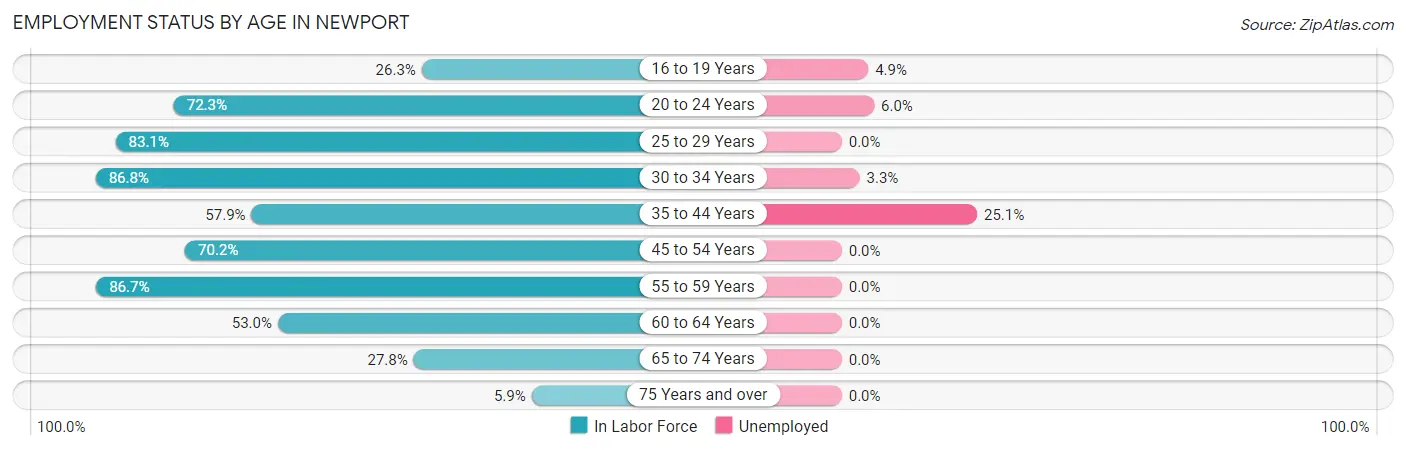
| Age Bracket | In Labor Force | Unemployed |
| 16 to 19 Years | 102 (26.3%) | 5 (4.9%) |
| 20 to 24 Years | 381 (72.3%) | 23 (6.0%) |
| 25 to 29 Years | 383 (83.1%) | 0 (0.0%) |
| 30 to 34 Years | 329 (86.8%) | 11 (3.3%) |
| 35 to 44 Years | 263 (57.9%) | 66 (25.1%) |
| 45 to 54 Years | 519 (70.2%) | 0 (0.0%) |
| 55 to 59 Years | 352 (86.7%) | 0 (0.0%) |
| 60 to 64 Years | 251 (53.0%) | 0 (0.0%) |
| 65 to 74 Years | 125 (27.8%) | 0 (0.0%) |
| 75 Years and over | 29 (5.9%) | 0 (0.0%) |
| Total | 2,732 (57.3%) | 107 (3.9%) |
Employment Status by Educational Attainment in Newport
According to labor force statistics for Newport, 72.0% of individuals (2,097) out of the total population between 25 and 64 years of age (2,913) are in the labor force, with 3.8% or 80 of them being unemployed. The group with the highest labor force participation rate are those with the educational attainment of bachelor's degree or higher, with 81.7% or 645 individuals in the labor force. Within the labor force, individuals with high school diploma education have the highest percentage of unemployment, with 7.1% or 66 of them being unemployed.
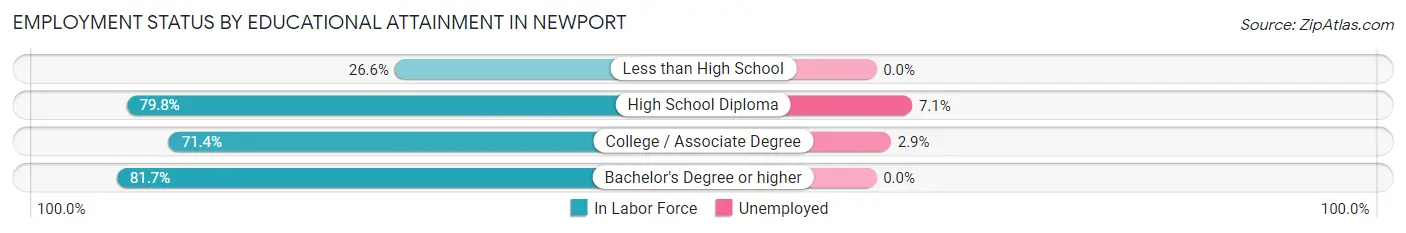
| Educational Attainment | In Labor Force | Unemployed |
| Less than High School | 97 (26.6%) | 0 (0.0%) |
| High School Diploma | 936 (79.8%) | 83 (7.1%) |
| College / Associate Degree | 419 (71.4%) | 17 (2.9%) |
| Bachelor's Degree or higher | 645 (81.7%) | 0 (0.0%) |
| Total | 2,097 (72.0%) | 111 (3.8%) |
Employment Occupations by Sex in Newport
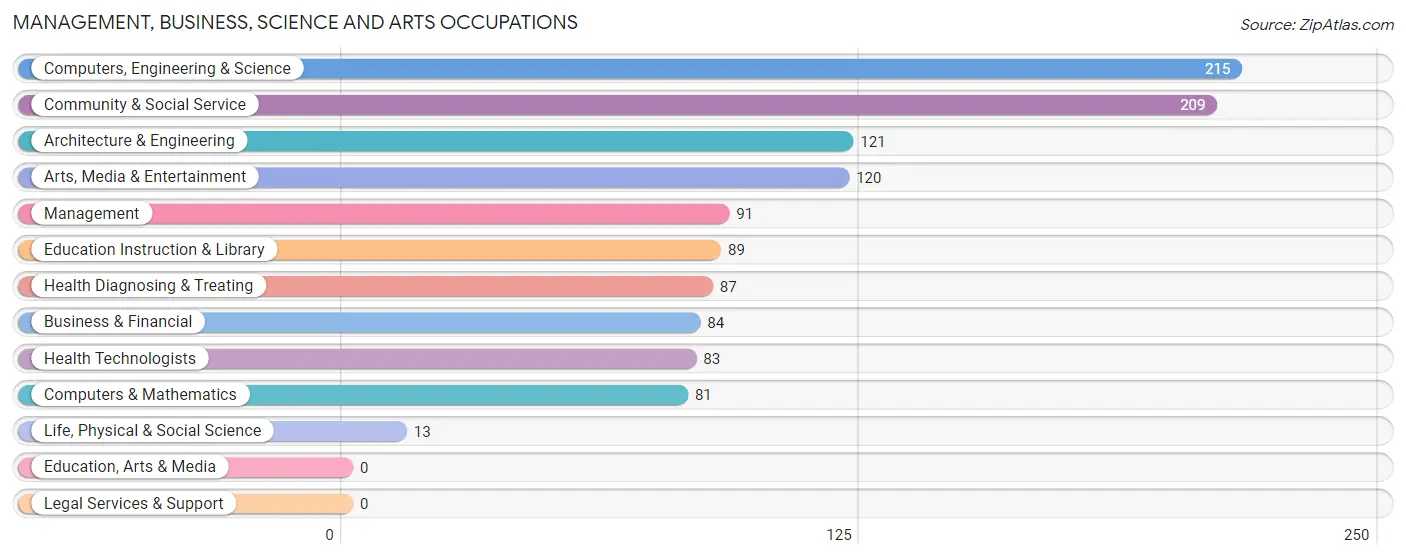
Management, Business, Science and Arts Occupations
The most common Management, Business, Science and Arts occupations in Newport are Computers, Engineering & Science (215 | 8.3%), Community & Social Service (209 | 8.1%), Architecture & Engineering (121 | 4.7%), Arts, Media & Entertainment (120 | 4.6%), and Management (91 | 3.5%).
Management, Business, Science and Arts Occupations by Sex
Within the Management, Business, Science and Arts occupations in Newport, the most male-oriented occupations are Computers, Engineering & Science (100.0%), Computers & Mathematics (100.0%), and Architecture & Engineering (100.0%), while the most female-oriented occupations are Education Instruction & Library (93.3%), Management (79.1%), and Health Diagnosing & Treating (74.7%).
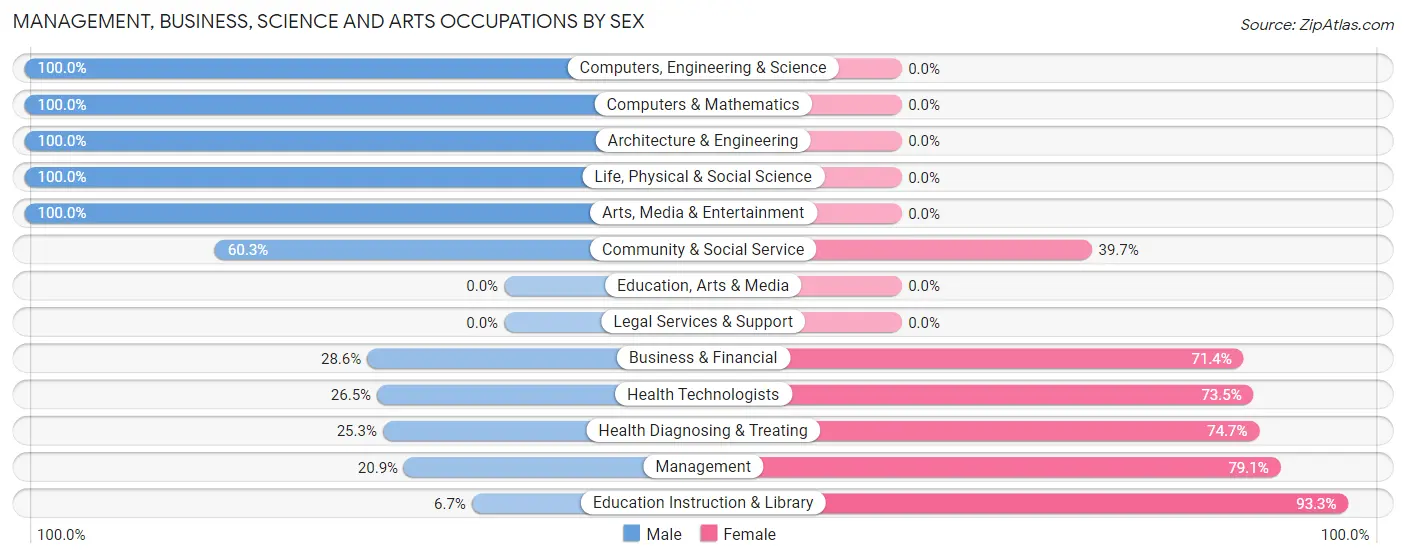
| Occupation | Male | Female |
| Management | 19 (20.9%) | 72 (79.1%) |
| Business & Financial | 24 (28.6%) | 60 (71.4%) |
| Computers, Engineering & Science | 215 (100.0%) | 0 (0.0%) |
| Computers & Mathematics | 81 (100.0%) | 0 (0.0%) |
| Architecture & Engineering | 121 (100.0%) | 0 (0.0%) |
| Life, Physical & Social Science | 13 (100.0%) | 0 (0.0%) |
| Community & Social Service | 126 (60.3%) | 83 (39.7%) |
| Education, Arts & Media | 0 (0.0%) | 0 (0.0%) |
| Legal Services & Support | 0 (0.0%) | 0 (0.0%) |
| Education Instruction & Library | 6 (6.7%) | 83 (93.3%) |
| Arts, Media & Entertainment | 120 (100.0%) | 0 (0.0%) |
| Health Diagnosing & Treating | 22 (25.3%) | 65 (74.7%) |
| Health Technologists | 22 (26.5%) | 61 (73.5%) |
| Total (Category) | 406 (59.2%) | 280 (40.8%) |
| Total (Overall) | 1,459 (56.5%) | 1,124 (43.5%) |
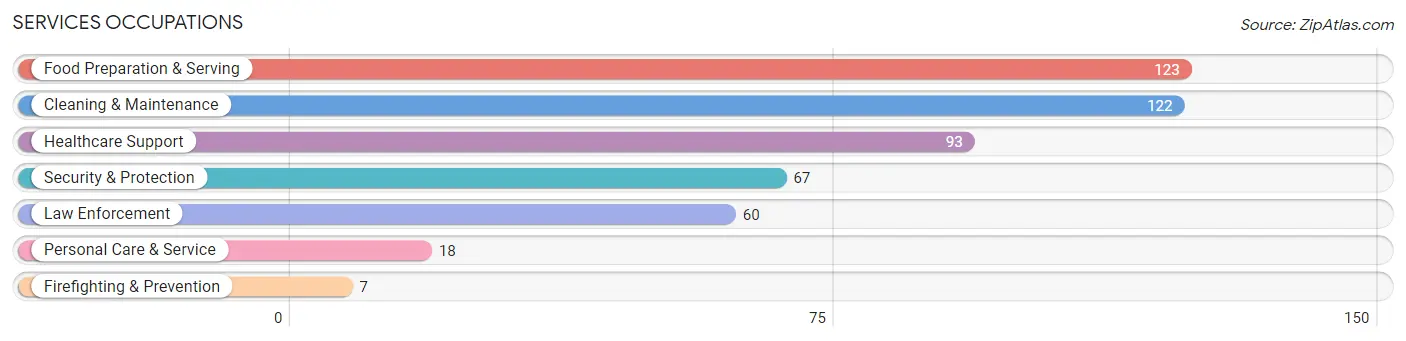
Services Occupations
The most common Services occupations in Newport are Food Preparation & Serving (123 | 4.8%), Cleaning & Maintenance (122 | 4.7%), Healthcare Support (93 | 3.6%), Security & Protection (67 | 2.6%), and Law Enforcement (60 | 2.3%).
Services Occupations by Sex
Within the Services occupations in Newport, the most male-oriented occupations are Security & Protection (100.0%), Firefighting & Prevention (100.0%), and Law Enforcement (100.0%), while the most female-oriented occupations are Personal Care & Service (100.0%), Healthcare Support (94.6%), and Food Preparation & Serving (67.5%).
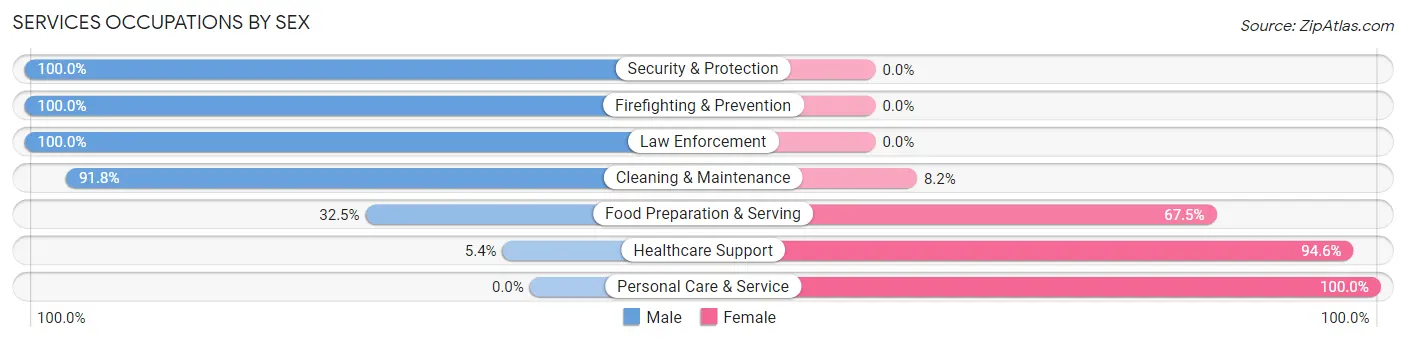
| Occupation | Male | Female |
| Healthcare Support | 5 (5.4%) | 88 (94.6%) |
| Security & Protection | 67 (100.0%) | 0 (0.0%) |
| Firefighting & Prevention | 7 (100.0%) | 0 (0.0%) |
| Law Enforcement | 60 (100.0%) | 0 (0.0%) |
| Food Preparation & Serving | 40 (32.5%) | 83 (67.5%) |
| Cleaning & Maintenance | 112 (91.8%) | 10 (8.2%) |
| Personal Care & Service | 0 (0.0%) | 18 (100.0%) |
| Total (Category) | 224 (53.0%) | 199 (47.0%) |
| Total (Overall) | 1,459 (56.5%) | 1,124 (43.5%) |
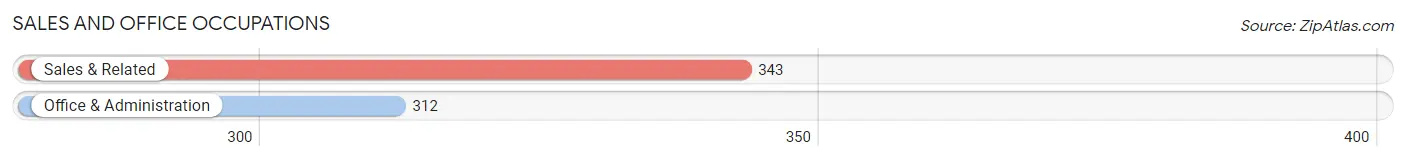
Sales and Office Occupations
The most common Sales and Office occupations in Newport are Sales & Related (343 | 13.3%), and Office & Administration (312 | 12.1%).
Sales and Office Occupations by Sex
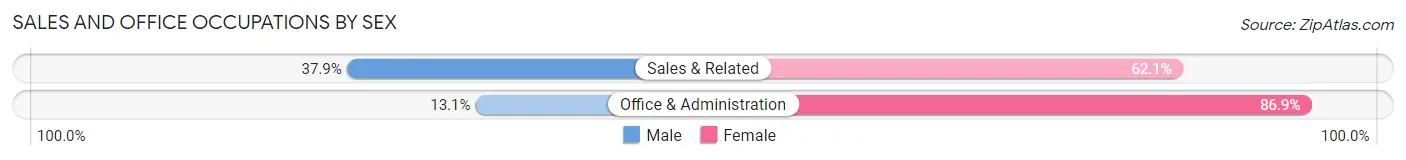
| Occupation | Male | Female |
| Sales & Related | 130 (37.9%) | 213 (62.1%) |
| Office & Administration | 41 (13.1%) | 271 (86.9%) |
| Total (Category) | 171 (26.1%) | 484 (73.9%) |
| Total (Overall) | 1,459 (56.5%) | 1,124 (43.5%) |
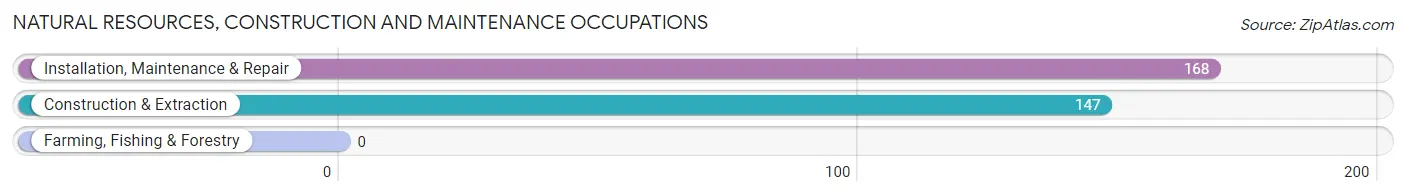
Natural Resources, Construction and Maintenance Occupations
The most common Natural Resources, Construction and Maintenance occupations in Newport are Installation, Maintenance & Repair (168 | 6.5%), and Construction & Extraction (147 | 5.7%).
Natural Resources, Construction and Maintenance Occupations by Sex
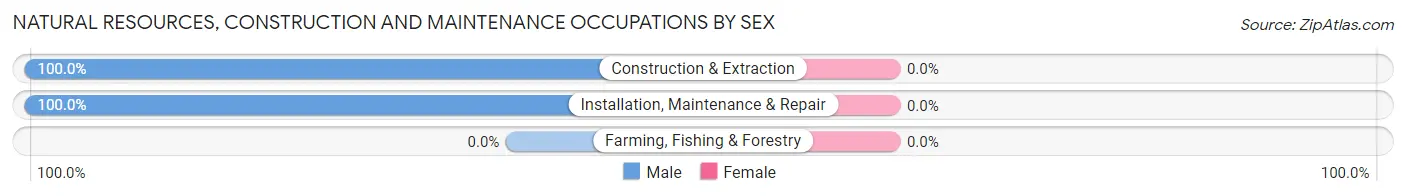
| Occupation | Male | Female |
| Farming, Fishing & Forestry | 0 (0.0%) | 0 (0.0%) |
| Construction & Extraction | 147 (100.0%) | 0 (0.0%) |
| Installation, Maintenance & Repair | 168 (100.0%) | 0 (0.0%) |
| Total (Category) | 315 (100.0%) | 0 (0.0%) |
| Total (Overall) | 1,459 (56.5%) | 1,124 (43.5%) |
Production, Transportation and Moving Occupations
The most common Production, Transportation and Moving occupations in Newport are Production (336 | 13.0%), Transportation (85 | 3.3%), and Material Moving (83 | 3.2%).
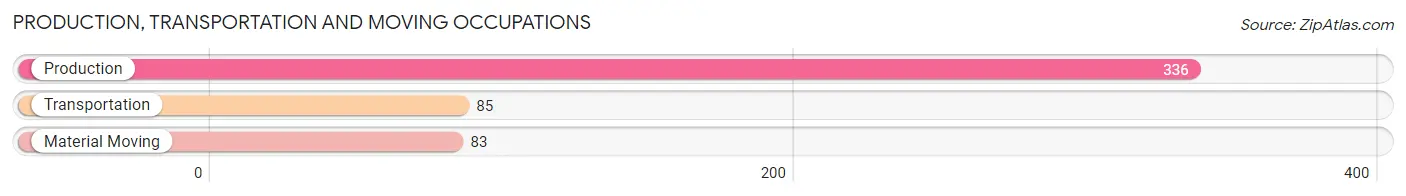
Production, Transportation and Moving Occupations by Sex
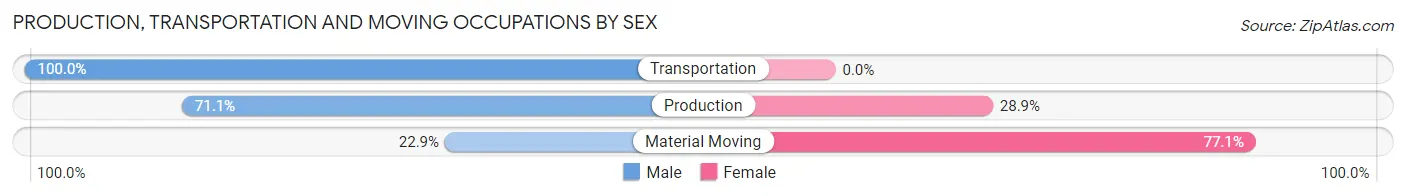
| Occupation | Male | Female |
| Production | 239 (71.1%) | 97 (28.9%) |
| Transportation | 85 (100.0%) | 0 (0.0%) |
| Material Moving | 19 (22.9%) | 64 (77.1%) |
| Total (Category) | 343 (68.1%) | 161 (31.9%) |
| Total (Overall) | 1,459 (56.5%) | 1,124 (43.5%) |
Employment Industries by Sex in Newport
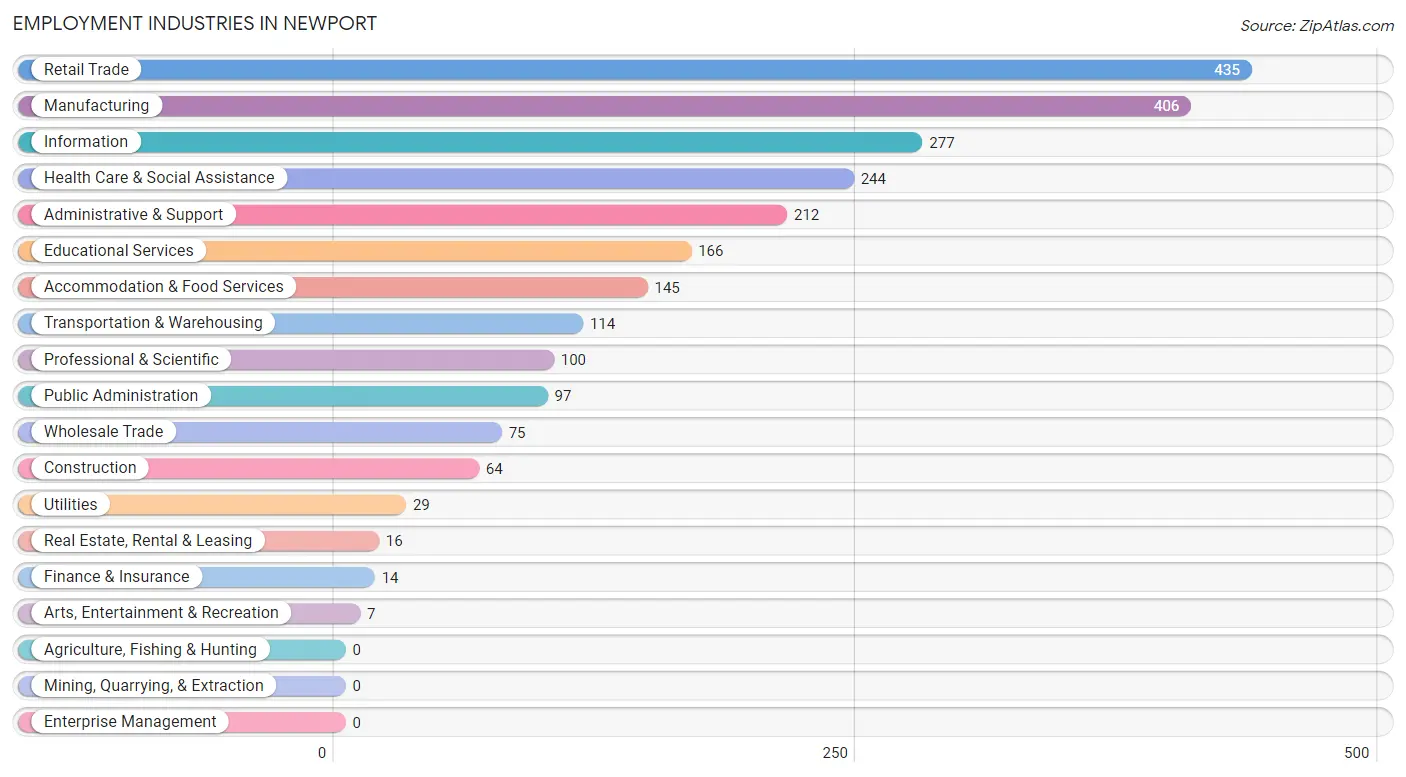
Employment Industries in Newport
The major employment industries in Newport include Retail Trade (435 | 16.8%), Manufacturing (406 | 15.7%), Information (277 | 10.7%), Health Care & Social Assistance (244 | 9.5%), and Administrative & Support (212 | 8.2%).
Employment Industries by Sex in Newport
The Newport industries that see more men than women are Utilities (100.0%), Administrative & Support (89.1%), and Professional & Scientific (89.0%), whereas the industries that tend to have a higher number of women are Transportation & Warehousing (100.0%), Finance & Insurance (100.0%), and Real Estate, Rental & Leasing (100.0%).
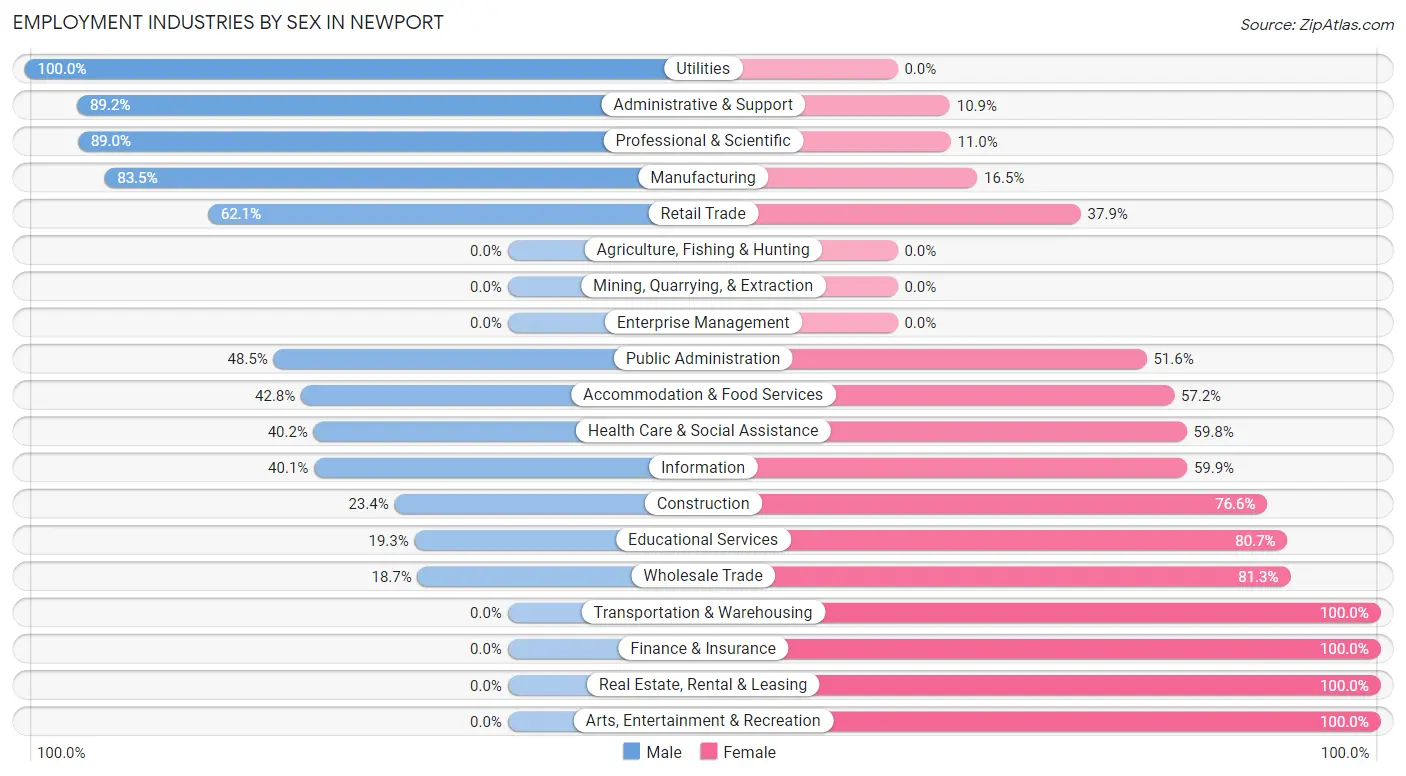
| Industry | Male | Female |
| Agriculture, Fishing & Hunting | 0 (0.0%) | 0 (0.0%) |
| Mining, Quarrying, & Extraction | 0 (0.0%) | 0 (0.0%) |
| Construction | 15 (23.4%) | 49 (76.6%) |
| Manufacturing | 339 (83.5%) | 67 (16.5%) |
| Wholesale Trade | 14 (18.7%) | 61 (81.3%) |
| Retail Trade | 270 (62.1%) | 165 (37.9%) |
| Transportation & Warehousing | 0 (0.0%) | 114 (100.0%) |
| Utilities | 29 (100.0%) | 0 (0.0%) |
| Information | 111 (40.1%) | 166 (59.9%) |
| Finance & Insurance | 0 (0.0%) | 14 (100.0%) |
| Real Estate, Rental & Leasing | 0 (0.0%) | 16 (100.0%) |
| Professional & Scientific | 89 (89.0%) | 11 (11.0%) |
| Enterprise Management | 0 (0.0%) | 0 (0.0%) |
| Administrative & Support | 189 (89.1%) | 23 (10.8%) |
| Educational Services | 32 (19.3%) | 134 (80.7%) |
| Health Care & Social Assistance | 98 (40.2%) | 146 (59.8%) |
| Arts, Entertainment & Recreation | 0 (0.0%) | 7 (100.0%) |
| Accommodation & Food Services | 62 (42.8%) | 83 (57.2%) |
| Public Administration | 47 (48.4%) | 50 (51.5%) |
| Total | 1,459 (56.5%) | 1,124 (43.5%) |
Education in Newport
School Enrollment in Newport
The most common levels of schooling among the 619 students in Newport are high school (178 | 28.8%), elementary school (154 | 24.9%), and college / undergraduate (102 | 16.5%).
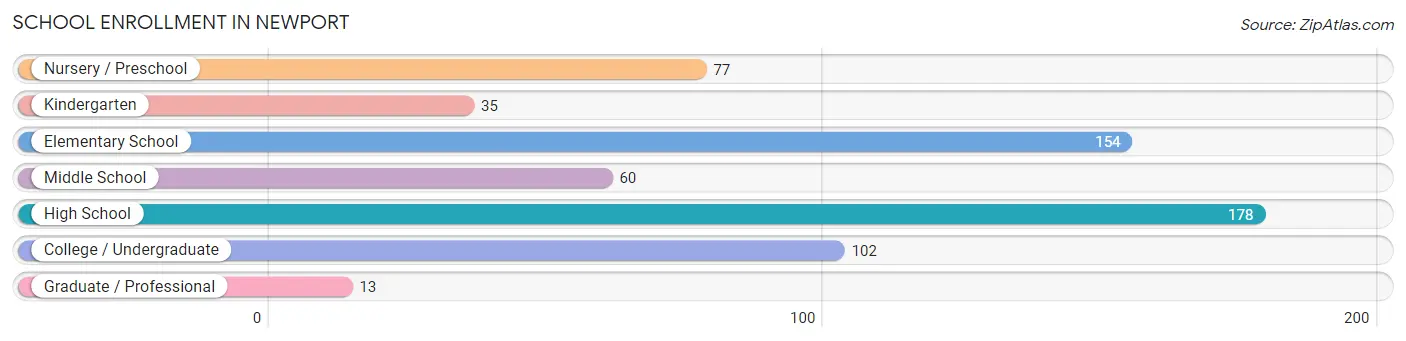
| School Level | # Students | % Students |
| Nursery / Preschool | 77 | 12.4% |
| Kindergarten | 35 | 5.7% |
| Elementary School | 154 | 24.9% |
| Middle School | 60 | 9.7% |
| High School | 178 | 28.8% |
| College / Undergraduate | 102 | 16.5% |
| Graduate / Professional | 13 | 2.1% |
| Total | 619 | 100.0% |
School Enrollment by Age by Funding Source in Newport
Out of a total of 619 students who are enrolled in schools in Newport, 64 (10.3%) attend a private institution, while the remaining 555 (89.7%) are enrolled in public schools. The age group of 25 to 34 year olds has the highest likelihood of being enrolled in private schools, with 13 (72.2% in the age bracket) enrolled. Conversely, the age group of 15 to 17 year olds has the lowest likelihood of being enrolled in a private school, with 151 (100.0% in the age bracket) attending a public institution.
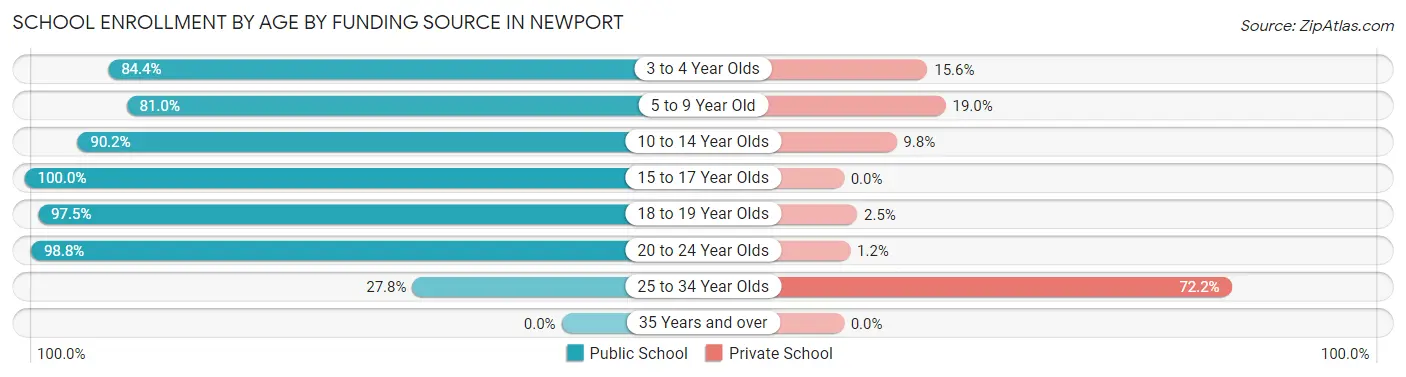
| Age Bracket | Public School | Private School |
| 3 to 4 Year Olds | 65 (84.4%) | 12 (15.6%) |
| 5 to 9 Year Old | 111 (81.0%) | 26 (19.0%) |
| 10 to 14 Year Olds | 101 (90.2%) | 11 (9.8%) |
| 15 to 17 Year Olds | 151 (100.0%) | 0 (0.0%) |
| 18 to 19 Year Olds | 39 (97.5%) | 1 (2.5%) |
| 20 to 24 Year Olds | 83 (98.8%) | 1 (1.2%) |
| 25 to 34 Year Olds | 5 (27.8%) | 13 (72.2%) |
| 35 Years and over | 0 (0.0%) | 0 (0.0%) |
| Total | 555 (89.7%) | 64 (10.3%) |
Educational Attainment by Field of Study in Newport
Business (238 | 23.9%), computers & mathematics (153 | 15.4%), physical & health sciences (119 | 11.9%), psychology (105 | 10.5%), and education (105 | 10.5%) are the most common fields of study among 996 individuals in Newport who have obtained a bachelor's degree or higher.
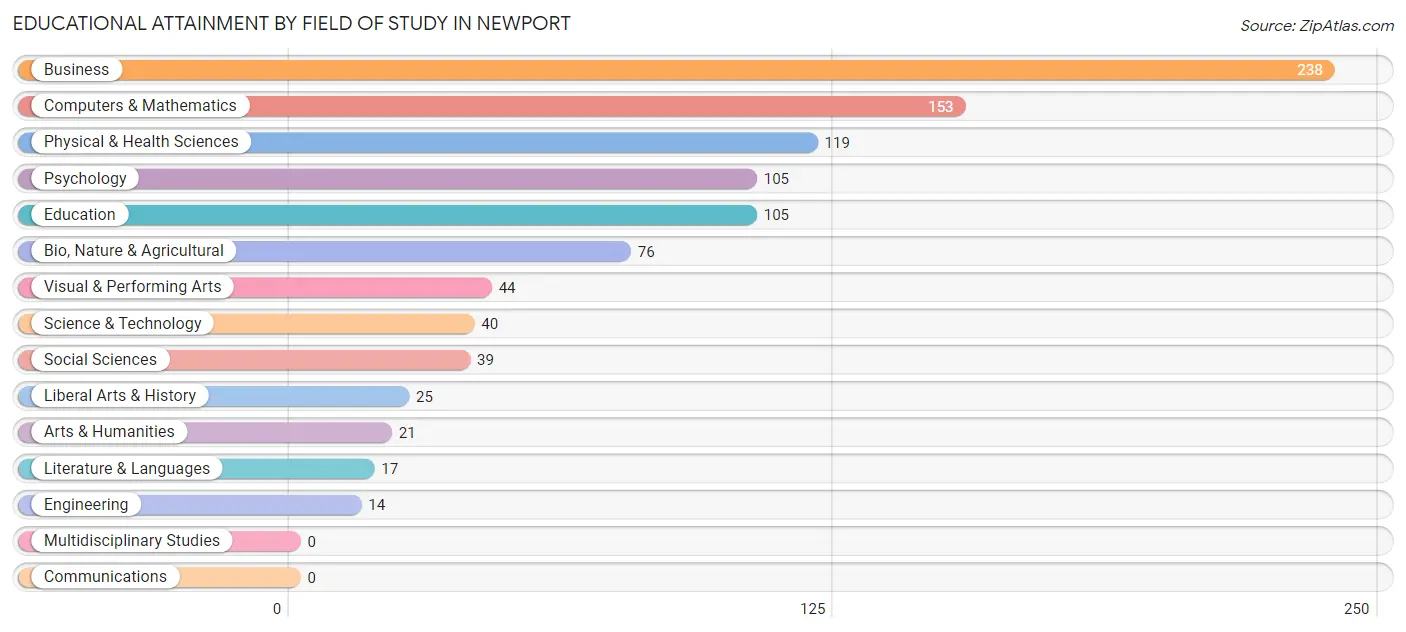
| Field of Study | # Graduates | % Graduates |
| Computers & Mathematics | 153 | 15.4% |
| Bio, Nature & Agricultural | 76 | 7.6% |
| Physical & Health Sciences | 119 | 11.9% |
| Psychology | 105 | 10.5% |
| Social Sciences | 39 | 3.9% |
| Engineering | 14 | 1.4% |
| Multidisciplinary Studies | 0 | 0.0% |
| Science & Technology | 40 | 4.0% |
| Business | 238 | 23.9% |
| Education | 105 | 10.5% |
| Literature & Languages | 17 | 1.7% |
| Liberal Arts & History | 25 | 2.5% |
| Visual & Performing Arts | 44 | 4.4% |
| Communications | 0 | 0.0% |
| Arts & Humanities | 21 | 2.1% |
| Total | 996 | 100.0% |
Transportation & Commute in Newport
Vehicle Availability by Sex in Newport
The most prevalent vehicle ownership categories in Newport are males with 2 vehicles (639, accounting for 42.9%) and females with 2 vehicles (575, making up 57.4%).
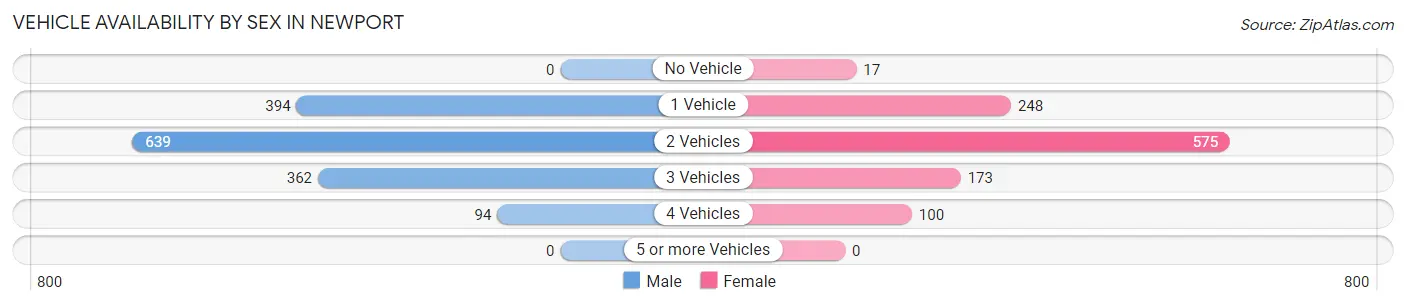
| Vehicles Available | Male | Female |
| No Vehicle | 0 (0.0%) | 17 (1.5%) |
| 1 Vehicle | 394 (26.5%) | 248 (22.3%) |
| 2 Vehicles | 639 (42.9%) | 575 (51.7%) |
| 3 Vehicles | 362 (24.3%) | 173 (15.5%) |
| 4 Vehicles | 94 (6.3%) | 100 (9.0%) |
| 5 or more Vehicles | 0 (0.0%) | 0 (0.0%) |
| Total | 1,489 (100.0%) | 1,113 (100.0%) |
Commute Time in Newport
The most frequently occuring commute durations in Newport are 5 to 9 minutes (649 commuters, 26.7%), 30 to 34 minutes (386 commuters, 15.9%), and 10 to 14 minutes (290 commuters, 11.9%).
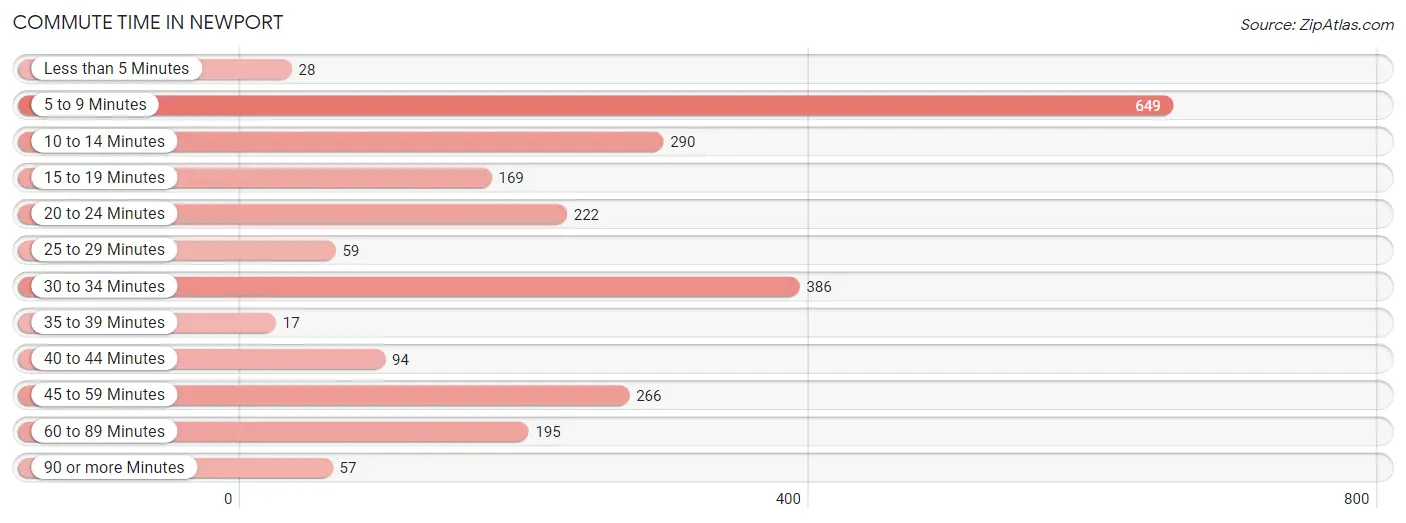
| Commute Time | # Commuters | % Commuters |
| Less than 5 Minutes | 28 | 1.1% |
| 5 to 9 Minutes | 649 | 26.7% |
| 10 to 14 Minutes | 290 | 11.9% |
| 15 to 19 Minutes | 169 | 7.0% |
| 20 to 24 Minutes | 222 | 9.1% |
| 25 to 29 Minutes | 59 | 2.4% |
| 30 to 34 Minutes | 386 | 15.9% |
| 35 to 39 Minutes | 17 | 0.7% |
| 40 to 44 Minutes | 94 | 3.9% |
| 45 to 59 Minutes | 266 | 10.9% |
| 60 to 89 Minutes | 195 | 8.0% |
| 90 or more Minutes | 57 | 2.3% |
Commute Time by Sex in Newport
The most common commute times in Newport are 5 to 9 minutes (549 commuters, 39.9%) for males and 20 to 24 minutes (201 commuters, 19.0%) for females.
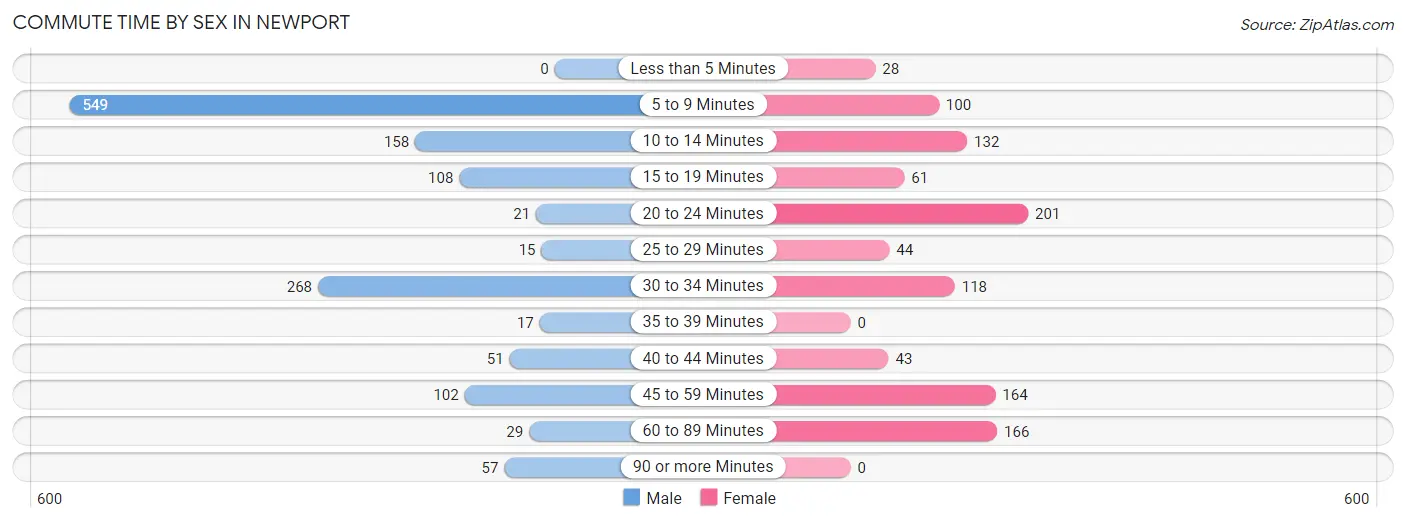
| Commute Time | Male | Female |
| Less than 5 Minutes | 0 (0.0%) | 28 (2.6%) |
| 5 to 9 Minutes | 549 (39.9%) | 100 (9.5%) |
| 10 to 14 Minutes | 158 (11.5%) | 132 (12.5%) |
| 15 to 19 Minutes | 108 (7.9%) | 61 (5.8%) |
| 20 to 24 Minutes | 21 (1.5%) | 201 (19.0%) |
| 25 to 29 Minutes | 15 (1.1%) | 44 (4.2%) |
| 30 to 34 Minutes | 268 (19.5%) | 118 (11.2%) |
| 35 to 39 Minutes | 17 (1.2%) | 0 (0.0%) |
| 40 to 44 Minutes | 51 (3.7%) | 43 (4.1%) |
| 45 to 59 Minutes | 102 (7.4%) | 164 (15.5%) |
| 60 to 89 Minutes | 29 (2.1%) | 166 (15.7%) |
| 90 or more Minutes | 57 (4.2%) | 0 (0.0%) |
Time of Departure to Work by Sex in Newport
The most frequent times of departure to work in Newport are 6:30 AM to 6:59 AM (445, 32.4%) for males and 7:00 AM to 7:29 AM (220, 20.8%) for females.
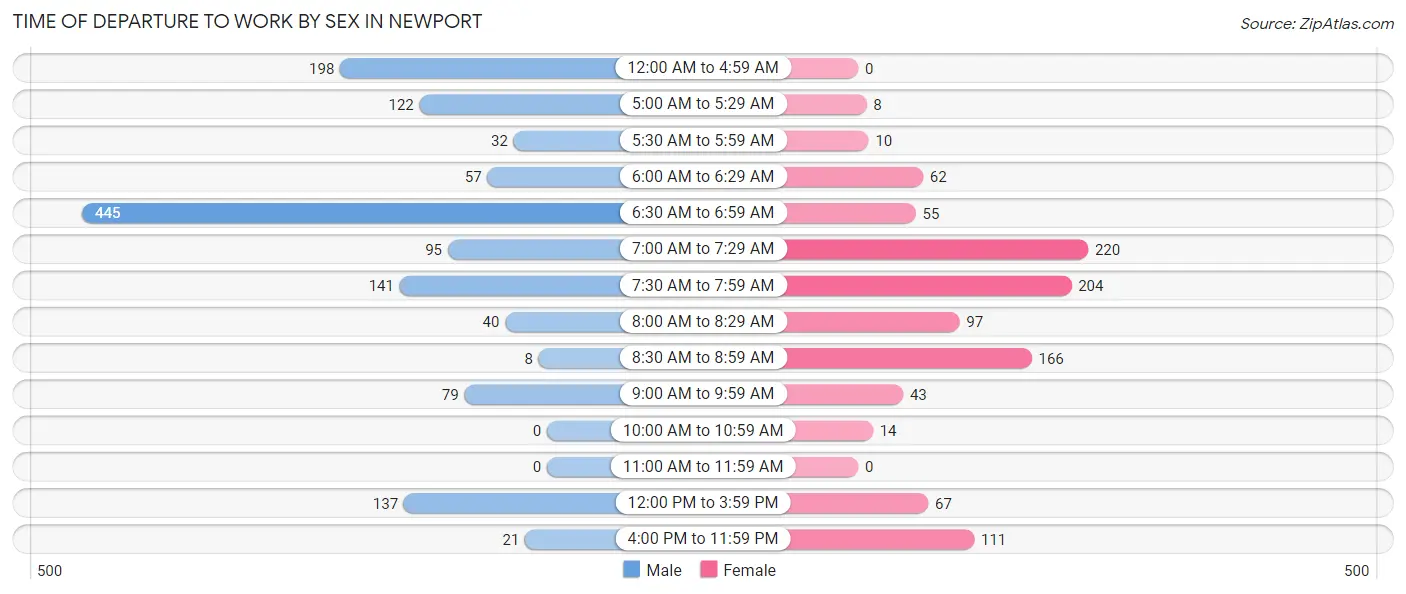
| Time of Departure | Male | Female |
| 12:00 AM to 4:59 AM | 198 (14.4%) | 0 (0.0%) |
| 5:00 AM to 5:29 AM | 122 (8.9%) | 8 (0.8%) |
| 5:30 AM to 5:59 AM | 32 (2.3%) | 10 (0.9%) |
| 6:00 AM to 6:29 AM | 57 (4.2%) | 62 (5.9%) |
| 6:30 AM to 6:59 AM | 445 (32.4%) | 55 (5.2%) |
| 7:00 AM to 7:29 AM | 95 (6.9%) | 220 (20.8%) |
| 7:30 AM to 7:59 AM | 141 (10.2%) | 204 (19.3%) |
| 8:00 AM to 8:29 AM | 40 (2.9%) | 97 (9.2%) |
| 8:30 AM to 8:59 AM | 8 (0.6%) | 166 (15.7%) |
| 9:00 AM to 9:59 AM | 79 (5.8%) | 43 (4.1%) |
| 10:00 AM to 10:59 AM | 0 (0.0%) | 14 (1.3%) |
| 11:00 AM to 11:59 AM | 0 (0.0%) | 0 (0.0%) |
| 12:00 PM to 3:59 PM | 137 (10.0%) | 67 (6.3%) |
| 4:00 PM to 11:59 PM | 21 (1.5%) | 111 (10.5%) |
| Total | 1,375 (100.0%) | 1,057 (100.0%) |
Housing Occupancy in Newport
Occupancy by Ownership in Newport
Of the total 1,936 dwellings in Newport, owner-occupied units account for 1,105 (57.1%), while renter-occupied units make up 831 (42.9%).
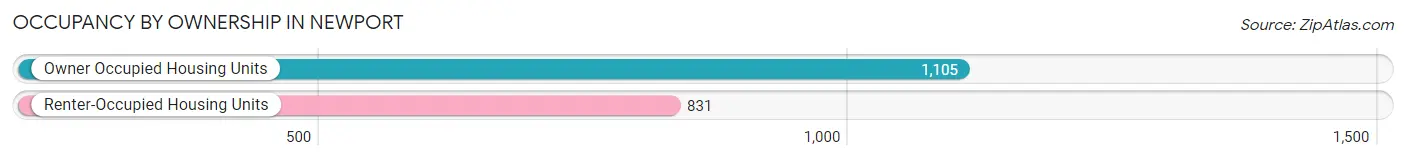
| Occupancy | # Housing Units | % Housing Units |
| Owner Occupied Housing Units | 1,105 | 57.1% |
| Renter-Occupied Housing Units | 831 | 42.9% |
| Total Occupied Housing Units | 1,936 | 100.0% |
Occupancy by Household Size in Newport
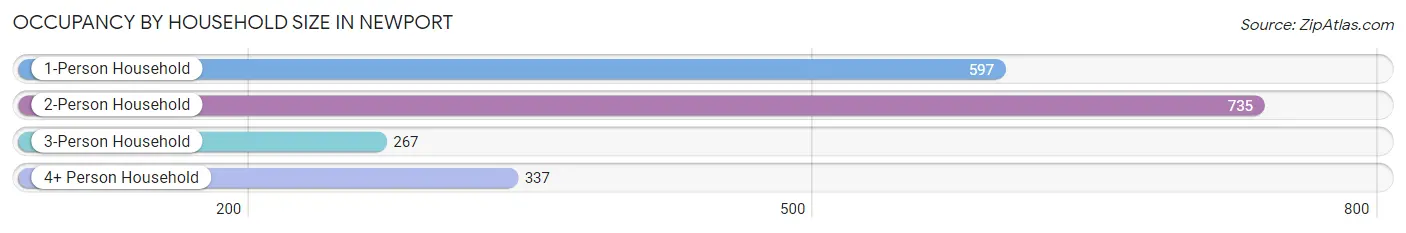
| Household Size | # Housing Units | % Housing Units |
| 1-Person Household | 597 | 30.8% |
| 2-Person Household | 735 | 38.0% |
| 3-Person Household | 267 | 13.8% |
| 4+ Person Household | 337 | 17.4% |
| Total Housing Units | 1,936 | 100.0% |
Occupancy by Ownership by Household Size in Newport
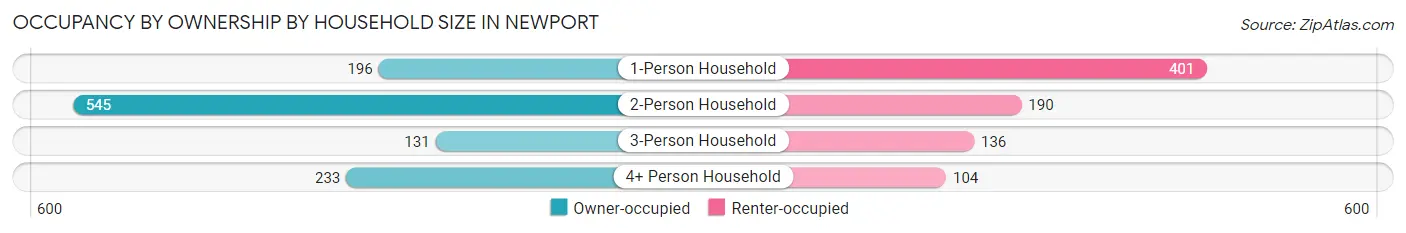
| Household Size | Owner-occupied | Renter-occupied |
| 1-Person Household | 196 (32.8%) | 401 (67.2%) |
| 2-Person Household | 545 (74.2%) | 190 (25.9%) |
| 3-Person Household | 131 (49.1%) | 136 (50.9%) |
| 4+ Person Household | 233 (69.1%) | 104 (30.9%) |
| Total Housing Units | 1,105 (57.1%) | 831 (42.9%) |
Occupancy by Educational Attainment in Newport
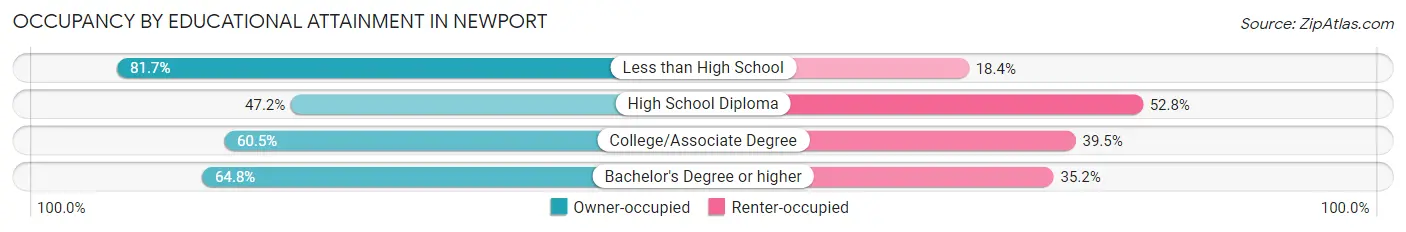
| Household Size | Owner-occupied | Renter-occupied |
| Less than High School | 89 (81.7%) | 20 (18.3%) |
| High School Diploma | 390 (47.2%) | 437 (52.8%) |
| College/Associate Degree | 309 (60.5%) | 202 (39.5%) |
| Bachelor's Degree or higher | 317 (64.8%) | 172 (35.2%) |
Occupancy by Age of Householder in Newport
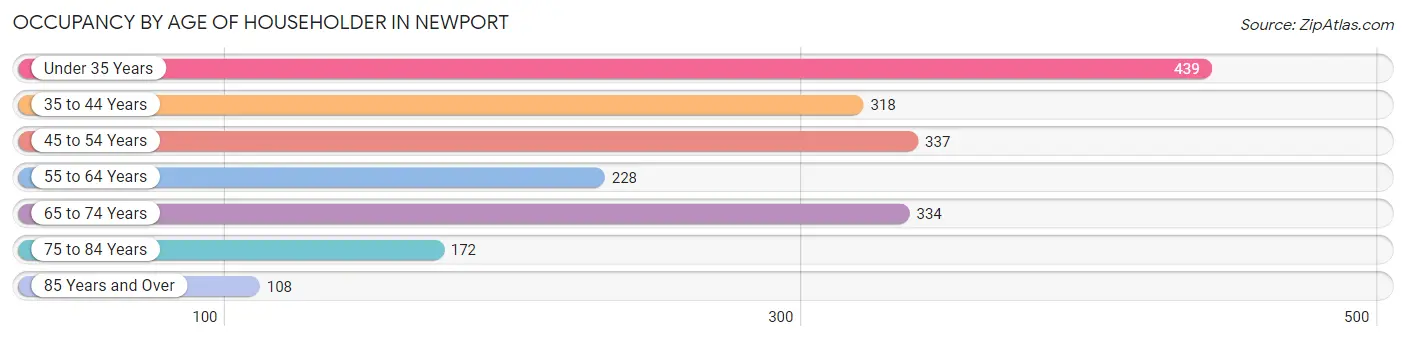
| Age Bracket | # Households | % Households |
| Under 35 Years | 439 | 22.7% |
| 35 to 44 Years | 318 | 16.4% |
| 45 to 54 Years | 337 | 17.4% |
| 55 to 64 Years | 228 | 11.8% |
| 65 to 74 Years | 334 | 17.2% |
| 75 to 84 Years | 172 | 8.9% |
| 85 Years and Over | 108 | 5.6% |
| Total | 1,936 | 100.0% |
Housing Finances in Newport
Median Income by Occupancy in Newport
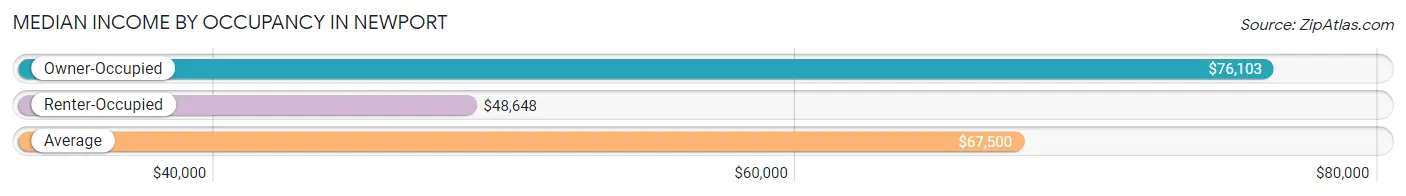
| Occupancy Type | # Households | Median Income |
| Owner-Occupied | 1,105 (57.1%) | $76,103 |
| Renter-Occupied | 831 (42.9%) | $48,648 |
| Average | 1,936 (100.0%) | $67,500 |
Occupancy by Householder Income Bracket in Newport
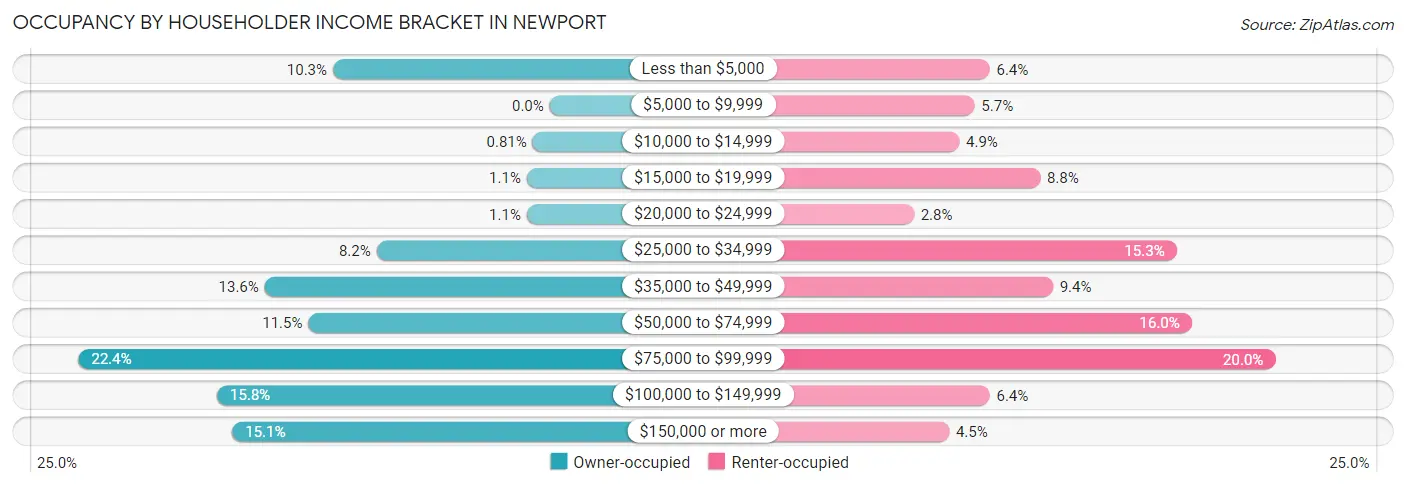
| Income Bracket | Owner-occupied | Renter-occupied |
| Less than $5,000 | 114 (10.3%) | 53 (6.4%) |
| $5,000 to $9,999 | 0 (0.0%) | 47 (5.7%) |
| $10,000 to $14,999 | 9 (0.8%) | 41 (4.9%) |
| $15,000 to $19,999 | 12 (1.1%) | 73 (8.8%) |
| $20,000 to $24,999 | 12 (1.1%) | 23 (2.8%) |
| $25,000 to $34,999 | 91 (8.2%) | 127 (15.3%) |
| $35,000 to $49,999 | 150 (13.6%) | 78 (9.4%) |
| $50,000 to $74,999 | 127 (11.5%) | 133 (16.0%) |
| $75,000 to $99,999 | 248 (22.4%) | 166 (20.0%) |
| $100,000 to $149,999 | 175 (15.8%) | 53 (6.4%) |
| $150,000 or more | 167 (15.1%) | 37 (4.4%) |
| Total | 1,105 (100.0%) | 831 (100.0%) |
Monthly Housing Cost Tiers in Newport
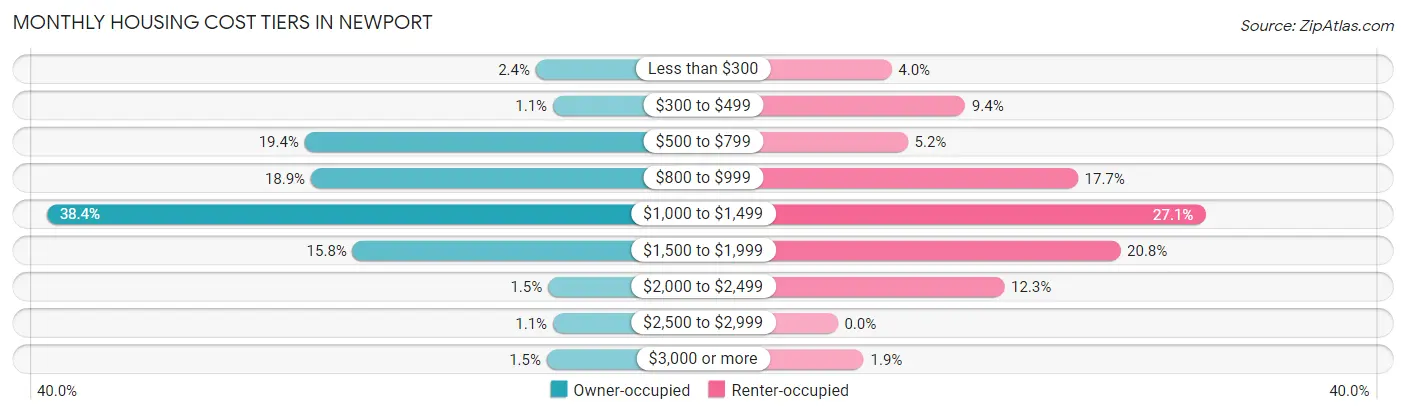
| Monthly Cost | Owner-occupied | Renter-occupied |
| Less than $300 | 26 (2.4%) | 33 (4.0%) |
| $300 to $499 | 12 (1.1%) | 78 (9.4%) |
| $500 to $799 | 214 (19.4%) | 43 (5.2%) |
| $800 to $999 | 209 (18.9%) | 147 (17.7%) |
| $1,000 to $1,499 | 424 (38.4%) | 225 (27.1%) |
| $1,500 to $1,999 | 175 (15.8%) | 173 (20.8%) |
| $2,000 to $2,499 | 16 (1.5%) | 102 (12.3%) |
| $2,500 to $2,999 | 12 (1.1%) | 0 (0.0%) |
| $3,000 or more | 17 (1.5%) | 16 (1.9%) |
| Total | 1,105 (100.0%) | 831 (100.0%) |
Physical Housing Characteristics in Newport
Housing Structures in Newport
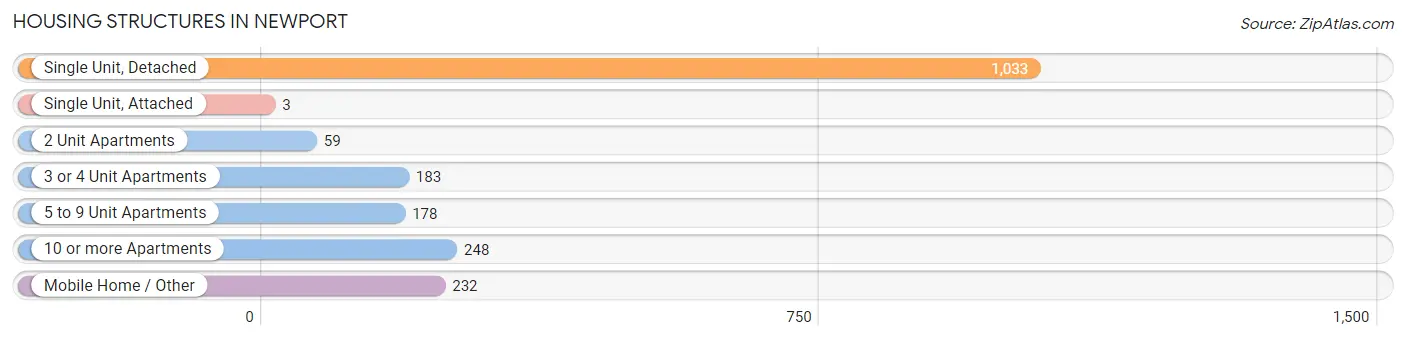
| Structure Type | # Housing Units | % Housing Units |
| Single Unit, Detached | 1,033 | 53.4% |
| Single Unit, Attached | 3 | 0.2% |
| 2 Unit Apartments | 59 | 3.0% |
| 3 or 4 Unit Apartments | 183 | 9.5% |
| 5 to 9 Unit Apartments | 178 | 9.2% |
| 10 or more Apartments | 248 | 12.8% |
| Mobile Home / Other | 232 | 12.0% |
| Total | 1,936 | 100.0% |
Housing Structures by Occupancy in Newport
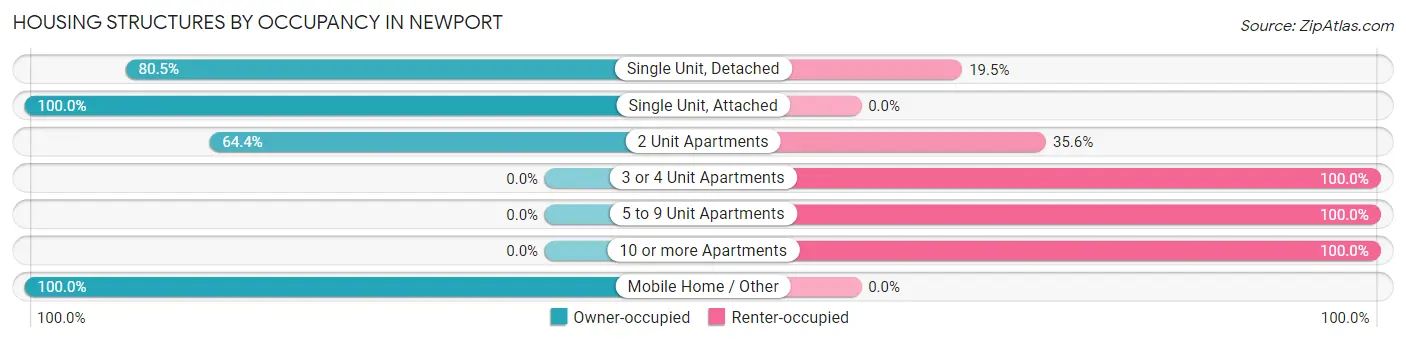
| Structure Type | Owner-occupied | Renter-occupied |
| Single Unit, Detached | 832 (80.5%) | 201 (19.5%) |
| Single Unit, Attached | 3 (100.0%) | 0 (0.0%) |
| 2 Unit Apartments | 38 (64.4%) | 21 (35.6%) |
| 3 or 4 Unit Apartments | 0 (0.0%) | 183 (100.0%) |
| 5 to 9 Unit Apartments | 0 (0.0%) | 178 (100.0%) |
| 10 or more Apartments | 0 (0.0%) | 248 (100.0%) |
| Mobile Home / Other | 232 (100.0%) | 0 (0.0%) |
| Total | 1,105 (57.1%) | 831 (42.9%) |
Housing Structures by Number of Rooms in Newport
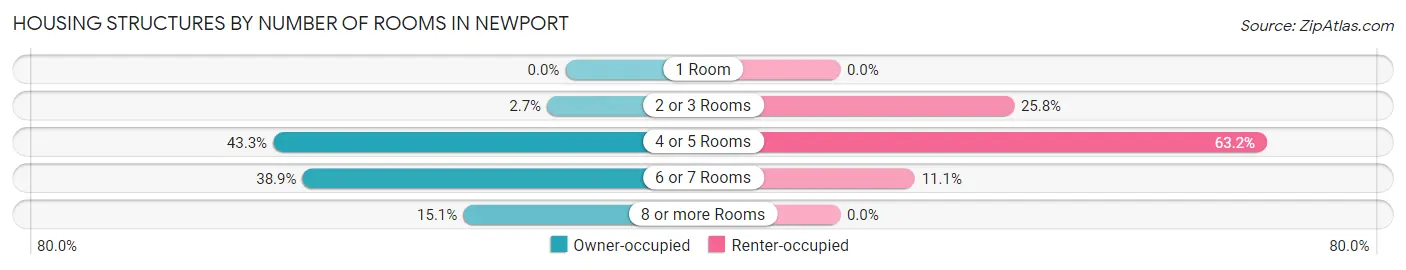
| Number of Rooms | Owner-occupied | Renter-occupied |
| 1 Room | 0 (0.0%) | 0 (0.0%) |
| 2 or 3 Rooms | 30 (2.7%) | 214 (25.8%) |
| 4 or 5 Rooms | 478 (43.3%) | 525 (63.2%) |
| 6 or 7 Rooms | 430 (38.9%) | 92 (11.1%) |
| 8 or more Rooms | 167 (15.1%) | 0 (0.0%) |
| Total | 1,105 (100.0%) | 831 (100.0%) |
Housing Structure by Heating Type in Newport
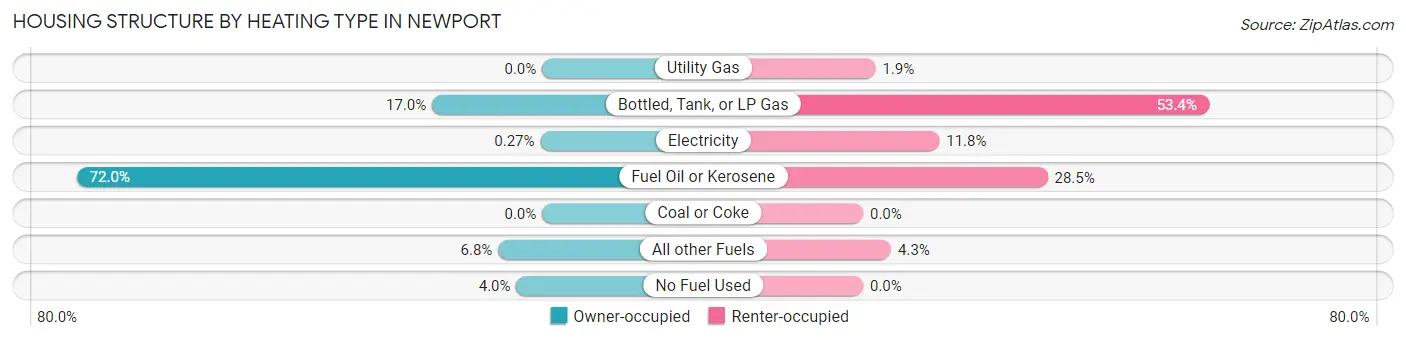
| Heating Type | Owner-occupied | Renter-occupied |
| Utility Gas | 0 (0.0%) | 16 (1.9%) |
| Bottled, Tank, or LP Gas | 188 (17.0%) | 444 (53.4%) |
| Electricity | 3 (0.3%) | 98 (11.8%) |
| Fuel Oil or Kerosene | 795 (72.0%) | 237 (28.5%) |
| Coal or Coke | 0 (0.0%) | 0 (0.0%) |
| All other Fuels | 75 (6.8%) | 36 (4.3%) |
| No Fuel Used | 44 (4.0%) | 0 (0.0%) |
| Total | 1,105 (100.0%) | 831 (100.0%) |
Household Vehicle Usage in Newport
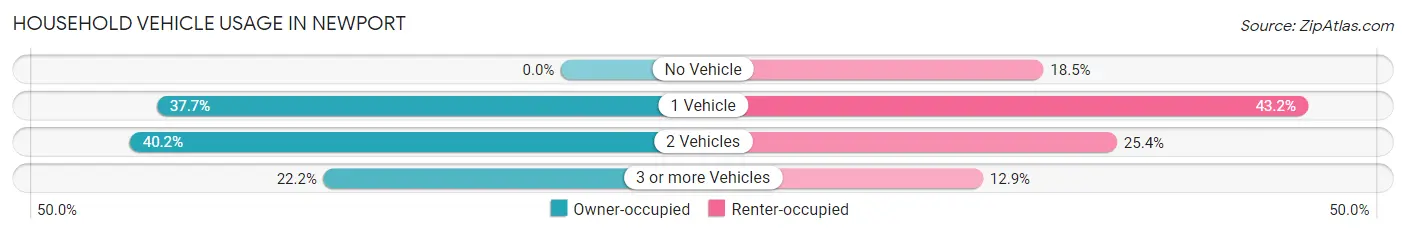
| Vehicles per Household | Owner-occupied | Renter-occupied |
| No Vehicle | 0 (0.0%) | 154 (18.5%) |
| 1 Vehicle | 416 (37.7%) | 359 (43.2%) |
| 2 Vehicles | 444 (40.2%) | 211 (25.4%) |
| 3 or more Vehicles | 245 (22.2%) | 107 (12.9%) |
| Total | 1,105 (100.0%) | 831 (100.0%) |
Real Estate & Mortgages in Newport
Real Estate and Mortgage Overview in Newport
| Characteristic | Without Mortgage | With Mortgage |
| Housing Units | 440 | 665 |
| Median Property Value | $164,900 | $161,400 |
| Median Household Income | $61,071 | $106 |
| Monthly Housing Costs | $787 | $17 |
| Real Estate Taxes | $4,881 | $58 |
Property Value by Mortgage Status in Newport
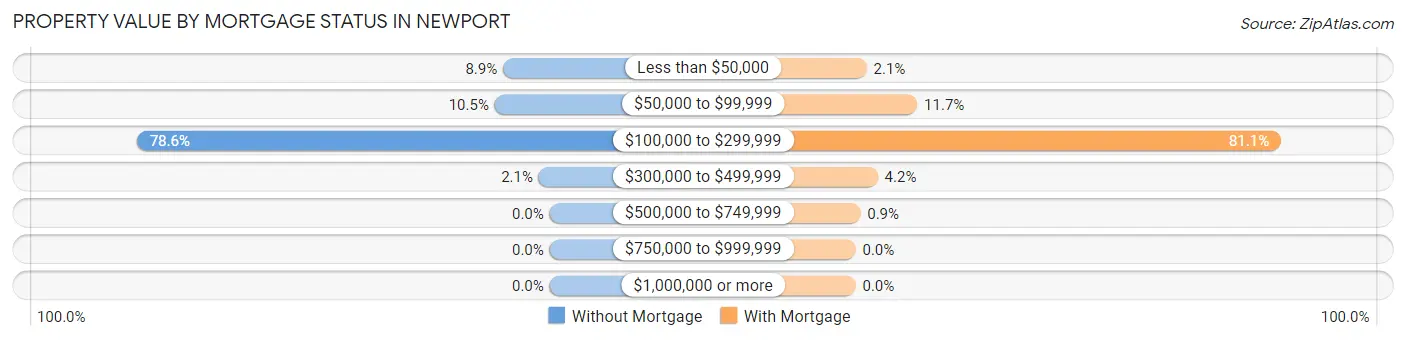
| Property Value | Without Mortgage | With Mortgage |
| Less than $50,000 | 39 (8.9%) | 14 (2.1%) |
| $50,000 to $99,999 | 46 (10.4%) | 78 (11.7%) |
| $100,000 to $299,999 | 346 (78.6%) | 539 (81.0%) |
| $300,000 to $499,999 | 9 (2.1%) | 28 (4.2%) |
| $500,000 to $749,999 | 0 (0.0%) | 6 (0.9%) |
| $750,000 to $999,999 | 0 (0.0%) | 0 (0.0%) |
| $1,000,000 or more | 0 (0.0%) | 0 (0.0%) |
| Total | 440 (100.0%) | 665 (100.0%) |
Household Income by Mortgage Status in Newport
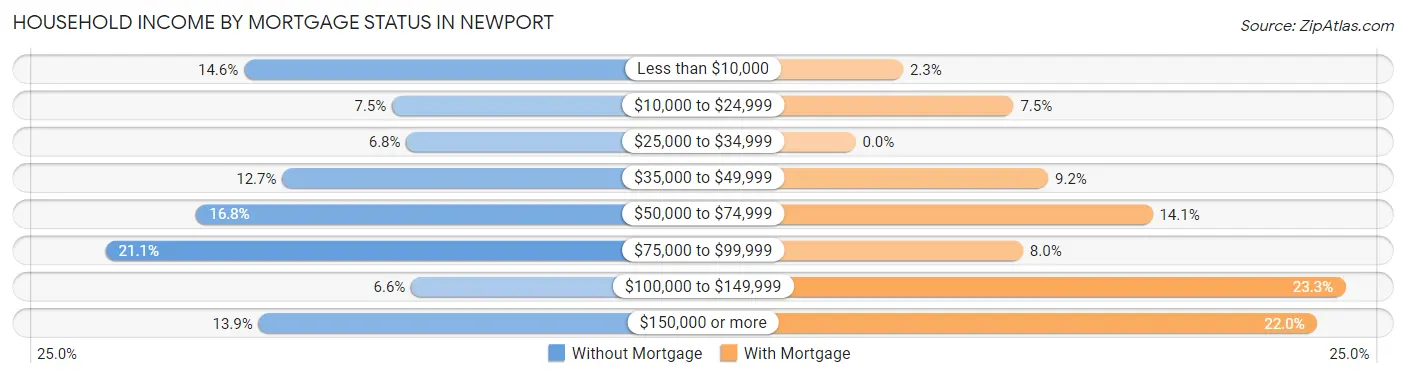
| Household Income | Without Mortgage | With Mortgage |
| Less than $10,000 | 64 (14.5%) | 15 (2.3%) |
| $10,000 to $24,999 | 33 (7.5%) | 50 (7.5%) |
| $25,000 to $34,999 | 30 (6.8%) | 0 (0.0%) |
| $35,000 to $49,999 | 56 (12.7%) | 61 (9.2%) |
| $50,000 to $74,999 | 74 (16.8%) | 94 (14.1%) |
| $75,000 to $99,999 | 93 (21.1%) | 53 (8.0%) |
| $100,000 to $149,999 | 29 (6.6%) | 155 (23.3%) |
| $150,000 or more | 61 (13.9%) | 146 (22.0%) |
| Total | 440 (100.0%) | 665 (100.0%) |
Property Value to Household Income Ratio in Newport
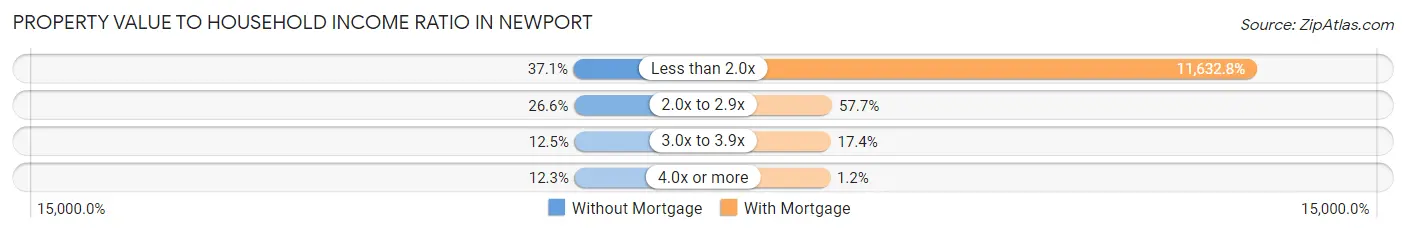
| Value-to-Income Ratio | Without Mortgage | With Mortgage |
| Less than 2.0x | 163 (37.0%) | 77,358 (11,632.8%) |
| 2.0x to 2.9x | 117 (26.6%) | 384 (57.7%) |
| 3.0x to 3.9x | 55 (12.5%) | 116 (17.4%) |
| 4.0x or more | 54 (12.3%) | 8 (1.2%) |
| Total | 440 (100.0%) | 665 (100.0%) |
Real Estate Taxes by Mortgage Status in Newport
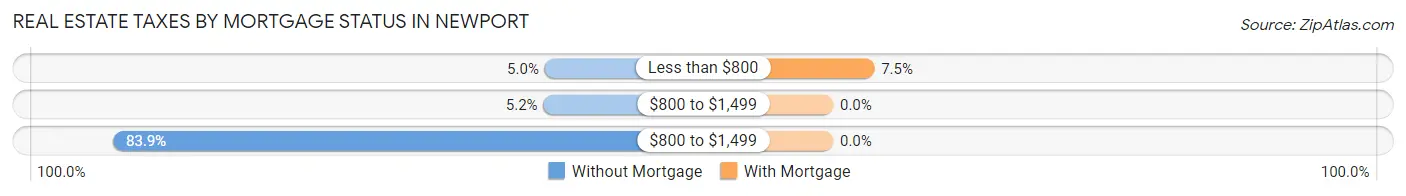
| Property Taxes | Without Mortgage | With Mortgage |
| Less than $800 | 22 (5.0%) | 50 (7.5%) |
| $800 to $1,499 | 23 (5.2%) | 0 (0.0%) |
| $800 to $1,499 | 369 (83.9%) | 0 (0.0%) |
| Total | 440 (100.0%) | 665 (100.0%) |
Health & Disability in Newport
Health Insurance Coverage by Age in Newport
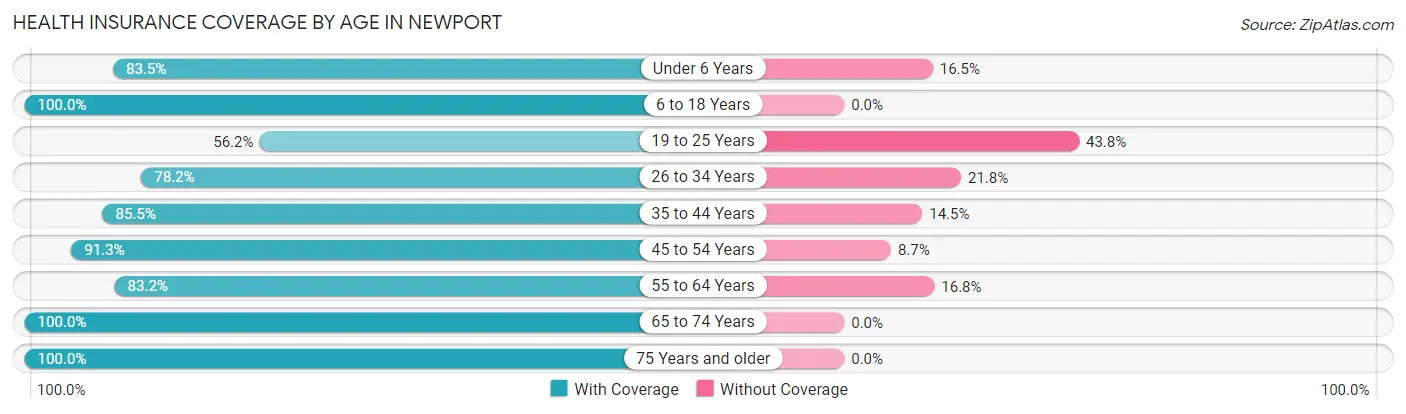
| Age Bracket | With Coverage | Without Coverage |
| Under 6 Years | 182 (83.5%) | 36 (16.5%) |
| 6 to 18 Years | 443 (100.0%) | 0 (0.0%) |
| 19 to 25 Years | 429 (56.2%) | 334 (43.8%) |
| 26 to 34 Years | 607 (78.2%) | 169 (21.8%) |
| 35 to 44 Years | 388 (85.5%) | 66 (14.5%) |
| 45 to 54 Years | 629 (91.3%) | 60 (8.7%) |
| 55 to 64 Years | 728 (83.2%) | 147 (16.8%) |
| 65 to 74 Years | 447 (100.0%) | 0 (0.0%) |
| 75 Years and older | 418 (100.0%) | 0 (0.0%) |
| Total | 4,271 (84.0%) | 812 (16.0%) |
Health Insurance Coverage by Citizenship Status in Newport
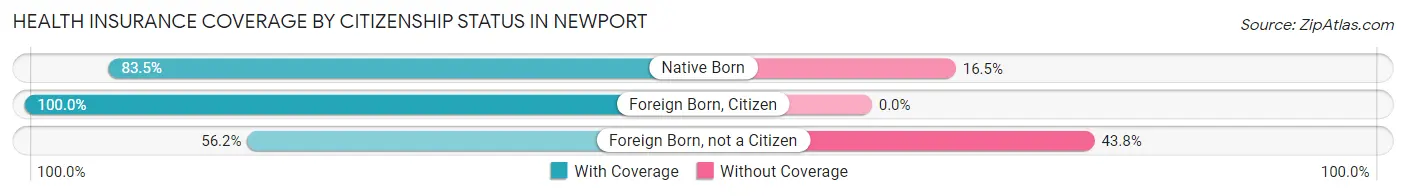
| Citizenship Status | With Coverage | Without Coverage |
| Native Born | 182 (83.5%) | 36 (16.5%) |
| Foreign Born, Citizen | 443 (100.0%) | 0 (0.0%) |
| Foreign Born, not a Citizen | 429 (56.2%) | 334 (43.8%) |
Health Insurance Coverage by Household Income in Newport
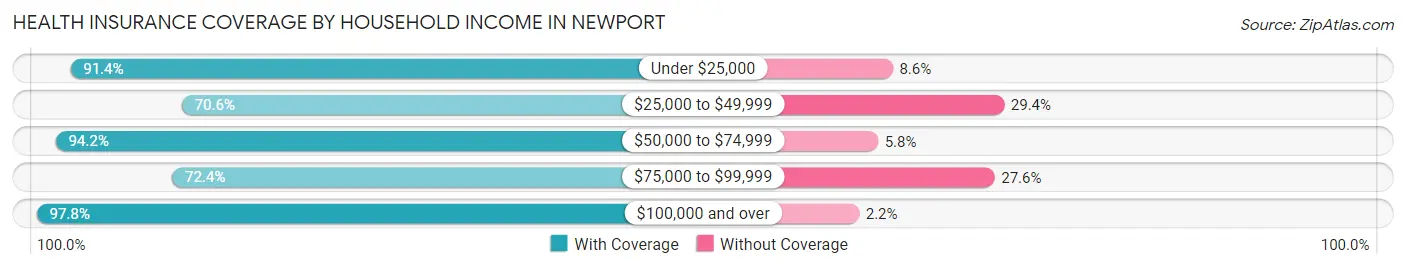
| Household Income | With Coverage | Without Coverage |
| Under $25,000 | 438 (91.4%) | 41 (8.6%) |
| $25,000 to $49,999 | 856 (70.6%) | 357 (29.4%) |
| $50,000 to $74,999 | 846 (94.2%) | 52 (5.8%) |
| $75,000 to $99,999 | 875 (72.4%) | 334 (27.6%) |
| $100,000 and over | 1,221 (97.8%) | 28 (2.2%) |
Public vs Private Health Insurance Coverage by Age in Newport
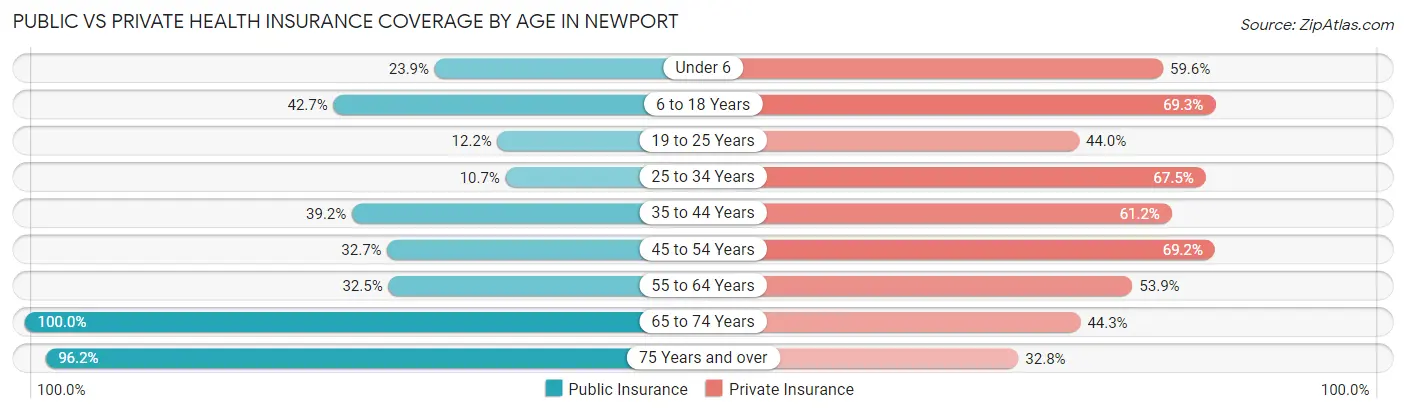
| Age Bracket | Public Insurance | Private Insurance |
| Under 6 | 52 (23.8%) | 130 (59.6%) |
| 6 to 18 Years | 189 (42.7%) | 307 (69.3%) |
| 19 to 25 Years | 93 (12.2%) | 336 (44.0%) |
| 25 to 34 Years | 83 (10.7%) | 524 (67.5%) |
| 35 to 44 Years | 178 (39.2%) | 278 (61.2%) |
| 45 to 54 Years | 225 (32.7%) | 477 (69.2%) |
| 55 to 64 Years | 284 (32.5%) | 472 (53.9%) |
| 65 to 74 Years | 447 (100.0%) | 198 (44.3%) |
| 75 Years and over | 402 (96.2%) | 137 (32.8%) |
| Total | 1,953 (38.4%) | 2,859 (56.2%) |
Disability Status by Sex by Age in Newport
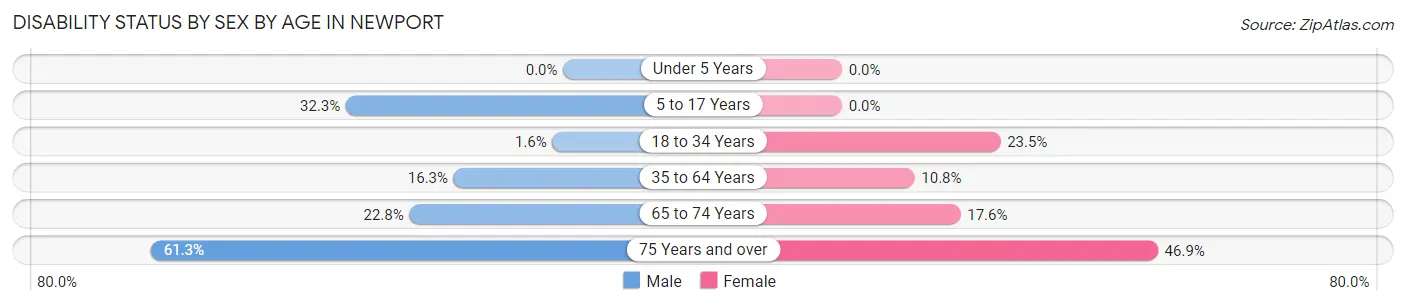
| Age Bracket | Male | Female |
| Under 5 Years | 0 (0.0%) | 0 (0.0%) |
| 5 to 17 Years | 100 (32.3%) | 0 (0.0%) |
| 18 to 34 Years | 18 (1.6%) | 99 (23.5%) |
| 35 to 64 Years | 132 (16.3%) | 130 (10.8%) |
| 65 to 74 Years | 45 (22.8%) | 44 (17.6%) |
| 75 Years and over | 98 (61.3%) | 121 (46.9%) |
Disability Class by Sex by Age in Newport
Disability Class: Hearing Difficulty
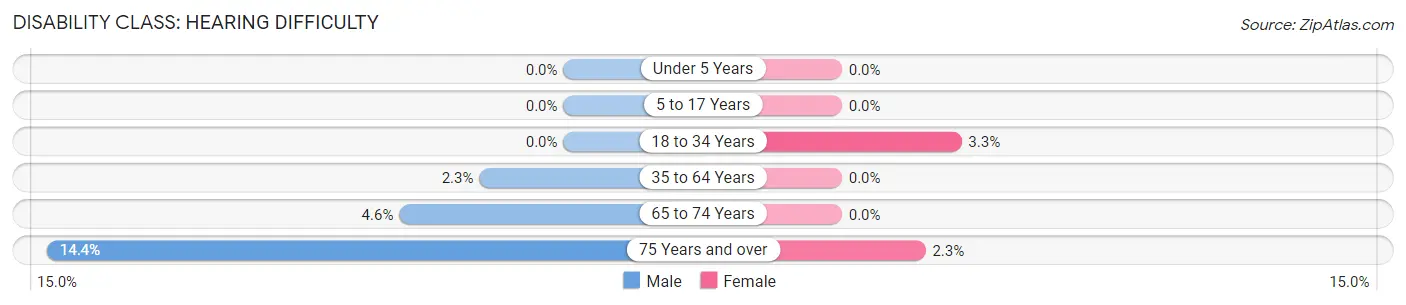
| Age Bracket | Male | Female |
| Under 5 Years | 0 (0.0%) | 0 (0.0%) |
| 5 to 17 Years | 0 (0.0%) | 0 (0.0%) |
| 18 to 34 Years | 0 (0.0%) | 14 (3.3%) |
| 35 to 64 Years | 19 (2.3%) | 0 (0.0%) |
| 65 to 74 Years | 9 (4.6%) | 0 (0.0%) |
| 75 Years and over | 23 (14.4%) | 6 (2.3%) |
Disability Class: Vision Difficulty
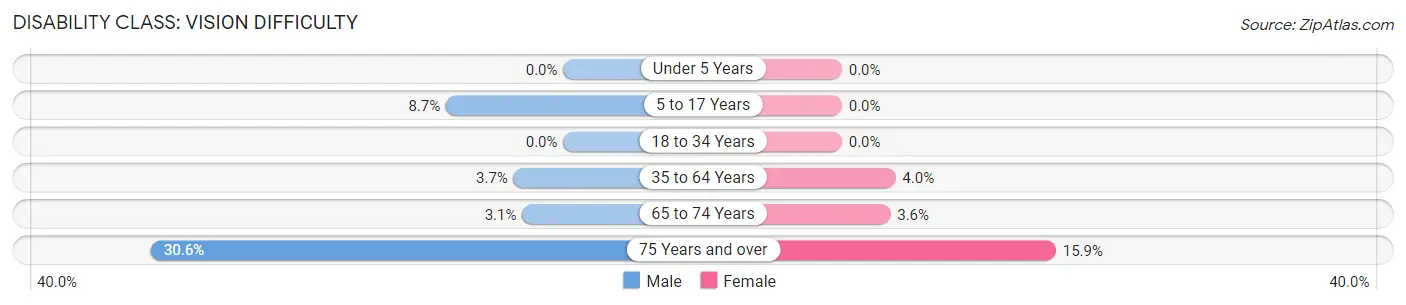
| Age Bracket | Male | Female |
| Under 5 Years | 0 (0.0%) | 0 (0.0%) |
| 5 to 17 Years | 27 (8.7%) | 0 (0.0%) |
| 18 to 34 Years | 0 (0.0%) | 0 (0.0%) |
| 35 to 64 Years | 30 (3.7%) | 48 (4.0%) |
| 65 to 74 Years | 6 (3.0%) | 9 (3.6%) |
| 75 Years and over | 49 (30.6%) | 41 (15.9%) |
Disability Class: Cognitive Difficulty
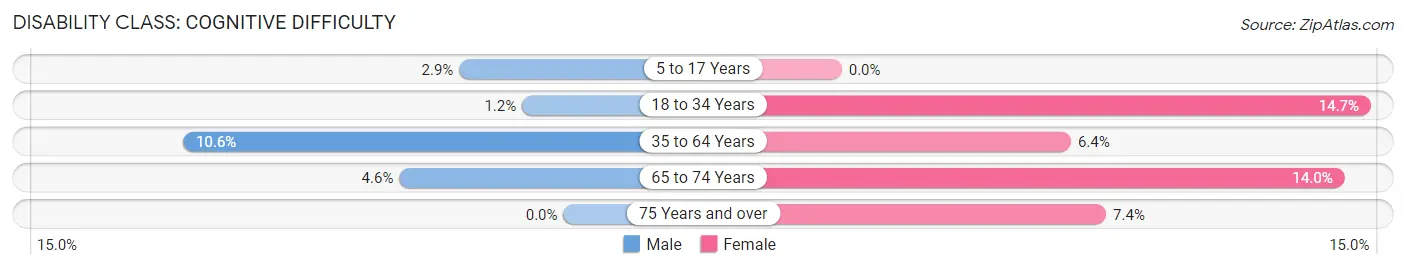
| Age Bracket | Male | Female |
| 5 to 17 Years | 9 (2.9%) | 0 (0.0%) |
| 18 to 34 Years | 13 (1.1%) | 62 (14.7%) |
| 35 to 64 Years | 86 (10.6%) | 77 (6.4%) |
| 65 to 74 Years | 9 (4.6%) | 35 (14.0%) |
| 75 Years and over | 0 (0.0%) | 19 (7.4%) |
Disability Class: Ambulatory Difficulty
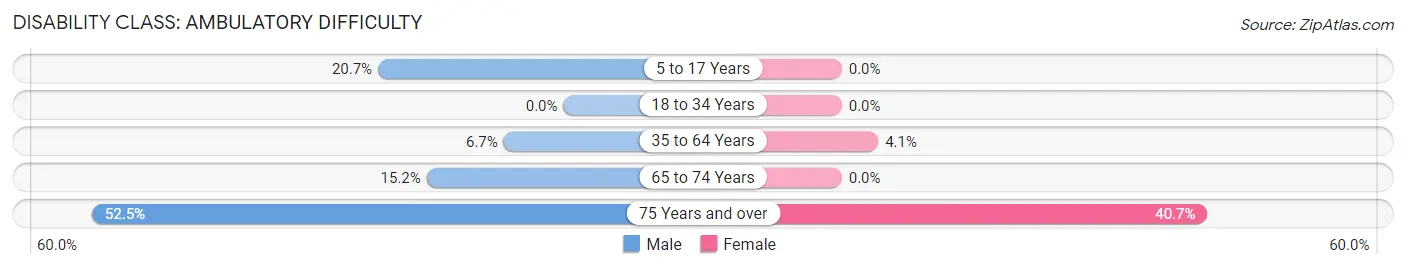
| Age Bracket | Male | Female |
| 5 to 17 Years | 64 (20.6%) | 0 (0.0%) |
| 18 to 34 Years | 0 (0.0%) | 0 (0.0%) |
| 35 to 64 Years | 54 (6.7%) | 49 (4.1%) |
| 65 to 74 Years | 30 (15.2%) | 0 (0.0%) |
| 75 Years and over | 84 (52.5%) | 105 (40.7%) |
Disability Class: Self-Care Difficulty
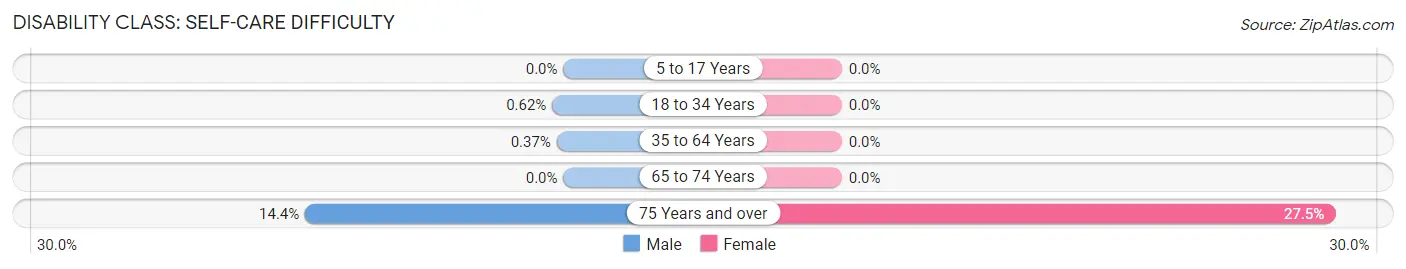
| Age Bracket | Male | Female |
| 5 to 17 Years | 0 (0.0%) | 0 (0.0%) |
| 18 to 34 Years | 7 (0.6%) | 0 (0.0%) |
| 35 to 64 Years | 3 (0.4%) | 0 (0.0%) |
| 65 to 74 Years | 0 (0.0%) | 0 (0.0%) |
| 75 Years and over | 23 (14.4%) | 71 (27.5%) |
Technology Access in Newport
Computing Device Access in Newport
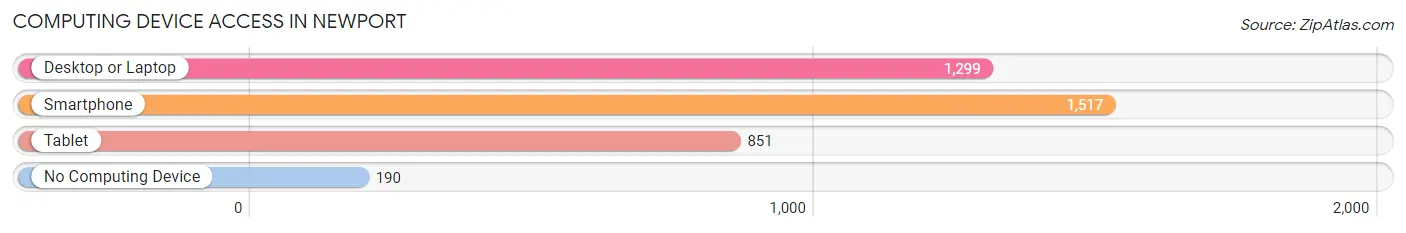
| Device Type | # Households | % Households |
| Desktop or Laptop | 1,299 | 67.1% |
| Smartphone | 1,517 | 78.4% |
| Tablet | 851 | 44.0% |
| No Computing Device | 190 | 9.8% |
| Total | 1,936 | 100.0% |
Internet Access in Newport
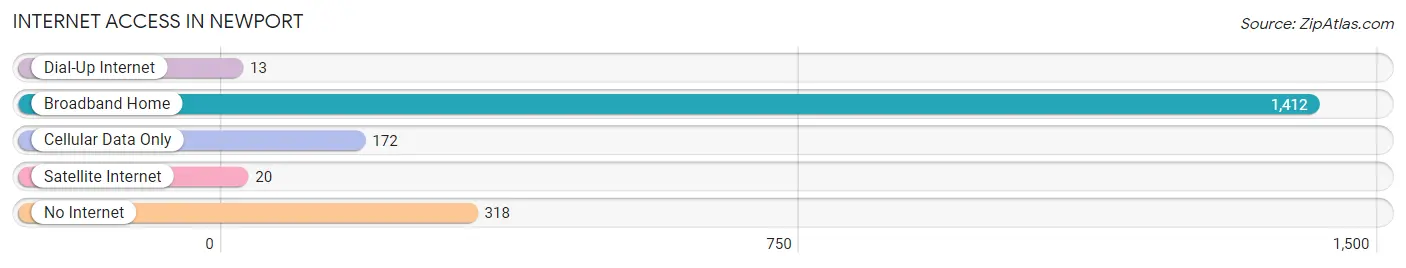
| Internet Type | # Households | % Households |
| Dial-Up Internet | 13 | 0.7% |
| Broadband Home | 1,412 | 72.9% |
| Cellular Data Only | 172 | 8.9% |
| Satellite Internet | 20 | 1.0% |
| No Internet | 318 | 16.4% |
| Total | 1,936 | 100.0% |
Newport Summary
Newport is a town located in Sullivan County, New Hampshire, United States. The population was 6,507 at the 2010 census. It is the county seat of Sullivan County.
Geography
Newport is located in the western part of Sullivan County, bordered to the north by the town of Lempster, to the east by the town of Sunapee, to the south by the town of Croydon, and to the west by the town of Unity. The town is situated in the Connecticut River Valley, with the Connecticut River forming the western boundary of the town. The highest point in town is the summit of Mount Sunapee, at 2,726 feet (831 m) above sea level.
The town is served by Interstate 89, which runs through the town from north to south, and U.S. Route 4, which runs east-west through the town.
History
The area that is now Newport was first settled in 1763 by settlers from Massachusetts. The town was incorporated in 1768, and was named after Newport, Rhode Island.
In the 19th century, Newport was an important center for the lumber industry, with several sawmills located in the town. The town was also home to several gristmills, tanneries, and a woolen mill.
In the late 19th century, Newport was a popular summer resort destination, with several large hotels located in the town. The town was also home to several large dairy farms.
Economy
Today, Newport is a rural community with a diverse economy. The town is home to several small businesses, including a sawmill, a furniture maker, a woodworking shop, and a machine shop. The town is also home to several farms, including dairy farms, beef farms, and vegetable farms.
The town is also home to several tourist attractions, including the Newport Historical Society, the Newport Opera House, and the Newport State Park.
Demographics
As of the 2010 census, there were 6,507 people, 2,717 households, and 1,717 families residing in the town. The population density was 97.3 people per square mile (37.6/km2). There were 2,945 housing units at an average density of 44.2 per square mile (17.1/km2). The racial makeup of the town was 97.2% White, 0.3% African American, 0.3% Native American, 0.4% Asian, 0.1% Pacific Islander, 0.3% from other races, and 1.4% from two or more races. Hispanic or Latino of any race were 1.2% of the population.
There were 2,717 households, out of which 28.2% had children under the age of 18 living with them, 49.2% were married couples living together, 10.3% had a female householder with no husband present, and 35.7% were non-families. 29.2% of all households were made up of individuals, and 12.2% had someone living alone who was 65 years of age or older. The average household size was 2.35 and the average family size was 2.86.
In the town, the population was spread out, with 23.2% under the age of 18, 6.7% from 18 to 24, 28.2% from 25 to 44, 25.3% from 45 to 64, and 16.6% who were 65 years of age or older. The median age was 40 years. For every 100 females, there were 94.2 males. For every 100 females age 18 and over, there were 91.2 males.
The median income for a household in the town was $41,944, and the median income for a family was $50,938. Males had a median income of $35,938 versus $25,938 for females. The per capita income for the town was $20,945. About 6.2% of families and 8.7% of the population were below the poverty line, including 10.2% of those under age 18 and 8.2% of those age 65 or over.
Common Questions
What is Per Capita Income in Newport?
Per Capita income in Newport is $31,386.
What is the Median Family Income in Newport?
Median Family Income in Newport is $67,008.
What is the Median Household income in Newport?
Median Household Income in Newport is $67,500.
What is Income or Wage Gap in Newport?
Income or Wage Gap in Newport is 36.2%.
Women in Newport earn 63.8 cents for every dollar earned by a man.
What is Inequality or Gini Index in Newport?
Inequality or Gini Index in Newport is 0.43.
What is the Total Population of Newport?
Total Population of Newport is 5,228.
What is the Total Male Population of Newport?
Total Male Population of Newport is 2,778.
What is the Total Female Population of Newport?
Total Female Population of Newport is 2,450.
What is the Ratio of Males per 100 Females in Newport?
There are 113.39 Males per 100 Females in Newport.
What is the Ratio of Females per 100 Males in Newport?
There are 88.19 Females per 100 Males in Newport.
What is the Median Population Age in Newport?
Median Population Age in Newport is 43.7 Years.
What is the Average Family Size in Newport
Average Family Size in Newport is 3.2 People.
What is the Average Household Size in Newport
Average Household Size in Newport is 2.6 People.
How Large is the Labor Force in Newport?
There are 2,732 People in the Labor Forcein in Newport.
What is the Percentage of People in the Labor Force in Newport?
57.3% of People are in the Labor Force in Newport.
What is the Unemployment Rate in Newport?
Unemployment Rate in Newport is 3.9%.