Berlin, NH Map & Demographics
Berlin Map
Berlin Overview
$25,843
PER CAPITA INCOME
$61,627
AVG FAMILY INCOME
$41,638
AVG HOUSEHOLD INCOME
16.9%
WAGE / INCOME GAP [ % ]
83.1¢/ $1
WAGE / INCOME GAP [ $ ]
0.48
INEQUALITY / GINI INDEX
9,485
TOTAL POPULATION
5,621
MALE POPULATION
3,864
FEMALE POPULATION
145.47
MALES / 100 FEMALES
68.74
FEMALES / 100 MALES
44.2
MEDIAN AGE
2.8
AVG FAMILY SIZE
2.2
AVG HOUSEHOLD SIZE
4,060
LABOR FORCE [ PEOPLE ]
49.9%
PERCENT IN LABOR FORCE
5.2%
UNEMPLOYMENT RATE
Berlin Zip Codes
Berlin Area Codes
Income in Berlin
Income Overview in Berlin
Per Capita Income in Berlin is $25,843, while median incomes of families and households are $61,627 and $41,638 respectively.
| Characteristic | Number | Measure |
| Per Capita Income | 9,485 | $25,843 |
| Median Family Income | 2,095 | $61,627 |
| Mean Family Income | 2,095 | $82,903 |
| Median Household Income | 3,638 | $41,638 |
| Mean Household Income | 3,638 | $63,100 |
| Income Deficit | 2,095 | $0 |
| Wage / Income Gap (%) | 9,485 | 16.91% |
| Wage / Income Gap ($) | 9,485 | 83.09¢ per $1 |
| Gini / Inequality Index | 9,485 | 0.48 |
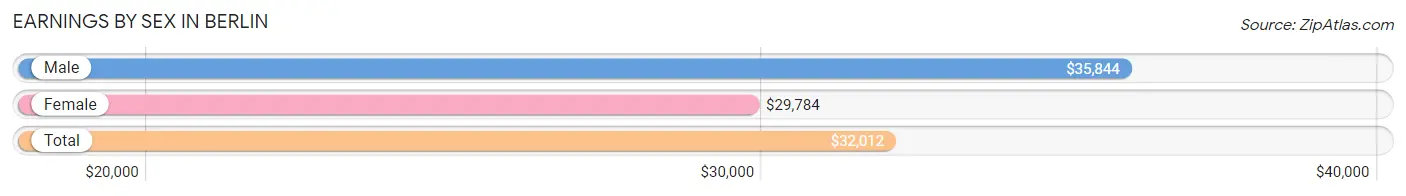
Earnings by Sex in Berlin
Average Earnings in Berlin are $32,012, $35,844 for men and $29,784 for women, a difference of 16.9%.
| Sex | Number | Average Earnings |
| Male | 2,521 (57.1%) | $35,844 |
| Female | 1,891 (42.9%) | $29,784 |
| Total | 4,412 (100.0%) | $32,012 |
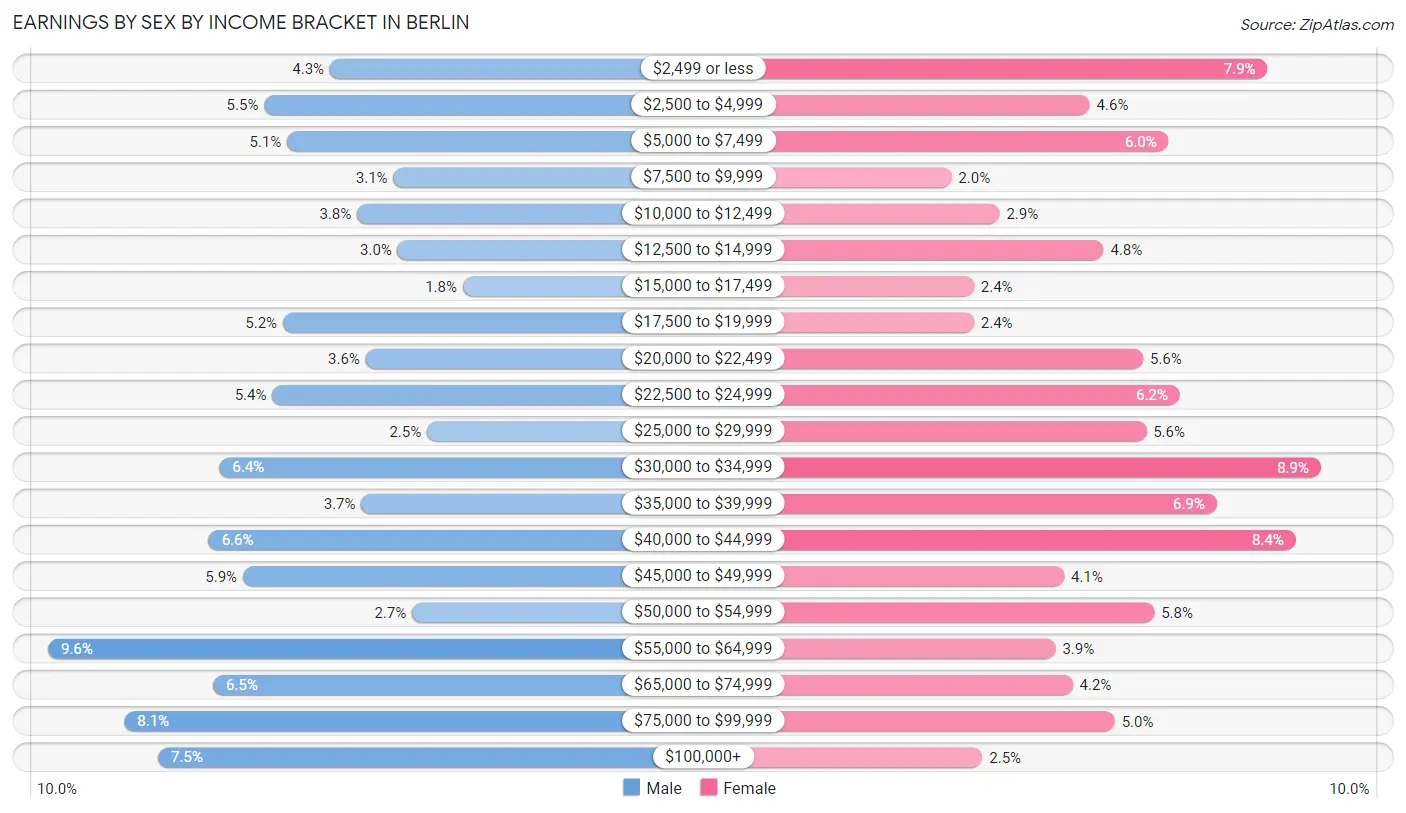
Earnings by Sex by Income Bracket in Berlin
The most common earnings brackets in Berlin are $55,000 to $64,999 for men (241 | 9.6%) and $30,000 to $34,999 for women (168 | 8.9%).
| Income | Male | Female |
| $2,499 or less | 108 (4.3%) | 149 (7.9%) |
| $2,500 to $4,999 | 139 (5.5%) | 86 (4.5%) |
| $5,000 to $7,499 | 128 (5.1%) | 114 (6.0%) |
| $7,500 to $9,999 | 78 (3.1%) | 37 (2.0%) |
| $10,000 to $12,499 | 95 (3.8%) | 54 (2.9%) |
| $12,500 to $14,999 | 76 (3.0%) | 91 (4.8%) |
| $15,000 to $17,499 | 45 (1.8%) | 45 (2.4%) |
| $17,500 to $19,999 | 130 (5.2%) | 45 (2.4%) |
| $20,000 to $22,499 | 91 (3.6%) | 105 (5.6%) |
| $22,500 to $24,999 | 135 (5.4%) | 118 (6.2%) |
| $25,000 to $29,999 | 62 (2.5%) | 106 (5.6%) |
| $30,000 to $34,999 | 160 (6.4%) | 168 (8.9%) |
| $35,000 to $39,999 | 93 (3.7%) | 131 (6.9%) |
| $40,000 to $44,999 | 165 (6.6%) | 159 (8.4%) |
| $45,000 to $49,999 | 149 (5.9%) | 77 (4.1%) |
| $50,000 to $54,999 | 69 (2.7%) | 109 (5.8%) |
| $55,000 to $64,999 | 241 (9.6%) | 74 (3.9%) |
| $65,000 to $74,999 | 163 (6.5%) | 80 (4.2%) |
| $75,000 to $99,999 | 205 (8.1%) | 95 (5.0%) |
| $100,000+ | 189 (7.5%) | 48 (2.5%) |
| Total | 2,521 (100.0%) | 1,891 (100.0%) |
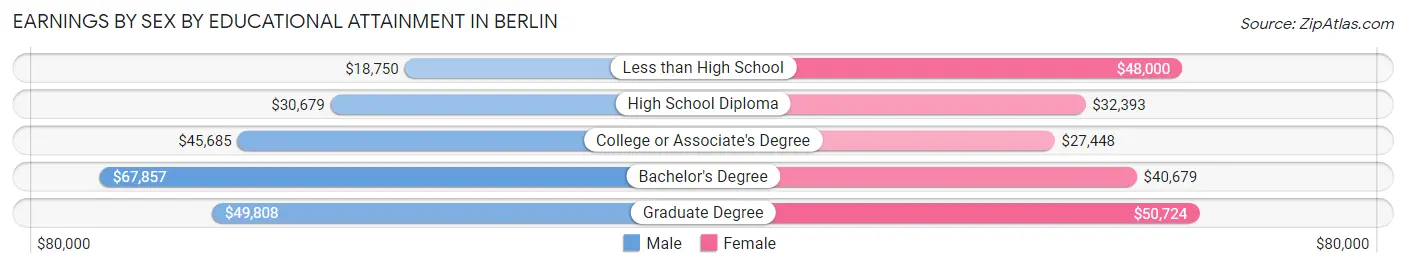
Earnings by Sex by Educational Attainment in Berlin
Average earnings in Berlin are $43,651 for men and $34,470 for women, a difference of 21.0%. Men with an educational attainment of bachelor's degree enjoy the highest average annual earnings of $67,857, while those with less than high school education earn the least with $18,750. Women with an educational attainment of graduate degree earn the most with the average annual earnings of $50,724, while those with college or associate's degree education have the smallest earnings of $27,448.
| Educational Attainment | Male Income | Female Income |
| Less than High School | $18,750 | $48,000 |
| High School Diploma | $30,679 | $32,393 |
| College or Associate's Degree | $45,685 | $27,448 |
| Bachelor's Degree | $67,857 | $40,679 |
| Graduate Degree | $49,808 | $50,724 |
| Total | $43,651 | $34,470 |
Family Income in Berlin
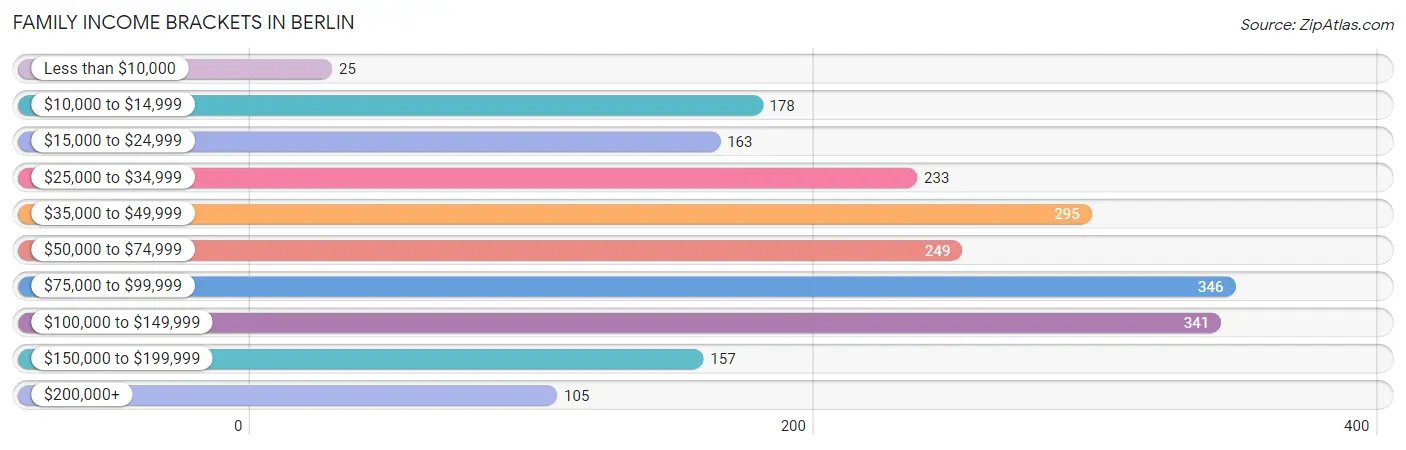
Family Income Brackets in Berlin
According to the Berlin family income data, there are 346 families falling into the $75,000 to $99,999 income range, which is the most common income bracket and makes up 16.5% of all families. Conversely, the less than $10,000 income bracket is the least frequent group with only 25 families (1.2%) belonging to this category.
| Income Bracket | # Families | % Families |
| Less than $10,000 | 25 | 1.2% |
| $10,000 to $14,999 | 178 | 8.5% |
| $15,000 to $24,999 | 163 | 7.8% |
| $25,000 to $34,999 | 233 | 11.1% |
| $35,000 to $49,999 | 295 | 14.1% |
| $50,000 to $74,999 | 249 | 11.9% |
| $75,000 to $99,999 | 346 | 16.5% |
| $100,000 to $149,999 | 341 | 16.3% |
| $150,000 to $199,999 | 157 | 7.5% |
| $200,000+ | 105 | 5.0% |
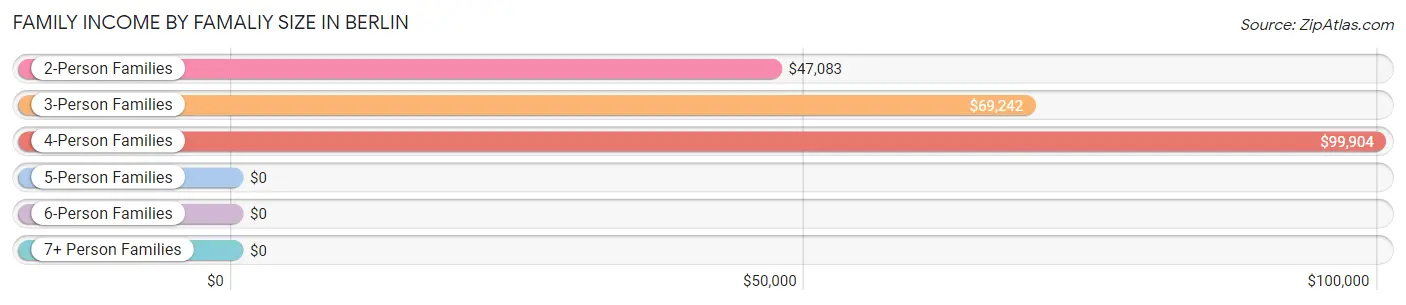
Family Income by Famaliy Size in Berlin
4-person families (317 | 15.1%) account for the highest median family income in Berlin with $99,904 per family, while 4-person families (317 | 15.1%) have the highest median income of $24,976 per family member.
| Income Bracket | # Families | Median Income |
| 2-Person Families | 1,157 (55.2%) | $47,083 |
| 3-Person Families | 546 (26.1%) | $69,242 |
| 4-Person Families | 317 (15.1%) | $99,904 |
| 5-Person Families | 30 (1.4%) | $0 |
| 6-Person Families | 45 (2.1%) | $0 |
| 7+ Person Families | 0 (0.0%) | $0 |
| Total | 2,095 (100.0%) | $61,627 |
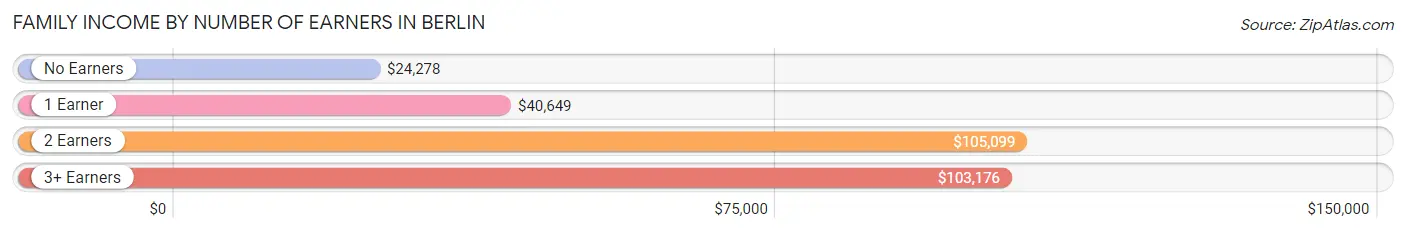
Family Income by Number of Earners in Berlin
The median family income in Berlin is $61,627, with families comprising 2 earners (687) having the highest median family income of $105,099, while families with no earners (533) have the lowest median family income of $24,278, accounting for 32.8% and 25.4% of families, respectively.
| Number of Earners | # Families | Median Income |
| No Earners | 533 (25.4%) | $24,278 |
| 1 Earner | 533 (25.4%) | $40,649 |
| 2 Earners | 687 (32.8%) | $105,099 |
| 3+ Earners | 342 (16.3%) | $103,176 |
| Total | 2,095 (100.0%) | $61,627 |
Household Income in Berlin
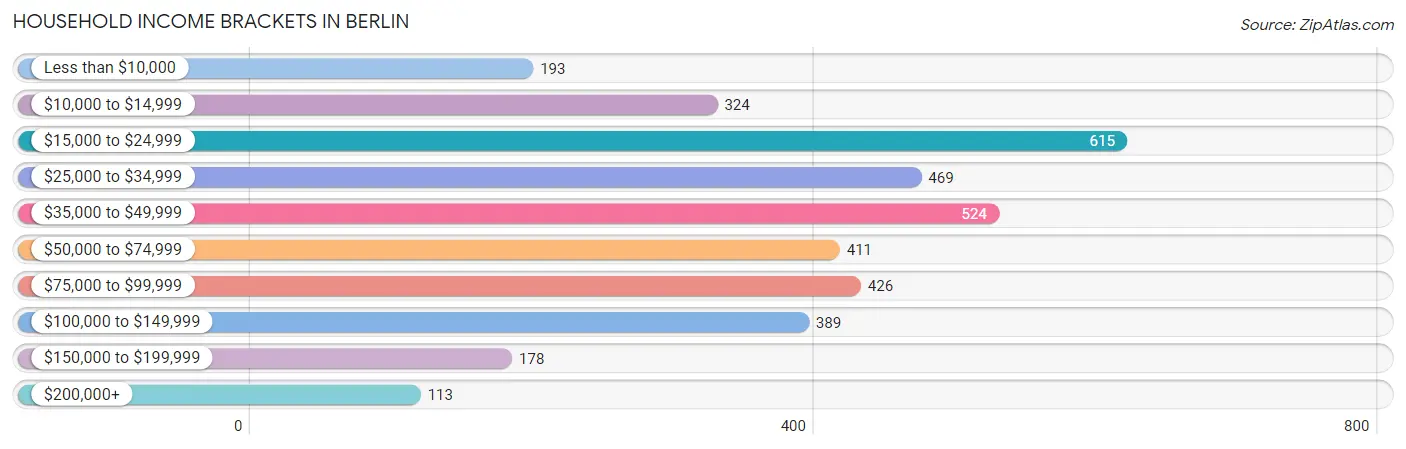
Household Income Brackets in Berlin
With 615 households falling in the category, the $15,000 to $24,999 income range is the most frequent in Berlin, accounting for 16.9% of all households. In contrast, only 113 households (3.1%) fall into the $200,000+ income bracket, making it the least populous group.
| Income Bracket | # Households | % Households |
| Less than $10,000 | 193 | 5.3% |
| $10,000 to $14,999 | 324 | 8.9% |
| $15,000 to $24,999 | 615 | 16.9% |
| $25,000 to $34,999 | 469 | 12.9% |
| $35,000 to $49,999 | 524 | 14.4% |
| $50,000 to $74,999 | 411 | 11.3% |
| $75,000 to $99,999 | 426 | 11.7% |
| $100,000 to $149,999 | 389 | 10.7% |
| $150,000 to $199,999 | 178 | 4.9% |
| $200,000+ | 113 | 3.1% |
Household Income by Householder Age in Berlin
The median household income in Berlin is $41,638, with the highest median household income of $52,193 found in the 25 to 44 years age bracket for the primary householder. A total of 937 households (25.8%) fall into this category. Meanwhile, the 15 to 24 years age bracket for the primary householder has the lowest median household income of $21,875, with 129 households (3.5%) in this group.
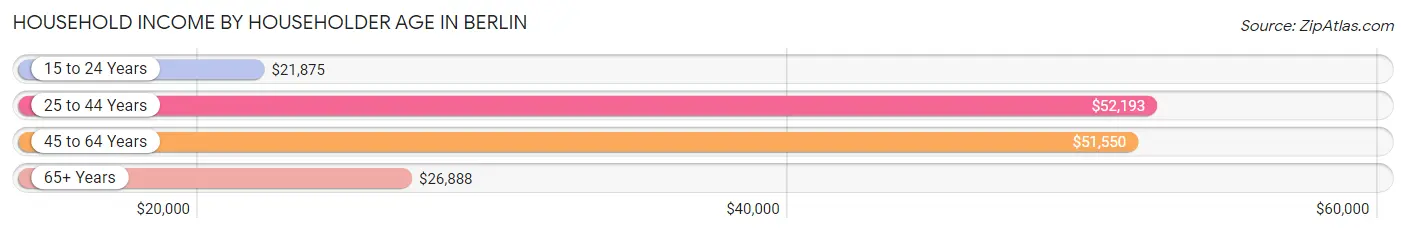
| Income Bracket | # Households | Median Income |
| 15 to 24 Years | 129 (3.5%) | $21,875 |
| 25 to 44 Years | 937 (25.8%) | $52,193 |
| 45 to 64 Years | 1,431 (39.3%) | $51,550 |
| 65+ Years | 1,141 (31.4%) | $26,888 |
| Total | 3,638 (100.0%) | $41,638 |
Poverty in Berlin
Income Below Poverty by Sex and Age in Berlin
With 13.3% poverty level for males and 16.1% for females among the residents of Berlin, 75 year old and over males and 15 year old females are the most vulnerable to poverty, with 64 males (28.6%) and 22 females (100.0%) in their respective age groups living below the poverty level.
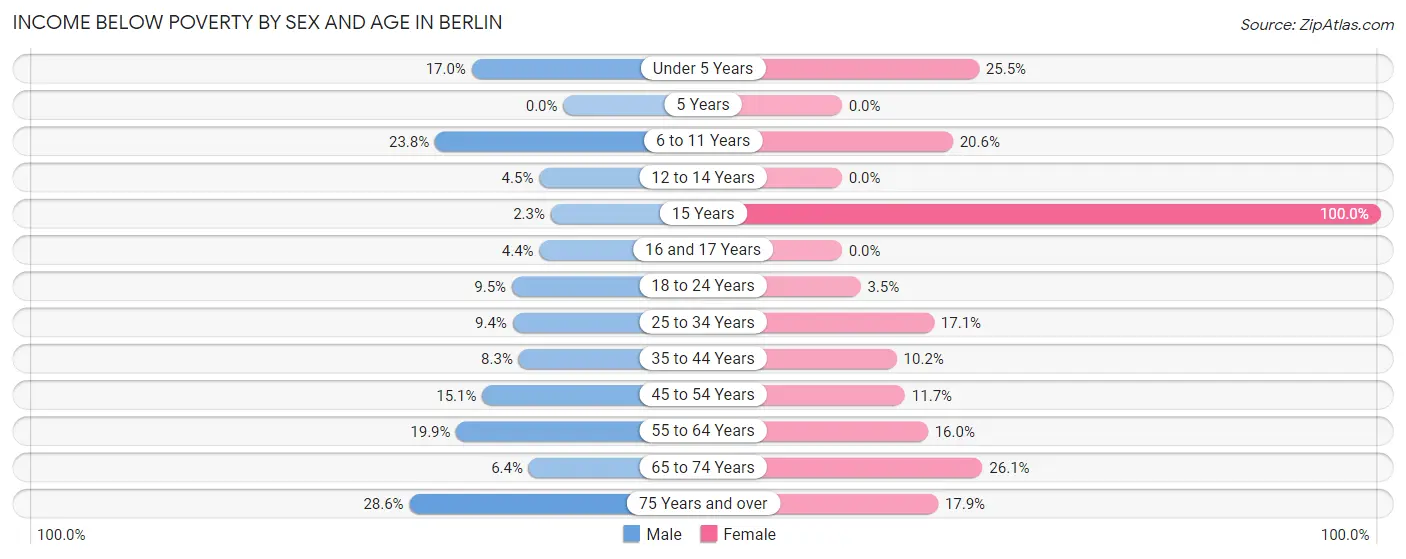
| Age Bracket | Male | Female |
| Under 5 Years | 33 (17.0%) | 56 (25.5%) |
| 5 Years | 0 (0.0%) | 0 (0.0%) |
| 6 to 11 Years | 60 (23.8%) | 42 (20.6%) |
| 12 to 14 Years | 9 (4.5%) | 0 (0.0%) |
| 15 Years | 1 (2.3%) | 22 (100.0%) |
| 16 and 17 Years | 8 (4.4%) | 0 (0.0%) |
| 18 to 24 Years | 27 (9.5%) | 11 (3.5%) |
| 25 to 34 Years | 66 (9.4%) | 66 (17.1%) |
| 35 to 44 Years | 28 (8.3%) | 40 (10.2%) |
| 45 to 54 Years | 93 (15.0%) | 61 (11.7%) |
| 55 to 64 Years | 140 (19.9%) | 85 (16.0%) |
| 65 to 74 Years | 29 (6.4%) | 136 (26.1%) |
| 75 Years and over | 64 (28.6%) | 78 (17.8%) |
| Total | 558 (13.3%) | 597 (16.1%) |
Income Above Poverty by Sex and Age in Berlin
According to the poverty statistics in Berlin, males aged 5 years and females aged 5 years are the age groups that are most secure financially, with 100.0% of males and 100.0% of females in these age groups living above the poverty line.
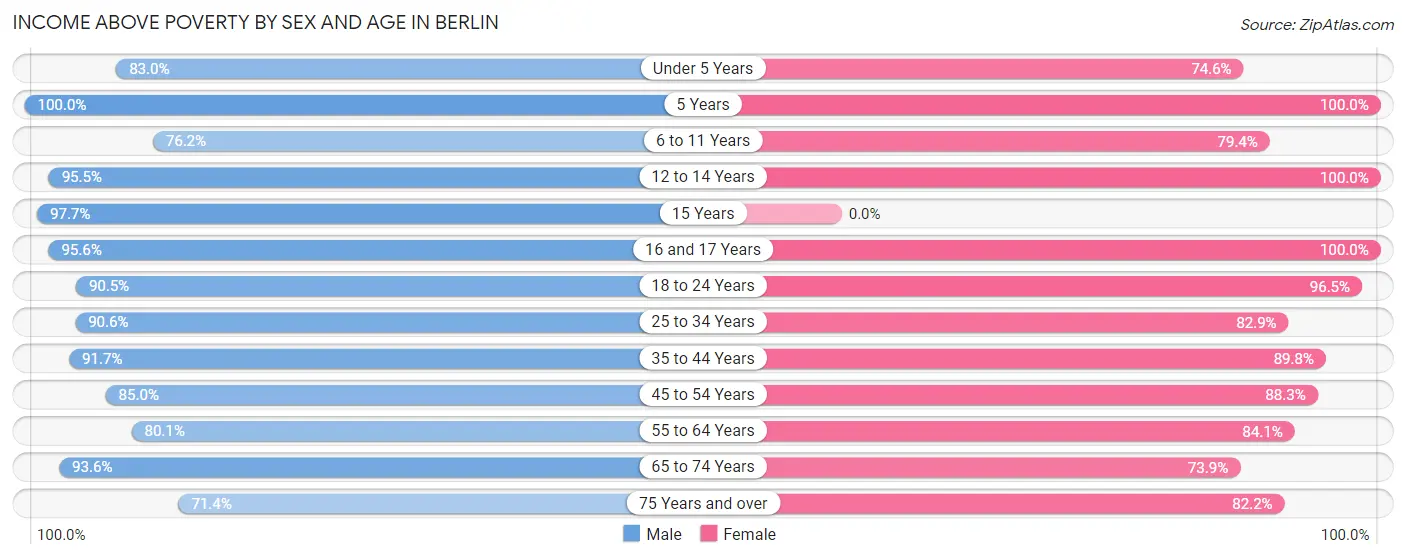
| Age Bracket | Male | Female |
| Under 5 Years | 161 (83.0%) | 164 (74.6%) |
| 5 Years | 11 (100.0%) | 60 (100.0%) |
| 6 to 11 Years | 192 (76.2%) | 162 (79.4%) |
| 12 to 14 Years | 192 (95.5%) | 72 (100.0%) |
| 15 Years | 42 (97.7%) | 0 (0.0%) |
| 16 and 17 Years | 172 (95.6%) | 14 (100.0%) |
| 18 to 24 Years | 256 (90.5%) | 306 (96.5%) |
| 25 to 34 Years | 636 (90.6%) | 320 (82.9%) |
| 35 to 44 Years | 310 (91.7%) | 353 (89.8%) |
| 45 to 54 Years | 525 (85.0%) | 460 (88.3%) |
| 55 to 64 Years | 565 (80.1%) | 448 (84.1%) |
| 65 to 74 Years | 423 (93.6%) | 385 (73.9%) |
| 75 Years and over | 160 (71.4%) | 359 (82.2%) |
| Total | 3,645 (86.7%) | 3,103 (83.9%) |
Income Below Poverty Among Married-Couple Families in Berlin
The poverty statistics for married-couple families in Berlin show that 9.2% or 136 of the total 1,473 families live below the poverty line. Families with no children have the highest poverty rate of 12.3%, comprising of 118 families. On the other hand, families with 3 or 4 children have the lowest poverty rate of 0.0%, which includes 0 families.
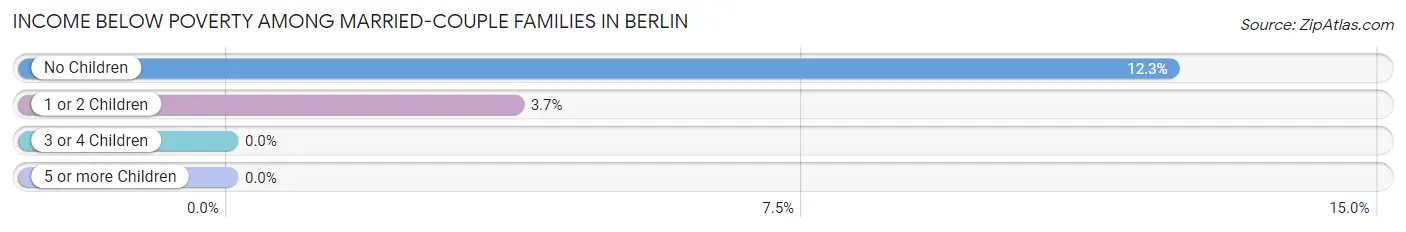
| Children | Above Poverty | Below Poverty |
| No Children | 842 (87.7%) | 118 (12.3%) |
| 1 or 2 Children | 465 (96.3%) | 18 (3.7%) |
| 3 or 4 Children | 30 (100.0%) | 0 (0.0%) |
| 5 or more Children | 0 (0.0%) | 0 (0.0%) |
| Total | 1,337 (90.8%) | 136 (9.2%) |
Income Below Poverty Among Single-Parent Households in Berlin
According to the poverty data in Berlin, 13.9% or 34 single-father households and 17.8% or 67 single-mother households are living below the poverty line. Among single-father households, those with 1 or 2 children have the highest poverty rate, with 34 households (25.8%) experiencing poverty. Likewise, among single-mother households, those with 3 or 4 children have the highest poverty rate, with 29 households (74.4%) falling below the poverty line.
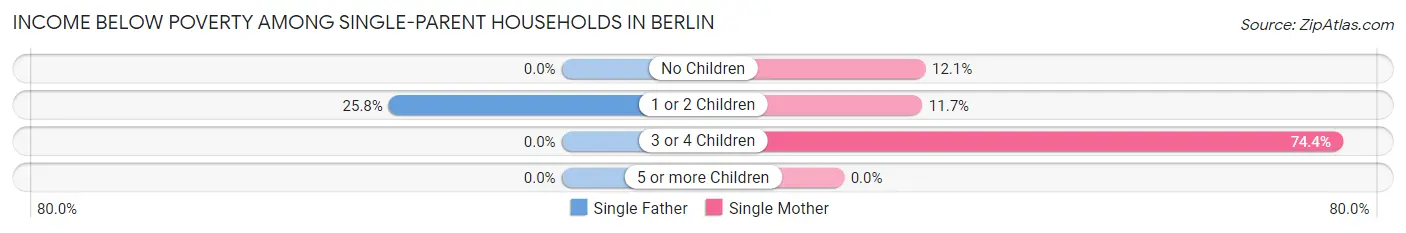
| Children | Single Father | Single Mother |
| No Children | 0 (0.0%) | 12 (12.1%) |
| 1 or 2 Children | 34 (25.8%) | 26 (11.7%) |
| 3 or 4 Children | 0 (0.0%) | 29 (74.4%) |
| 5 or more Children | 0 (0.0%) | 0 (0.0%) |
| Total | 34 (13.9%) | 67 (17.8%) |
Income Below Poverty Among Married-Couple vs Single-Parent Households in Berlin
The poverty data for Berlin shows that 136 of the married-couple family households (9.2%) and 101 of the single-parent households (16.2%) are living below the poverty level. Within the married-couple family households, those with no children have the highest poverty rate, with 118 households (12.3%) falling below the poverty line. Among the single-parent households, those with 3 or 4 children have the highest poverty rate, with 29 household (74.4%) living below poverty.
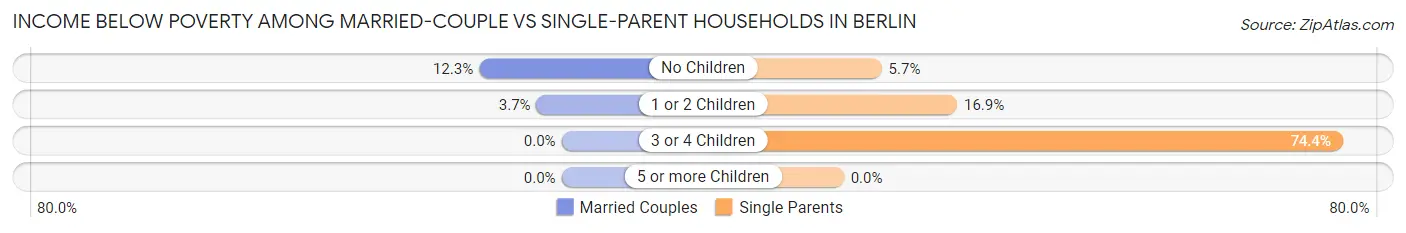
| Children | Married-Couple Families | Single-Parent Households |
| No Children | 118 (12.3%) | 12 (5.7%) |
| 1 or 2 Children | 18 (3.7%) | 60 (16.9%) |
| 3 or 4 Children | 0 (0.0%) | 29 (74.4%) |
| 5 or more Children | 0 (0.0%) | 0 (0.0%) |
| Total | 136 (9.2%) | 101 (16.2%) |
Race in Berlin
The most populous races in Berlin are White / Caucasian (8,637 | 91.1%), Black / African American (612 | 6.5%), and Hispanic or Latino (421 | 4.4%).
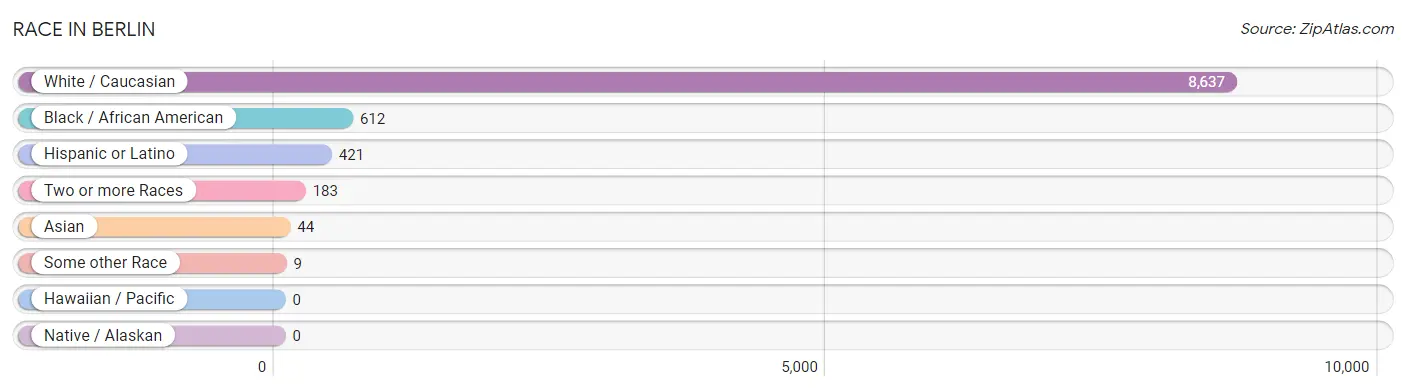
| Race | # Population | % Population |
| Asian | 44 | 0.5% |
| Black / African American | 612 | 6.5% |
| Hawaiian / Pacific | 0 | 0.0% |
| Hispanic or Latino | 421 | 4.4% |
| Native / Alaskan | 0 | 0.0% |
| White / Caucasian | 8,637 | 91.1% |
| Two or more Races | 183 | 1.9% |
| Some other Race | 9 | 0.1% |
| Total | 9,485 | 100.0% |
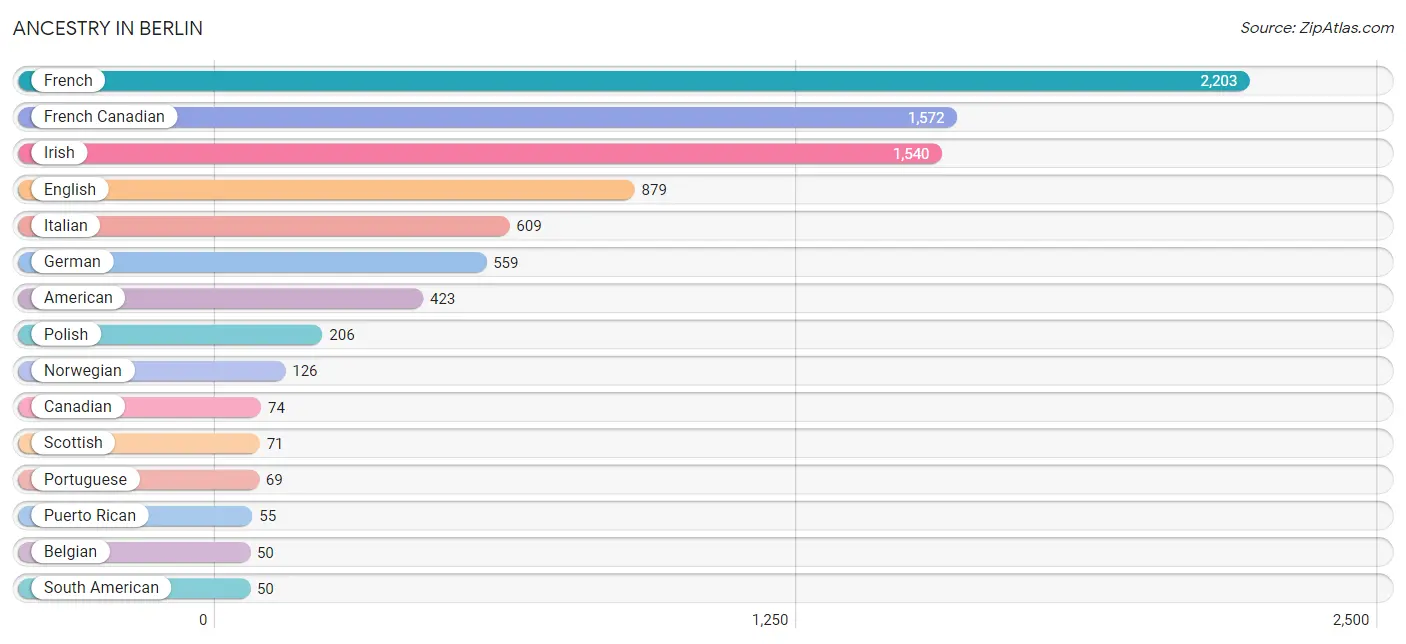
Ancestry in Berlin
The most populous ancestries reported in Berlin are French (2,203 | 23.2%), French Canadian (1,572 | 16.6%), Irish (1,540 | 16.2%), English (879 | 9.3%), and Italian (609 | 6.4%), together accounting for 71.7% of all Berlin residents.
| Ancestry | # Population | % Population |
| African | 29 | 0.3% |
| American | 423 | 4.5% |
| Arab | 6 | 0.1% |
| Belgian | 50 | 0.5% |
| Bhutanese | 25 | 0.3% |
| British | 17 | 0.2% |
| Burmese | 5 | 0.1% |
| Canadian | 74 | 0.8% |
| Cape Verdean | 17 | 0.2% |
| Central American | 11 | 0.1% |
| Cherokee | 13 | 0.1% |
| Chilean | 45 | 0.5% |
| Cree | 18 | 0.2% |
| Cuban | 9 | 0.1% |
| Czechoslovakian | 30 | 0.3% |
| Danish | 18 | 0.2% |
| Dominican | 2 | 0.0% |
| Dutch | 18 | 0.2% |
| Egyptian | 6 | 0.1% |
| English | 879 | 9.3% |
| European | 8 | 0.1% |
| Finnish | 9 | 0.1% |
| French | 2,203 | 23.2% |
| French Canadian | 1,572 | 16.6% |
| German | 559 | 5.9% |
| Greek | 32 | 0.3% |
| Honduran | 11 | 0.1% |
| Hungarian | 29 | 0.3% |
| Indian (Asian) | 14 | 0.2% |
| Irish | 1,540 | 16.2% |
| Iroquois | 22 | 0.2% |
| Italian | 609 | 6.4% |
| Jamaican | 8 | 0.1% |
| Laotian | 9 | 0.1% |
| Latvian | 8 | 0.1% |
| Lithuanian | 19 | 0.2% |
| Mexican | 38 | 0.4% |
| Norwegian | 126 | 1.3% |
| Paraguayan | 5 | 0.1% |
| Polish | 206 | 2.2% |
| Portuguese | 69 | 0.7% |
| Puerto Rican | 55 | 0.6% |
| Russian | 14 | 0.2% |
| Scandinavian | 11 | 0.1% |
| Scotch-Irish | 36 | 0.4% |
| Scottish | 71 | 0.7% |
| Serbian | 17 | 0.2% |
| South American | 50 | 0.5% |
| Spanish | 12 | 0.1% |
| Subsaharan African | 46 | 0.5% |
| Swedish | 22 | 0.2% |
| Swiss | 12 | 0.1% |
| Syrian | 6 | 0.1% |
| Ukrainian | 7 | 0.1% |
| Ute | 2 | 0.0% |
| Welsh | 39 | 0.4% | View All 56 Rows |
Immigrants in Berlin
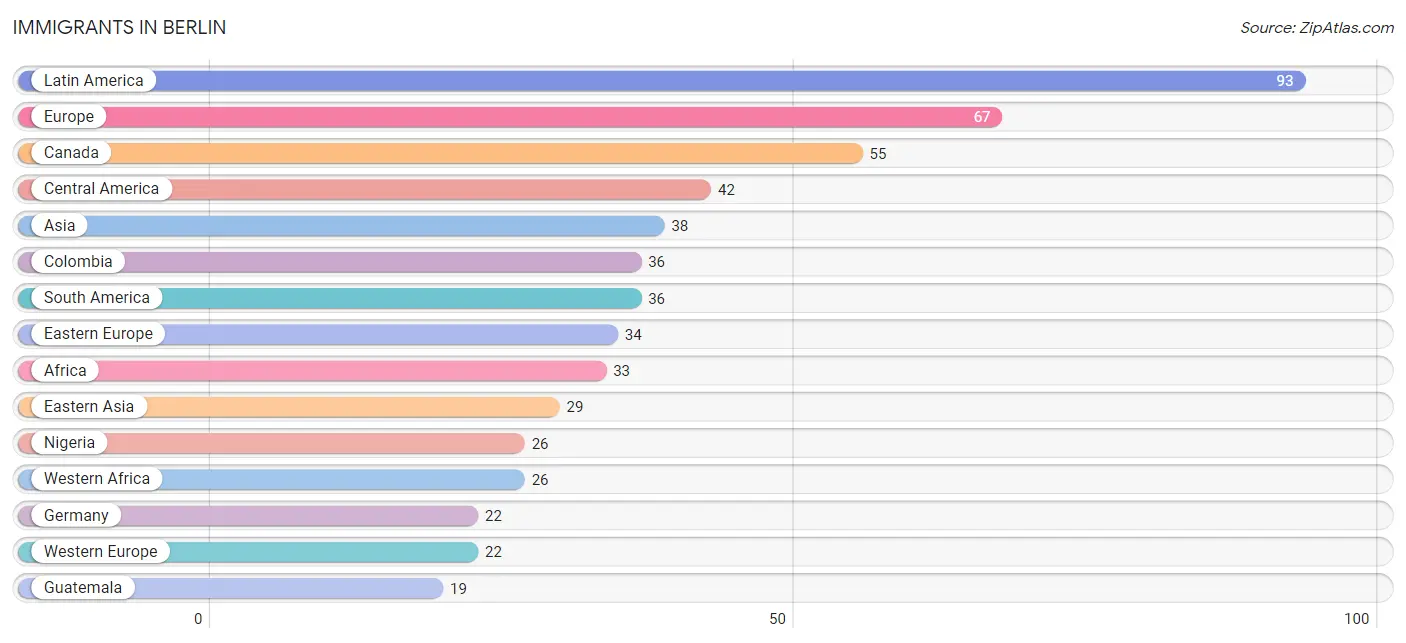
The most numerous immigrant groups reported in Berlin came from Latin America (93 | 1.0%), Europe (67 | 0.7%), Canada (55 | 0.6%), Central America (42 | 0.4%), and Asia (38 | 0.4%), together accounting for 3.1% of all Berlin residents.
| Immigration Origin | # Population | % Population |
| Africa | 33 | 0.4% |
| Asia | 38 | 0.4% |
| Canada | 55 | 0.6% |
| Caribbean | 15 | 0.2% |
| Central America | 42 | 0.4% |
| China | 14 | 0.2% |
| Colombia | 36 | 0.4% |
| Dominican Republic | 15 | 0.2% |
| Eastern Asia | 29 | 0.3% |
| Eastern Europe | 34 | 0.4% |
| England | 11 | 0.1% |
| Europe | 67 | 0.7% |
| Germany | 22 | 0.2% |
| Guatemala | 19 | 0.2% |
| Honduras | 5 | 0.1% |
| Hong Kong | 14 | 0.2% |
| Japan | 15 | 0.2% |
| Jordan | 9 | 0.1% |
| Latin America | 93 | 1.0% |
| Mexico | 18 | 0.2% |
| Nigeria | 26 | 0.3% |
| Northern Africa | 7 | 0.1% |
| Northern Europe | 11 | 0.1% |
| Poland | 10 | 0.1% |
| Russia | 7 | 0.1% |
| Serbia | 17 | 0.2% |
| South America | 36 | 0.4% |
| Sudan | 7 | 0.1% |
| Western Africa | 26 | 0.3% |
| Western Asia | 9 | 0.1% |
| Western Europe | 22 | 0.2% | View All 31 Rows |
Sex and Age in Berlin
Sex and Age in Berlin
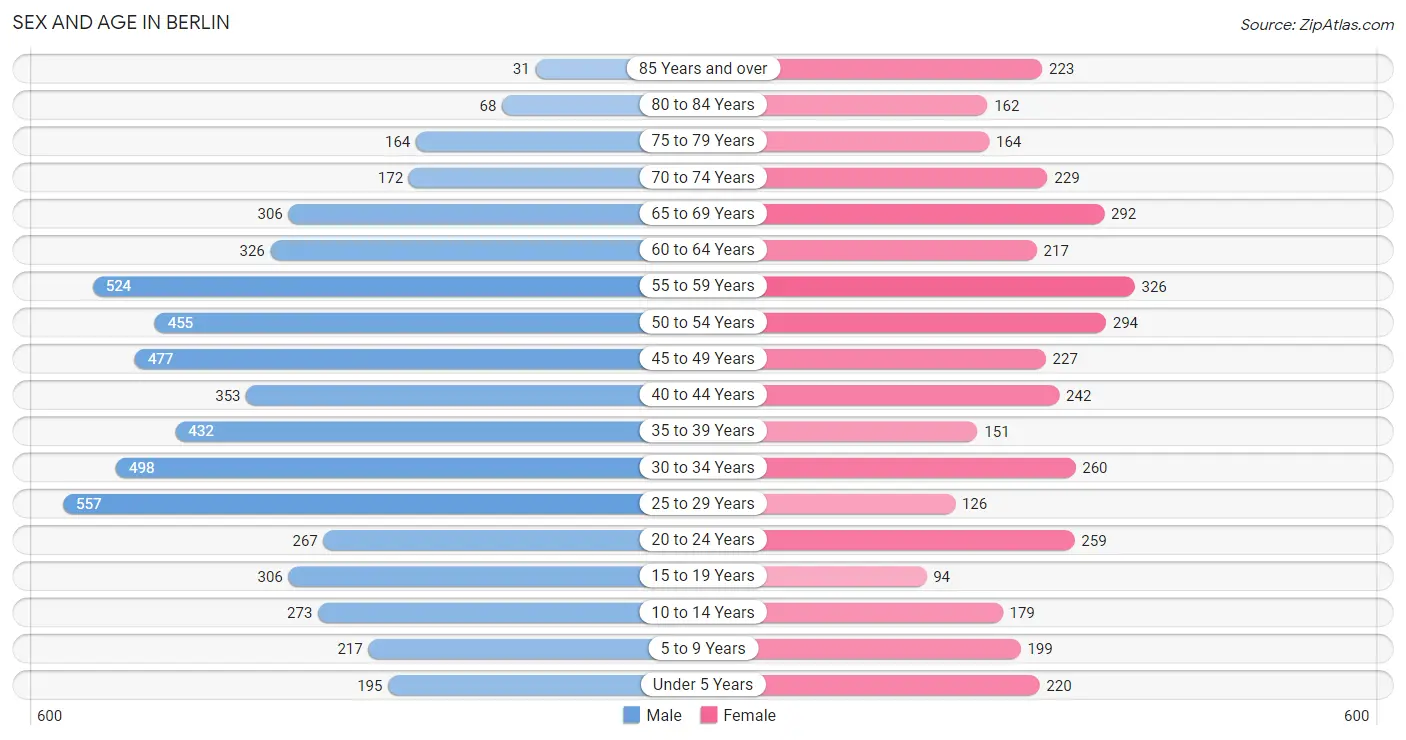
The most populous age groups in Berlin are 25 to 29 Years (557 | 9.9%) for men and 55 to 59 Years (326 | 8.4%) for women.
| Age Bracket | Male | Female |
| Under 5 Years | 195 (3.5%) | 220 (5.7%) |
| 5 to 9 Years | 217 (3.9%) | 199 (5.1%) |
| 10 to 14 Years | 273 (4.9%) | 179 (4.6%) |
| 15 to 19 Years | 306 (5.4%) | 94 (2.4%) |
| 20 to 24 Years | 267 (4.8%) | 259 (6.7%) |
| 25 to 29 Years | 557 (9.9%) | 126 (3.3%) |
| 30 to 34 Years | 498 (8.9%) | 260 (6.7%) |
| 35 to 39 Years | 432 (7.7%) | 151 (3.9%) |
| 40 to 44 Years | 353 (6.3%) | 242 (6.3%) |
| 45 to 49 Years | 477 (8.5%) | 227 (5.9%) |
| 50 to 54 Years | 455 (8.1%) | 294 (7.6%) |
| 55 to 59 Years | 524 (9.3%) | 326 (8.4%) |
| 60 to 64 Years | 326 (5.8%) | 217 (5.6%) |
| 65 to 69 Years | 306 (5.4%) | 292 (7.6%) |
| 70 to 74 Years | 172 (3.1%) | 229 (5.9%) |
| 75 to 79 Years | 164 (2.9%) | 164 (4.2%) |
| 80 to 84 Years | 68 (1.2%) | 162 (4.2%) |
| 85 Years and over | 31 (0.5%) | 223 (5.8%) |
| Total | 5,621 (100.0%) | 3,864 (100.0%) |
Families and Households in Berlin
Median Family Size in Berlin
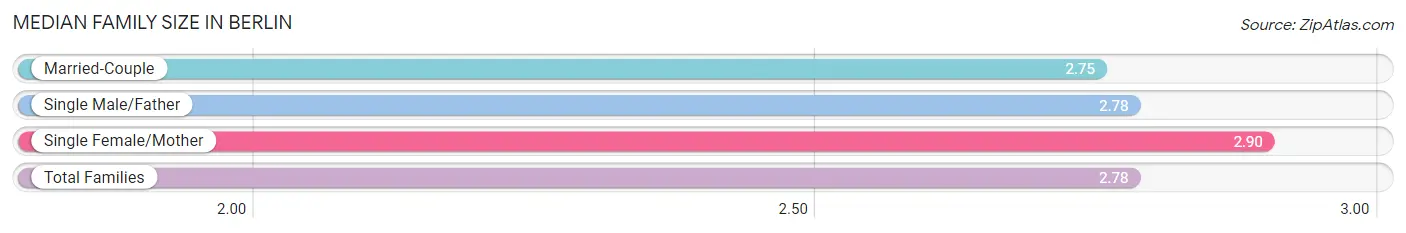
The median family size in Berlin is 2.78 persons per family, with single female/mother families (377 | 18.0%) accounting for the largest median family size of 2.9 persons per family. On the other hand, married-couple families (1,473 | 70.3%) represent the smallest median family size with 2.75 persons per family.
| Family Type | # Families | Family Size |
| Married-Couple | 1,473 (70.3%) | 2.75 |
| Single Male/Father | 245 (11.7%) | 2.78 |
| Single Female/Mother | 377 (18.0%) | 2.90 |
| Total Families | 2,095 (100.0%) | 2.78 |
Median Household Size in Berlin
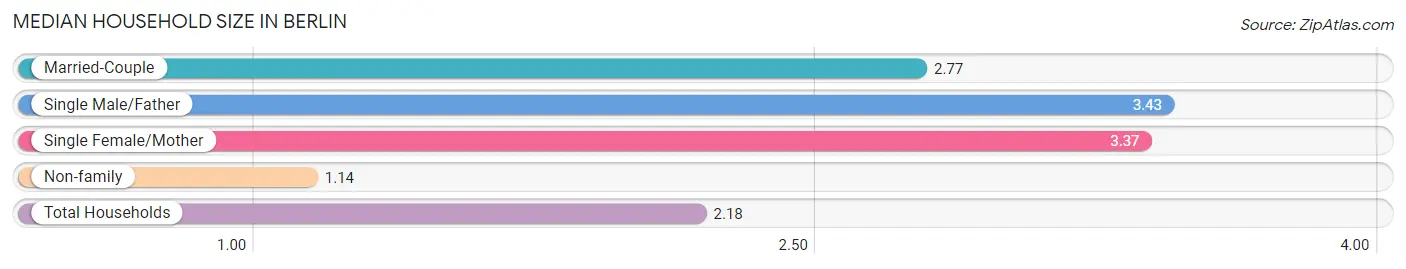
The median household size in Berlin is 2.18 persons per household, with single male/father households (245 | 6.7%) accounting for the largest median household size of 3.43 persons per household. non-family households (1,543 | 42.4%) represent the smallest median household size with 1.14 persons per household.
| Household Type | # Households | Household Size |
| Married-Couple | 1,473 (40.5%) | 2.77 |
| Single Male/Father | 245 (6.7%) | 3.43 |
| Single Female/Mother | 377 (10.4%) | 3.37 |
| Non-family | 1,543 (42.4%) | 1.14 |
| Total Households | 3,638 (100.0%) | 2.18 |
Household Size by Marriage Status in Berlin
Out of a total of 3,638 households in Berlin, 2,095 (57.6%) are family households, while 1,543 (42.4%) are nonfamily households. The most numerous type of family households are 2-person households, comprising 1,071, and the most common type of nonfamily households are 1-person households, comprising 1,345.
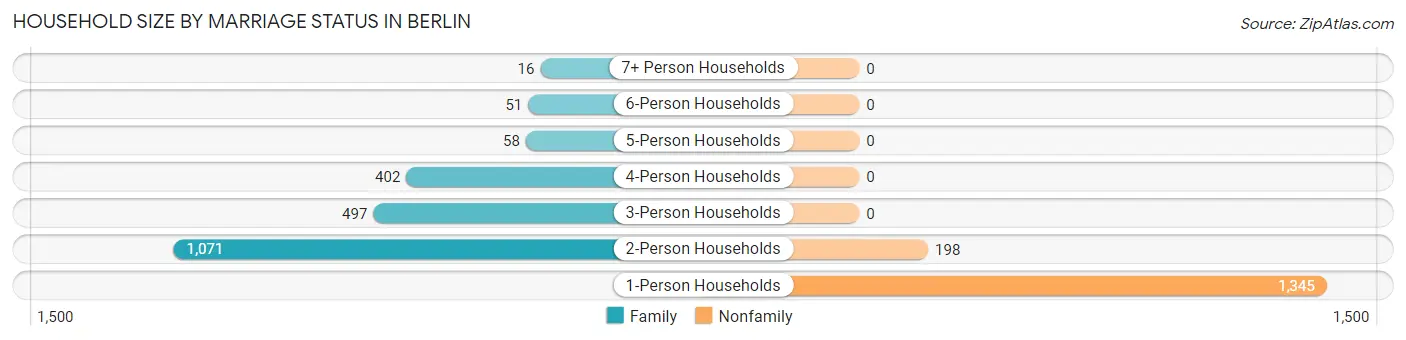
| Household Size | Family Households | Nonfamily Households |
| 1-Person Households | - | 1,345 (37.0%) |
| 2-Person Households | 1,071 (29.4%) | 198 (5.4%) |
| 3-Person Households | 497 (13.7%) | 0 (0.0%) |
| 4-Person Households | 402 (11.1%) | 0 (0.0%) |
| 5-Person Households | 58 (1.6%) | 0 (0.0%) |
| 6-Person Households | 51 (1.4%) | 0 (0.0%) |
| 7+ Person Households | 16 (0.4%) | 0 (0.0%) |
| Total | 2,095 (57.6%) | 1,543 (42.4%) |
Female Fertility in Berlin
Fertility by Age in Berlin
Average fertility rate in Berlin is 121.0 births per 1,000 women. Women in the age bracket of 20 to 34 years have the highest fertility rate with 268.0 births per 1,000 women. Women in the age bracket of 20 to 34 years acount for 100.0% of all women with births.
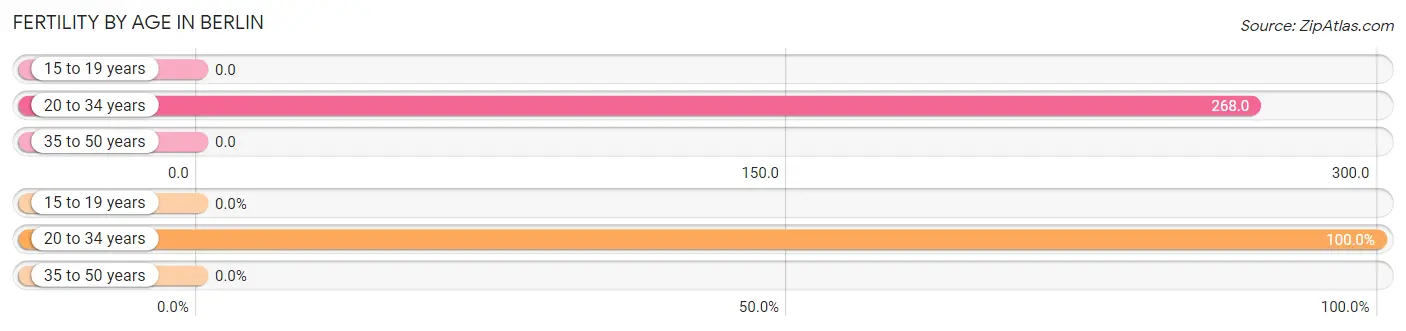
| Age Bracket | Women with Births | Births / 1,000 Women |
| 15 to 19 years | 0 (0.0%) | 0.0 |
| 20 to 34 years | 173 (100.0%) | 268.0 |
| 35 to 50 years | 0 (0.0%) | 0.0 |
| Total | 173 (100.0%) | 121.0 |
Fertility by Age by Marriage Status in Berlin
19.1% of women with births (173) in Berlin are married. The highest percentage of unmarried women with births falls into 20 to 34 years age bracket with 80.9% of them unmarried at the time of birth, while the lowest percentage of unmarried women with births belong to 20 to 34 years age bracket with 80.9% of them unmarried.
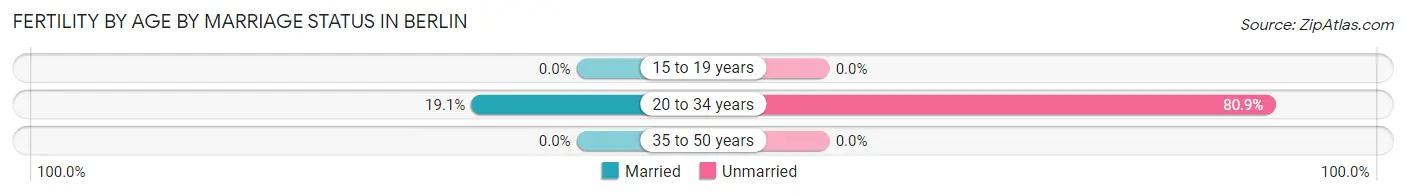
| Age Bracket | Married | Unmarried |
| 15 to 19 years | 0 (0.0%) | 0 (0.0%) |
| 20 to 34 years | 33 (19.1%) | 140 (80.9%) |
| 35 to 50 years | 0 (0.0%) | 0 (0.0%) |
| Total | 33 (19.1%) | 140 (80.9%) |
Fertility by Education in Berlin
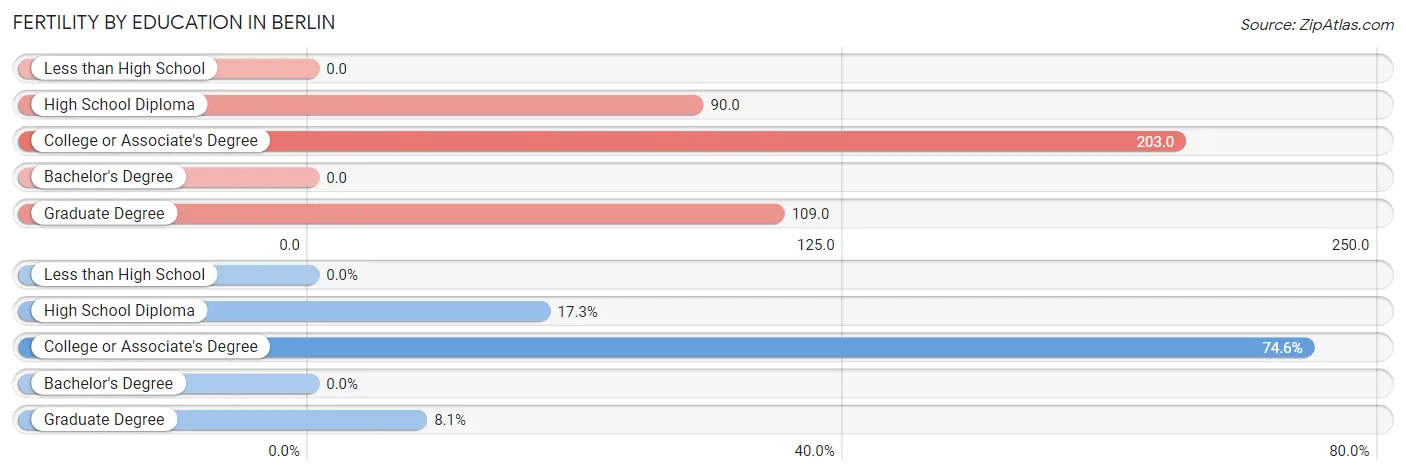
| Educational Attainment | Women with Births | Births / 1,000 Women |
| Less than High School | 0 (0.0%) | 0.0 |
| High School Diploma | 30 (17.3%) | 90.0 |
| College or Associate's Degree | 129 (74.6%) | 203.0 |
| Bachelor's Degree | 0 (0.0%) | 0.0 |
| Graduate Degree | 14 (8.1%) | 109.0 |
| Total | 173 (100.0%) | 121.0 |
Fertility by Education by Marriage Status in Berlin
80.9% of women with births in Berlin are unmarried. Women with the educational attainment of graduate degree are most likely to be married with 100.0% of them married at childbirth, while women with the educational attainment of college or associate's degree are least likely to be married with 100.0% of them unmarried at childbirth.
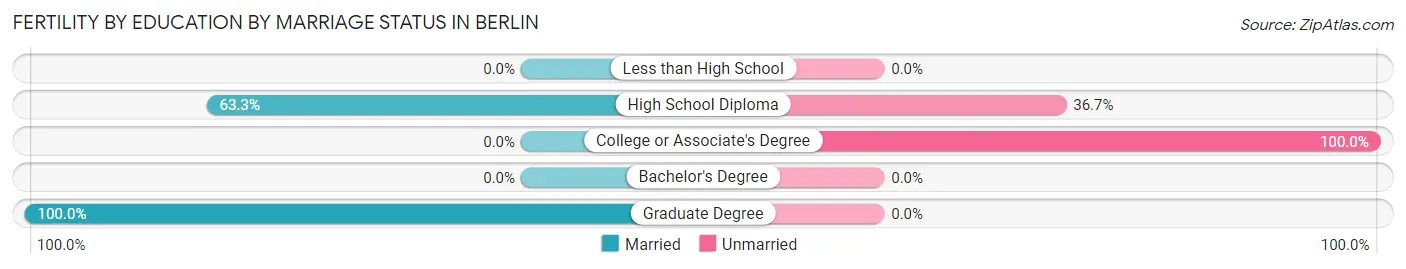
| Educational Attainment | Married | Unmarried |
| Less than High School | 0 (0.0%) | 0 (0.0%) |
| High School Diploma | 19 (63.3%) | 11 (36.7%) |
| College or Associate's Degree | 0 (0.0%) | 129 (100.0%) |
| Bachelor's Degree | 0 (0.0%) | 0 (0.0%) |
| Graduate Degree | 14 (100.0%) | 0 (0.0%) |
| Total | 33 (19.1%) | 140 (80.9%) |
Employment Characteristics in Berlin
Employment by Class of Employer in Berlin
Among the 3,682 employed individuals in Berlin, private company employees (2,161 | 58.7%), not-for-profit organizations (573 | 15.6%), and local government employees (280 | 7.6%) make up the most common classes of employment.
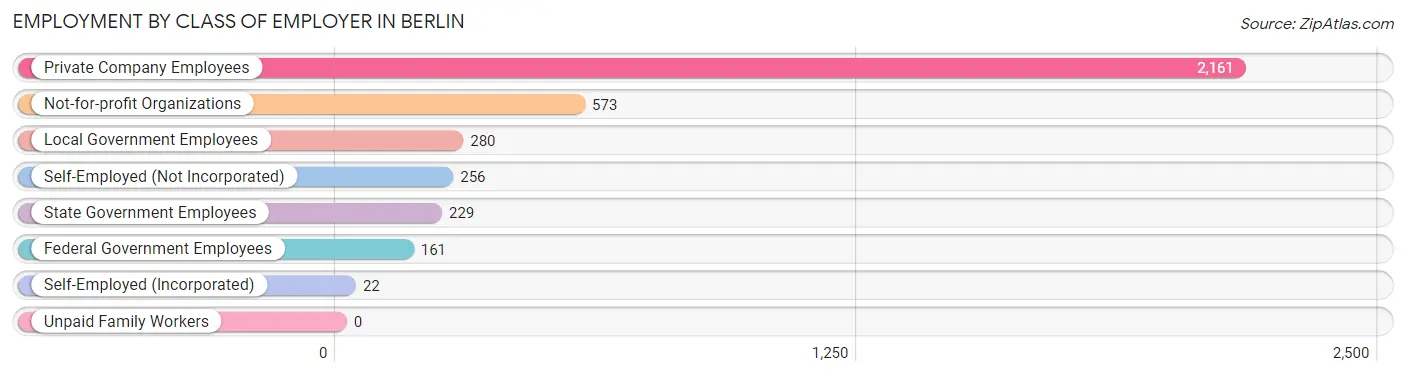
| Employer Class | # Employees | % Employees |
| Private Company Employees | 2,161 | 58.7% |
| Self-Employed (Incorporated) | 22 | 0.6% |
| Self-Employed (Not Incorporated) | 256 | 7.0% |
| Not-for-profit Organizations | 573 | 15.6% |
| Local Government Employees | 280 | 7.6% |
| State Government Employees | 229 | 6.2% |
| Federal Government Employees | 161 | 4.4% |
| Unpaid Family Workers | 0 | 0.0% |
| Total | 3,682 | 100.0% |
Employment Status by Age in Berlin
According to the labor force statistics for Berlin, out of the total population over 16 years of age (8,137), 49.9% or 4,060 individuals are in the labor force, with 5.2% or 211 of them unemployed. The age group with the highest labor force participation rate is 16 to 19 years, with 79.1% or 265 individuals in the labor force. Within the labor force, the 16 to 19 years age range has the highest percentage of unemployed individuals, with 27.9% or 74 of them being unemployed.
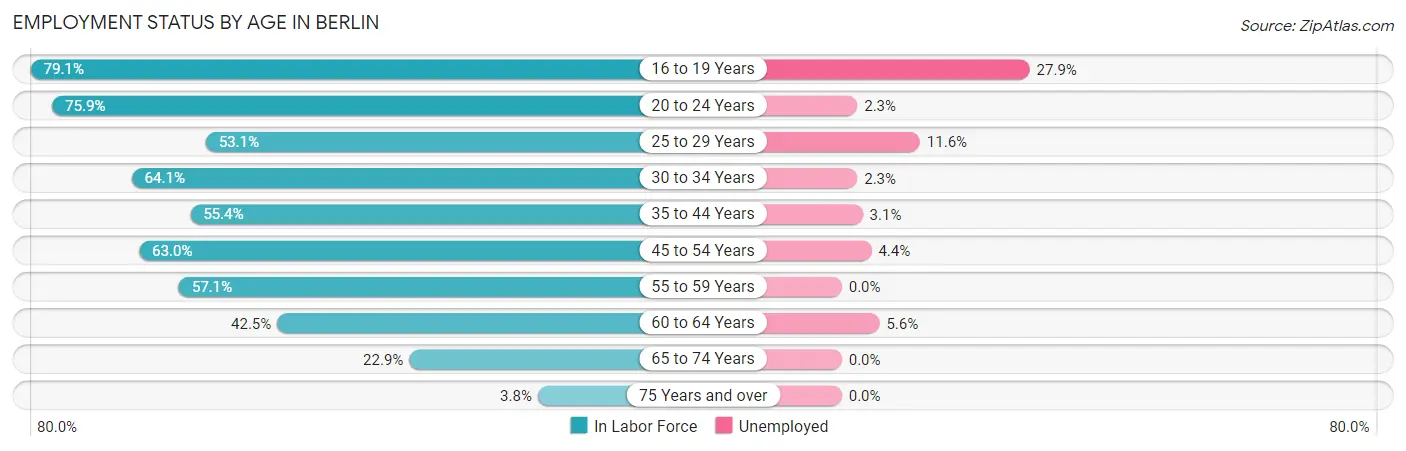
| Age Bracket | In Labor Force | Unemployed |
| 16 to 19 Years | 265 (79.1%) | 74 (27.9%) |
| 20 to 24 Years | 399 (75.9%) | 9 (2.3%) |
| 25 to 29 Years | 363 (53.1%) | 42 (11.6%) |
| 30 to 34 Years | 486 (64.1%) | 11 (2.3%) |
| 35 to 44 Years | 653 (55.4%) | 20 (3.1%) |
| 45 to 54 Years | 915 (63.0%) | 40 (4.4%) |
| 55 to 59 Years | 485 (57.1%) | 0 (0.0%) |
| 60 to 64 Years | 231 (42.5%) | 13 (5.6%) |
| 65 to 74 Years | 229 (22.9%) | 0 (0.0%) |
| 75 Years and over | 31 (3.8%) | 0 (0.0%) |
| Total | 4,060 (49.9%) | 211 (5.2%) |
Employment Status by Educational Attainment in Berlin
According to labor force statistics for Berlin, 57.3% of individuals (3,131) out of the total population between 25 and 64 years of age (5,465) are in the labor force, with 4.0% or 125 of them being unemployed. The group with the highest labor force participation rate are those with the educational attainment of bachelor's degree or higher, with 80.8% or 736 individuals in the labor force. Within the labor force, individuals with high school diploma education have the highest percentage of unemployment, with 8.0% or 75 of them being unemployed.
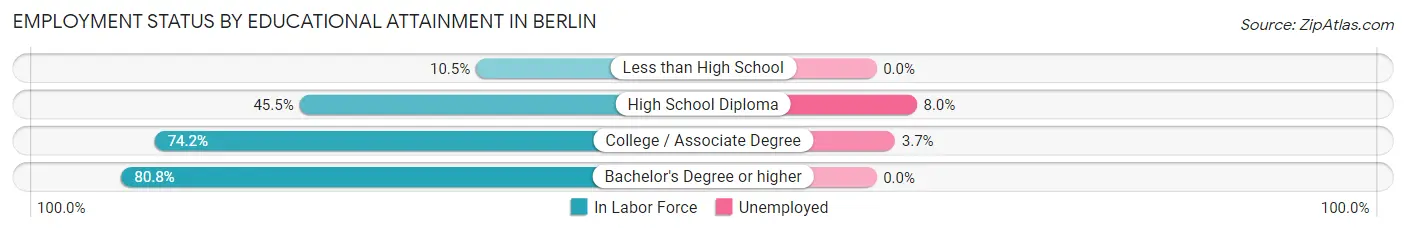
| Educational Attainment | In Labor Force | Unemployed |
| Less than High School | 64 (10.5%) | 0 (0.0%) |
| High School Diploma | 940 (45.5%) | 165 (8.0%) |
| College / Associate Degree | 1,393 (74.2%) | 69 (3.7%) |
| Bachelor's Degree or higher | 736 (80.8%) | 0 (0.0%) |
| Total | 3,131 (57.3%) | 219 (4.0%) |
Employment Occupations by Sex in Berlin
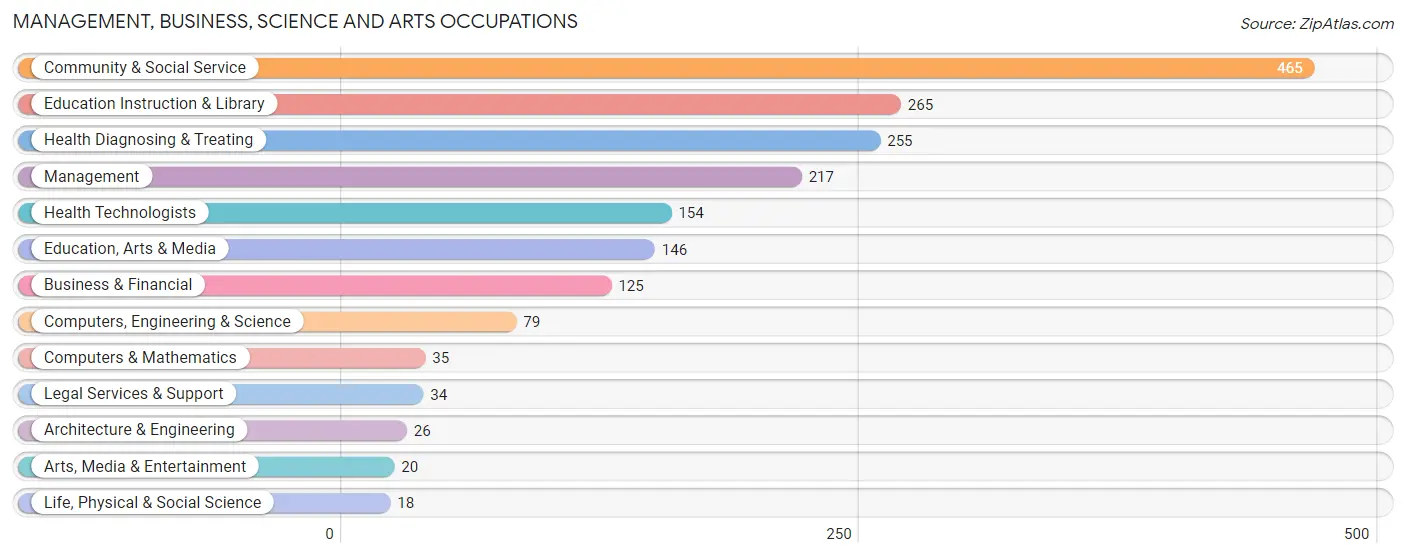
Management, Business, Science and Arts Occupations
The most common Management, Business, Science and Arts occupations in Berlin are Community & Social Service (465 | 12.1%), Education Instruction & Library (265 | 6.9%), Health Diagnosing & Treating (255 | 6.6%), Management (217 | 5.6%), and Health Technologists (154 | 4.0%).
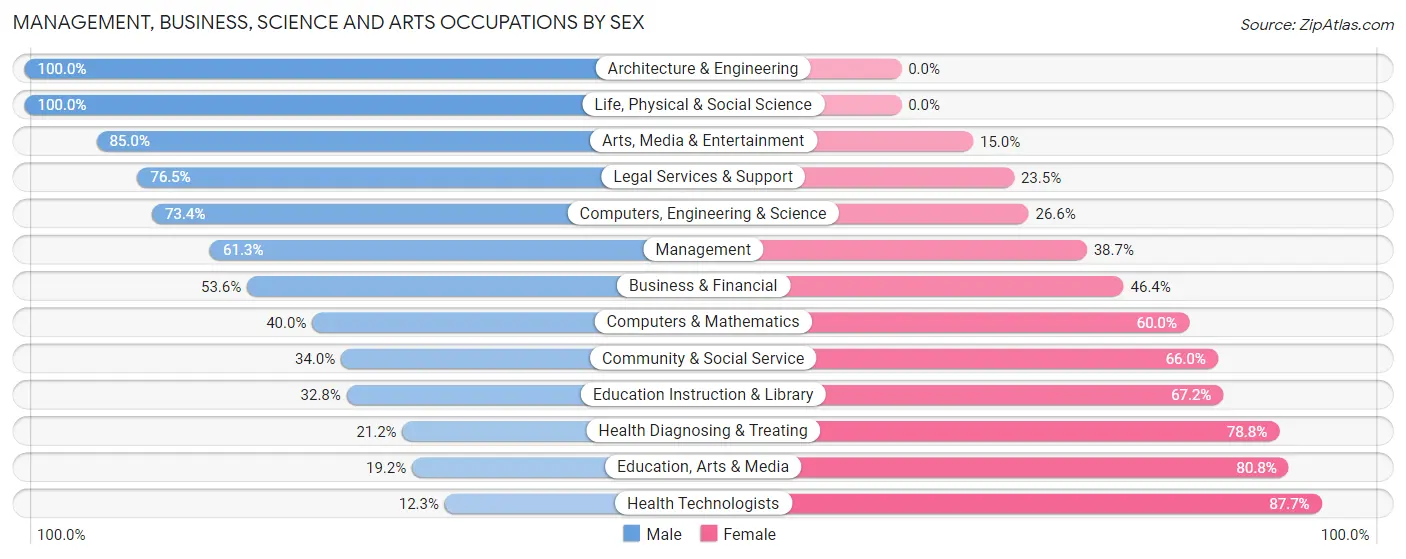
Management, Business, Science and Arts Occupations by Sex
Within the Management, Business, Science and Arts occupations in Berlin, the most male-oriented occupations are Architecture & Engineering (100.0%), Life, Physical & Social Science (100.0%), and Arts, Media & Entertainment (85.0%), while the most female-oriented occupations are Health Technologists (87.7%), Education, Arts & Media (80.8%), and Health Diagnosing & Treating (78.8%).
| Occupation | Male | Female |
| Management | 133 (61.3%) | 84 (38.7%) |
| Business & Financial | 67 (53.6%) | 58 (46.4%) |
| Computers, Engineering & Science | 58 (73.4%) | 21 (26.6%) |
| Computers & Mathematics | 14 (40.0%) | 21 (60.0%) |
| Architecture & Engineering | 26 (100.0%) | 0 (0.0%) |
| Life, Physical & Social Science | 18 (100.0%) | 0 (0.0%) |
| Community & Social Service | 158 (34.0%) | 307 (66.0%) |
| Education, Arts & Media | 28 (19.2%) | 118 (80.8%) |
| Legal Services & Support | 26 (76.5%) | 8 (23.5%) |
| Education Instruction & Library | 87 (32.8%) | 178 (67.2%) |
| Arts, Media & Entertainment | 17 (85.0%) | 3 (15.0%) |
| Health Diagnosing & Treating | 54 (21.2%) | 201 (78.8%) |
| Health Technologists | 19 (12.3%) | 135 (87.7%) |
| Total (Category) | 470 (41.2%) | 671 (58.8%) |
| Total (Overall) | 2,082 (54.1%) | 1,767 (45.9%) |
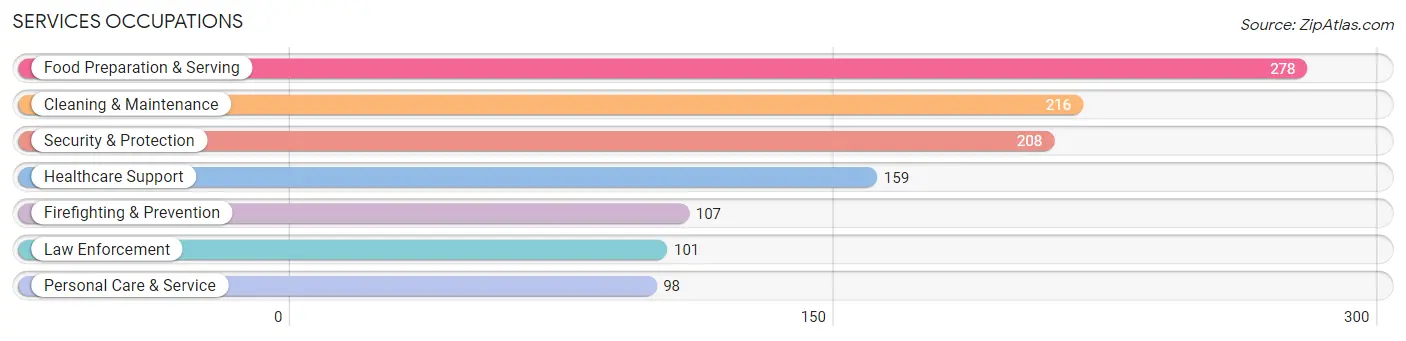
Services Occupations
The most common Services occupations in Berlin are Food Preparation & Serving (278 | 7.2%), Cleaning & Maintenance (216 | 5.6%), Security & Protection (208 | 5.4%), Healthcare Support (159 | 4.1%), and Firefighting & Prevention (107 | 2.8%).
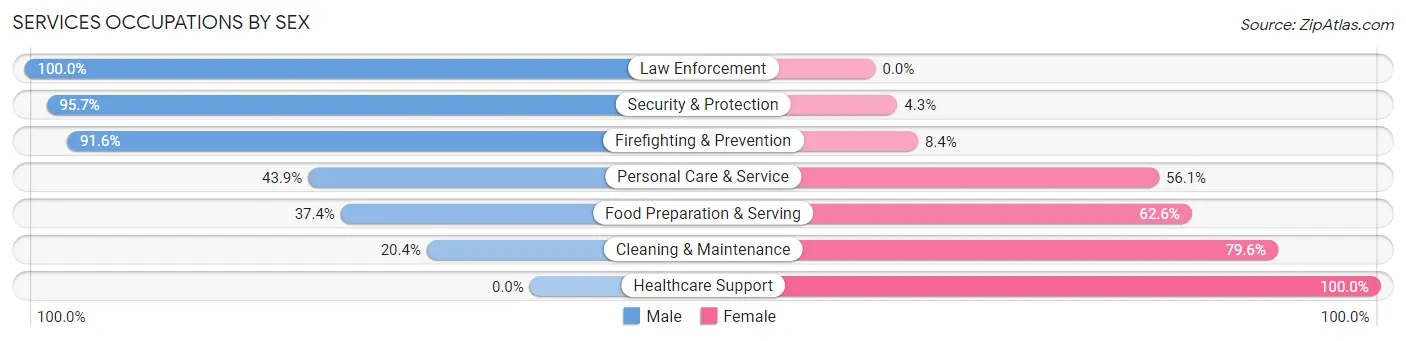
Services Occupations by Sex
Within the Services occupations in Berlin, the most male-oriented occupations are Law Enforcement (100.0%), Security & Protection (95.7%), and Firefighting & Prevention (91.6%), while the most female-oriented occupations are Healthcare Support (100.0%), Cleaning & Maintenance (79.6%), and Food Preparation & Serving (62.6%).
| Occupation | Male | Female |
| Healthcare Support | 0 (0.0%) | 159 (100.0%) |
| Security & Protection | 199 (95.7%) | 9 (4.3%) |
| Firefighting & Prevention | 98 (91.6%) | 9 (8.4%) |
| Law Enforcement | 101 (100.0%) | 0 (0.0%) |
| Food Preparation & Serving | 104 (37.4%) | 174 (62.6%) |
| Cleaning & Maintenance | 44 (20.4%) | 172 (79.6%) |
| Personal Care & Service | 43 (43.9%) | 55 (56.1%) |
| Total (Category) | 390 (40.7%) | 569 (59.3%) |
| Total (Overall) | 2,082 (54.1%) | 1,767 (45.9%) |
Sales and Office Occupations
The most common Sales and Office occupations in Berlin are Sales & Related (475 | 12.3%), and Office & Administration (350 | 9.1%).
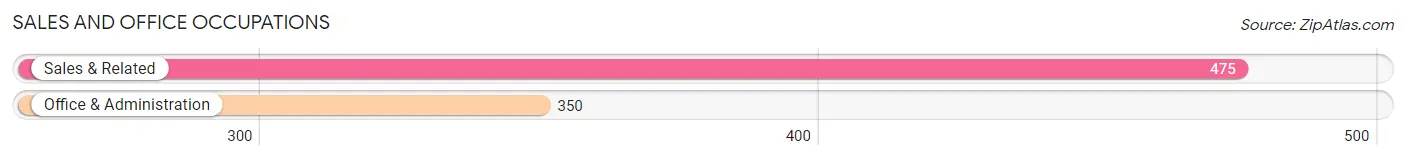
Sales and Office Occupations by Sex

| Occupation | Male | Female |
| Sales & Related | 268 (56.4%) | 207 (43.6%) |
| Office & Administration | 60 (17.1%) | 290 (82.9%) |
| Total (Category) | 328 (39.8%) | 497 (60.2%) |
| Total (Overall) | 2,082 (54.1%) | 1,767 (45.9%) |
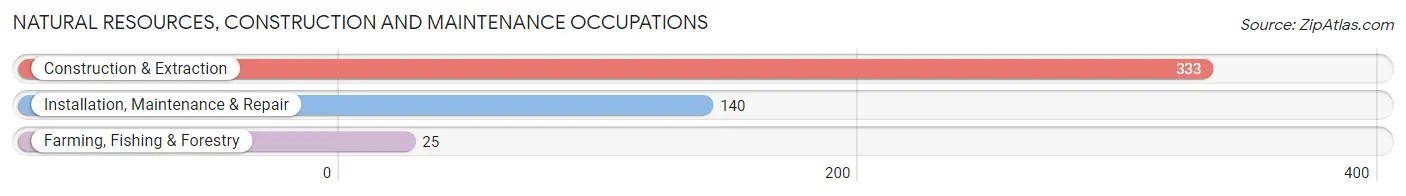
Natural Resources, Construction and Maintenance Occupations
The most common Natural Resources, Construction and Maintenance occupations in Berlin are Construction & Extraction (333 | 8.6%), Installation, Maintenance & Repair (140 | 3.6%), and Farming, Fishing & Forestry (25 | 0.6%).
Natural Resources, Construction and Maintenance Occupations by Sex
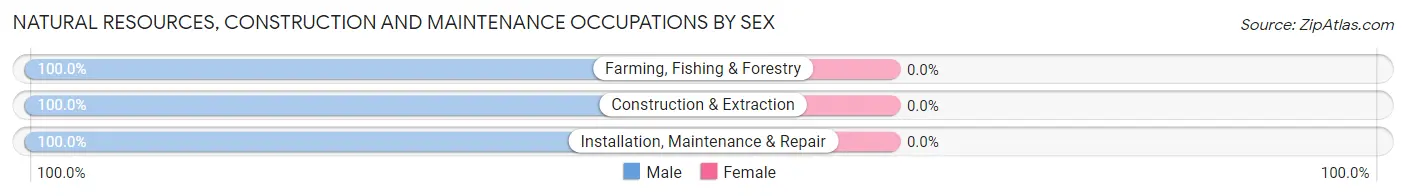
| Occupation | Male | Female |
| Farming, Fishing & Forestry | 25 (100.0%) | 0 (0.0%) |
| Construction & Extraction | 333 (100.0%) | 0 (0.0%) |
| Installation, Maintenance & Repair | 140 (100.0%) | 0 (0.0%) |
| Total (Category) | 498 (100.0%) | 0 (0.0%) |
| Total (Overall) | 2,082 (54.1%) | 1,767 (45.9%) |
Production, Transportation and Moving Occupations
The most common Production, Transportation and Moving occupations in Berlin are Production (228 | 5.9%), Material Moving (139 | 3.6%), and Transportation (59 | 1.5%).
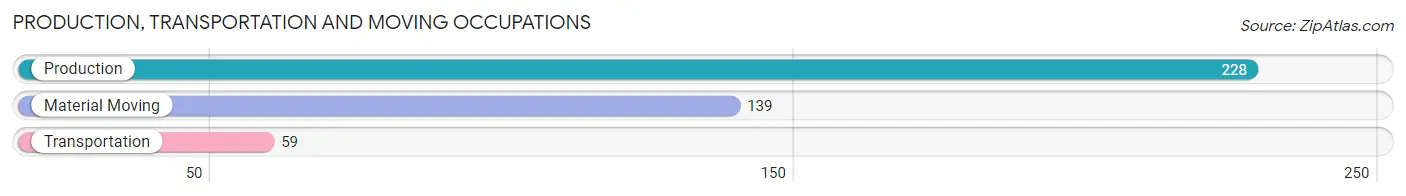
Production, Transportation and Moving Occupations by Sex
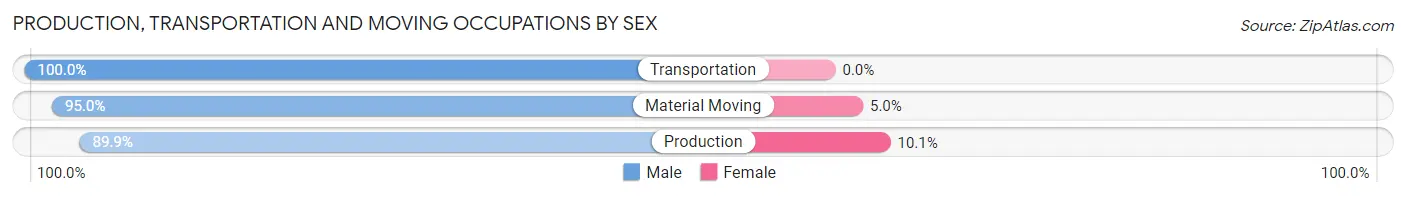
| Occupation | Male | Female |
| Production | 205 (89.9%) | 23 (10.1%) |
| Transportation | 59 (100.0%) | 0 (0.0%) |
| Material Moving | 132 (95.0%) | 7 (5.0%) |
| Total (Category) | 396 (93.0%) | 30 (7.0%) |
| Total (Overall) | 2,082 (54.1%) | 1,767 (45.9%) |
Employment Industries by Sex in Berlin
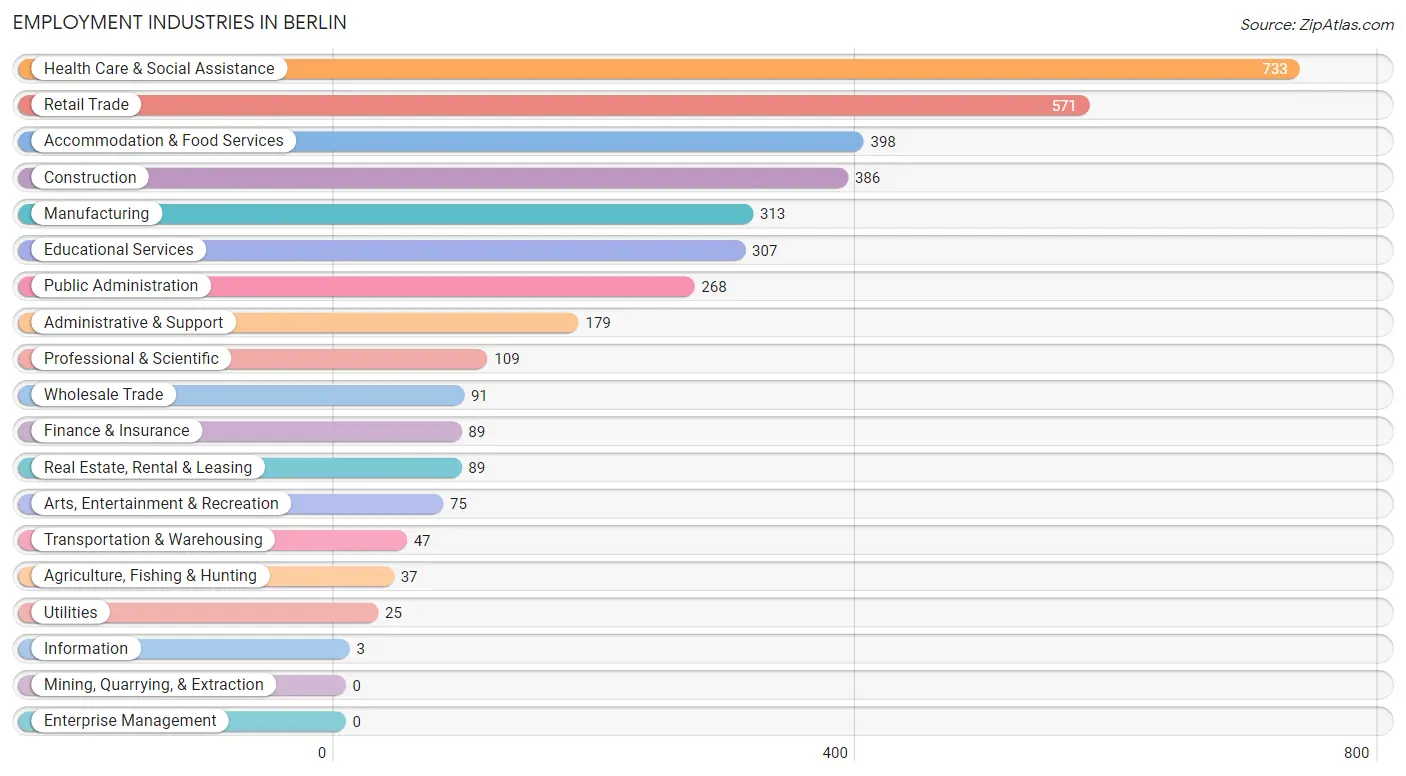
Employment Industries in Berlin
The major employment industries in Berlin include Health Care & Social Assistance (733 | 19.0%), Retail Trade (571 | 14.8%), Accommodation & Food Services (398 | 10.3%), Construction (386 | 10.0%), and Manufacturing (313 | 8.1%).
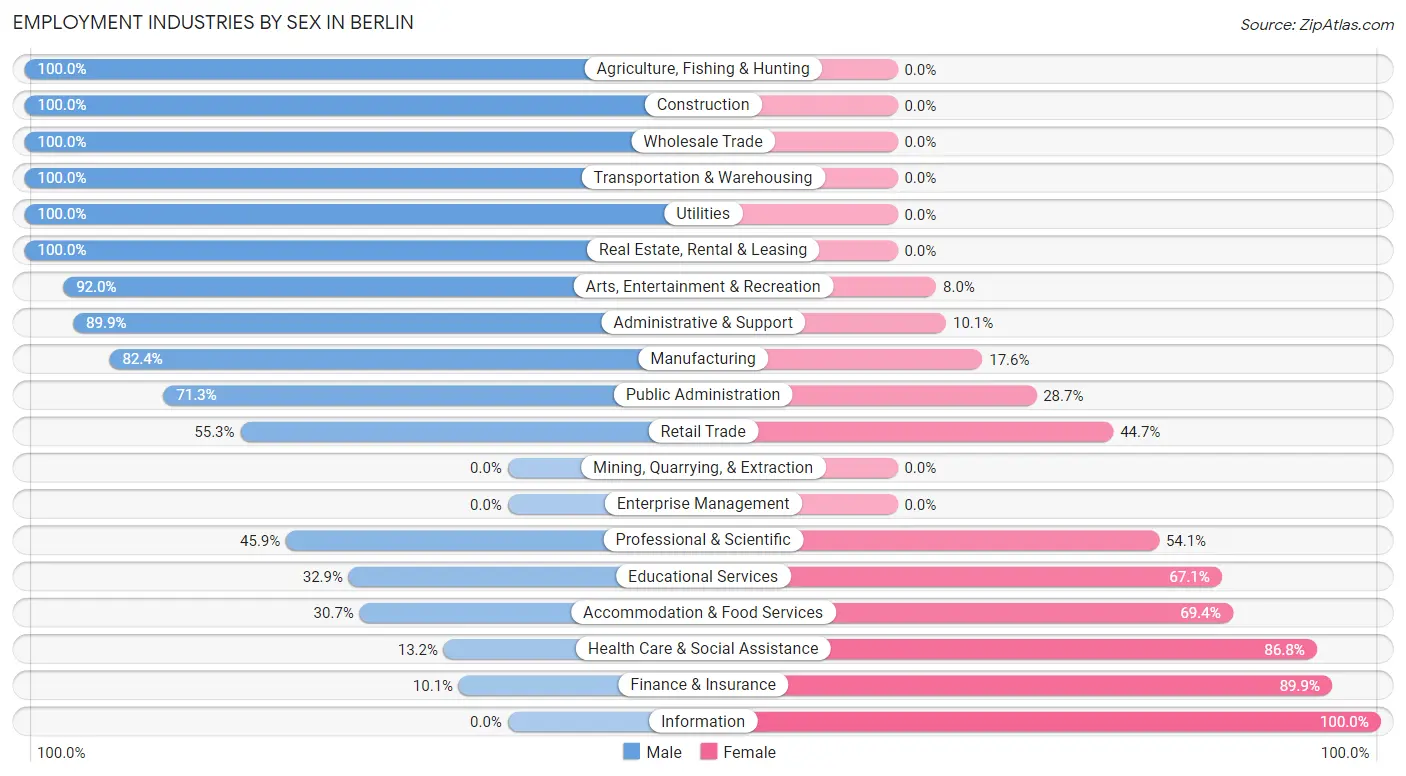
Employment Industries by Sex in Berlin
The Berlin industries that see more men than women are Agriculture, Fishing & Hunting (100.0%), Construction (100.0%), and Wholesale Trade (100.0%), whereas the industries that tend to have a higher number of women are Information (100.0%), Finance & Insurance (89.9%), and Health Care & Social Assistance (86.8%).
| Industry | Male | Female |
| Agriculture, Fishing & Hunting | 37 (100.0%) | 0 (0.0%) |
| Mining, Quarrying, & Extraction | 0 (0.0%) | 0 (0.0%) |
| Construction | 386 (100.0%) | 0 (0.0%) |
| Manufacturing | 258 (82.4%) | 55 (17.6%) |
| Wholesale Trade | 91 (100.0%) | 0 (0.0%) |
| Retail Trade | 316 (55.3%) | 255 (44.7%) |
| Transportation & Warehousing | 47 (100.0%) | 0 (0.0%) |
| Utilities | 25 (100.0%) | 0 (0.0%) |
| Information | 0 (0.0%) | 3 (100.0%) |
| Finance & Insurance | 9 (10.1%) | 80 (89.9%) |
| Real Estate, Rental & Leasing | 89 (100.0%) | 0 (0.0%) |
| Professional & Scientific | 50 (45.9%) | 59 (54.1%) |
| Enterprise Management | 0 (0.0%) | 0 (0.0%) |
| Administrative & Support | 161 (89.9%) | 18 (10.1%) |
| Educational Services | 101 (32.9%) | 206 (67.1%) |
| Health Care & Social Assistance | 97 (13.2%) | 636 (86.8%) |
| Arts, Entertainment & Recreation | 69 (92.0%) | 6 (8.0%) |
| Accommodation & Food Services | 122 (30.6%) | 276 (69.4%) |
| Public Administration | 191 (71.3%) | 77 (28.7%) |
| Total | 2,082 (54.1%) | 1,767 (45.9%) |
Education in Berlin
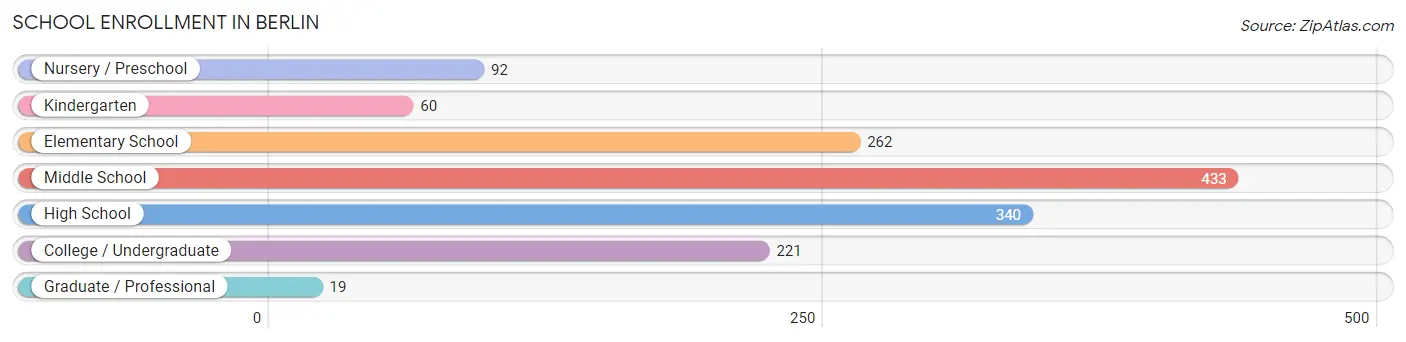
School Enrollment in Berlin
The most common levels of schooling among the 1,427 students in Berlin are middle school (433 | 30.3%), high school (340 | 23.8%), and elementary school (262 | 18.4%).
| School Level | # Students | % Students |
| Nursery / Preschool | 92 | 6.5% |
| Kindergarten | 60 | 4.2% |
| Elementary School | 262 | 18.4% |
| Middle School | 433 | 30.3% |
| High School | 340 | 23.8% |
| College / Undergraduate | 221 | 15.5% |
| Graduate / Professional | 19 | 1.3% |
| Total | 1,427 | 100.0% |
School Enrollment by Age by Funding Source in Berlin
Out of a total of 1,427 students who are enrolled in schools in Berlin, 195 (13.7%) attend a private institution, while the remaining 1,232 (86.3%) are enrolled in public schools. The age group of 3 to 4 year olds has the highest likelihood of being enrolled in private schools, with 44 (47.8% in the age bracket) enrolled. Conversely, the age group of 15 to 17 year olds has the lowest likelihood of being enrolled in a private school, with 258 (100.0% in the age bracket) attending a public institution.
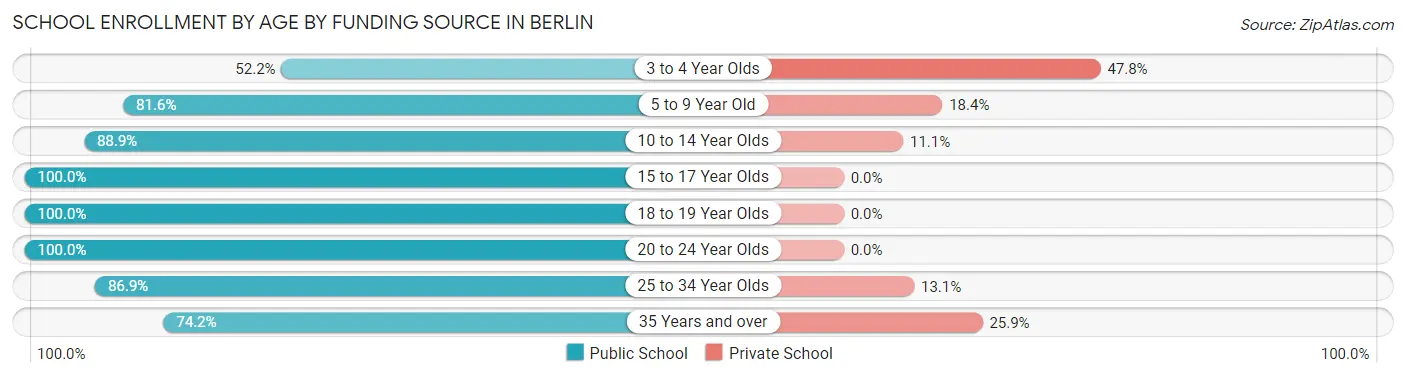
| Age Bracket | Public School | Private School |
| 3 to 4 Year Olds | 48 (52.2%) | 44 (47.8%) |
| 5 to 9 Year Old | 249 (81.6%) | 56 (18.4%) |
| 10 to 14 Year Olds | 402 (88.9%) | 50 (11.1%) |
| 15 to 17 Year Olds | 258 (100.0%) | 0 (0.0%) |
| 18 to 19 Year Olds | 21 (100.0%) | 0 (0.0%) |
| 20 to 24 Year Olds | 91 (100.0%) | 0 (0.0%) |
| 25 to 34 Year Olds | 53 (86.9%) | 8 (13.1%) |
| 35 Years and over | 109 (74.2%) | 38 (25.9%) |
| Total | 1,232 (86.3%) | 195 (13.7%) |
Educational Attainment by Field of Study in Berlin
Business (328 | 27.7%), education (175 | 14.8%), arts & humanities (147 | 12.4%), communications (86 | 7.3%), and science & technology (85 | 7.2%) are the most common fields of study among 1,184 individuals in Berlin who have obtained a bachelor's degree or higher.
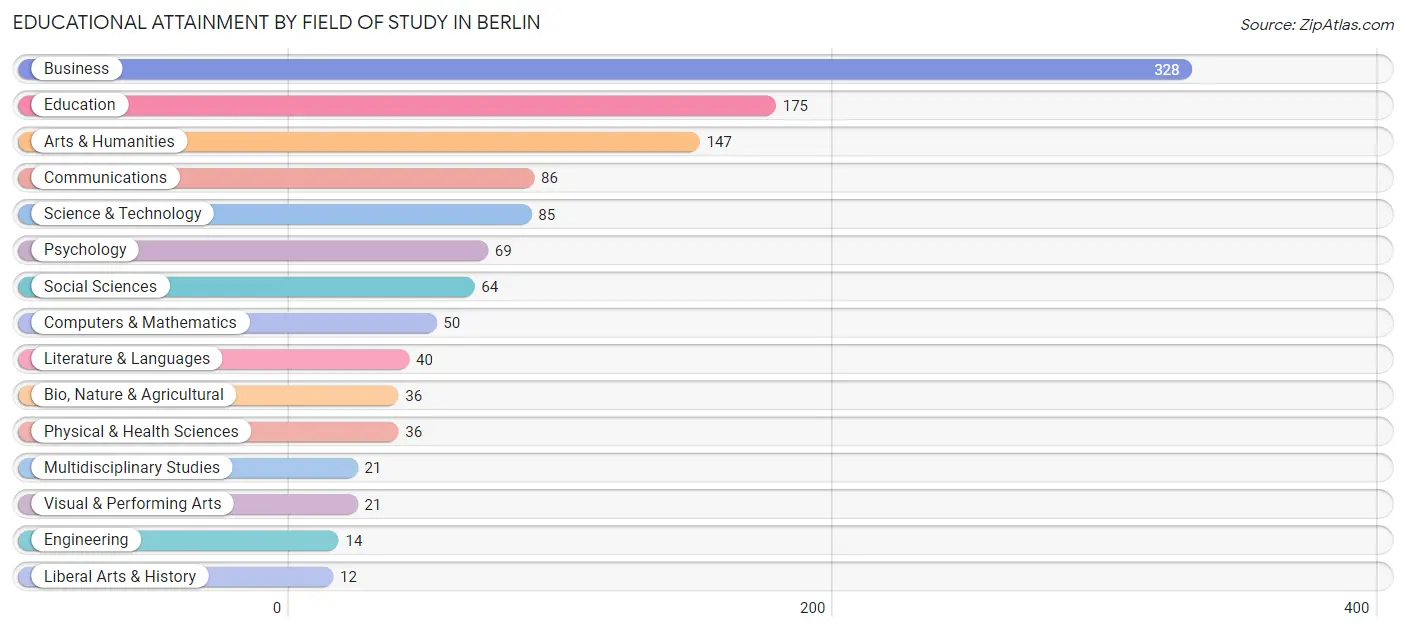
| Field of Study | # Graduates | % Graduates |
| Computers & Mathematics | 50 | 4.2% |
| Bio, Nature & Agricultural | 36 | 3.0% |
| Physical & Health Sciences | 36 | 3.0% |
| Psychology | 69 | 5.8% |
| Social Sciences | 64 | 5.4% |
| Engineering | 14 | 1.2% |
| Multidisciplinary Studies | 21 | 1.8% |
| Science & Technology | 85 | 7.2% |
| Business | 328 | 27.7% |
| Education | 175 | 14.8% |
| Literature & Languages | 40 | 3.4% |
| Liberal Arts & History | 12 | 1.0% |
| Visual & Performing Arts | 21 | 1.8% |
| Communications | 86 | 7.3% |
| Arts & Humanities | 147 | 12.4% |
| Total | 1,184 | 100.0% |
Transportation & Commute in Berlin
Vehicle Availability by Sex in Berlin
The most prevalent vehicle ownership categories in Berlin are males with 2 vehicles (753, accounting for 36.8%) and females with 2 vehicles (748, making up 46.1%).
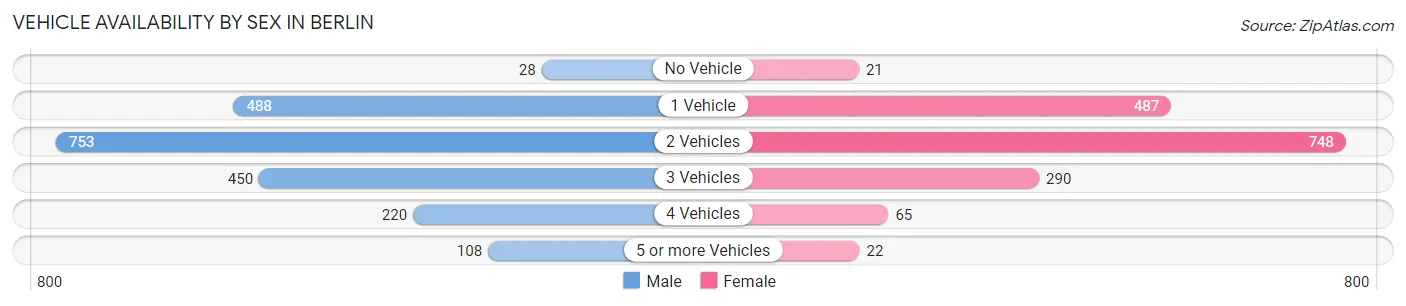
| Vehicles Available | Male | Female |
| No Vehicle | 28 (1.4%) | 21 (1.3%) |
| 1 Vehicle | 488 (23.8%) | 487 (29.8%) |
| 2 Vehicles | 753 (36.8%) | 748 (45.8%) |
| 3 Vehicles | 450 (22.0%) | 290 (17.8%) |
| 4 Vehicles | 220 (10.7%) | 65 (4.0%) |
| 5 or more Vehicles | 108 (5.3%) | 22 (1.3%) |
| Total | 2,047 (100.0%) | 1,633 (100.0%) |
Commute Time in Berlin
The most frequently occuring commute durations in Berlin are 5 to 9 minutes (984 commuters, 28.0%), 10 to 14 minutes (808 commuters, 23.0%), and 15 to 19 minutes (480 commuters, 13.7%).
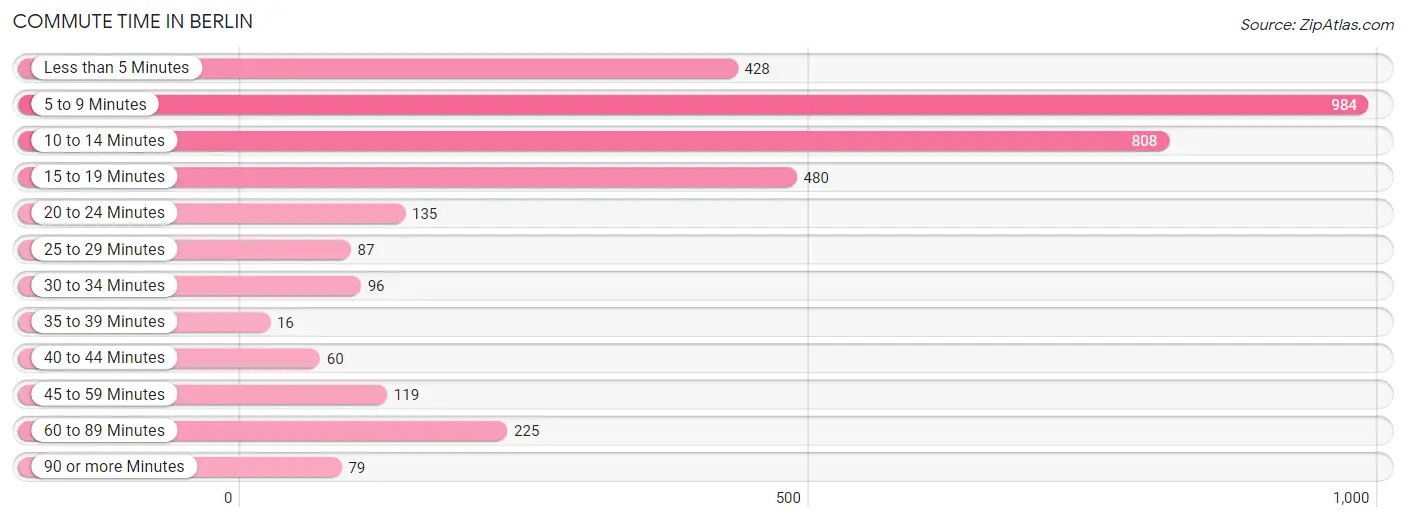
| Commute Time | # Commuters | % Commuters |
| Less than 5 Minutes | 428 | 12.2% |
| 5 to 9 Minutes | 984 | 28.0% |
| 10 to 14 Minutes | 808 | 23.0% |
| 15 to 19 Minutes | 480 | 13.7% |
| 20 to 24 Minutes | 135 | 3.8% |
| 25 to 29 Minutes | 87 | 2.5% |
| 30 to 34 Minutes | 96 | 2.7% |
| 35 to 39 Minutes | 16 | 0.4% |
| 40 to 44 Minutes | 60 | 1.7% |
| 45 to 59 Minutes | 119 | 3.4% |
| 60 to 89 Minutes | 225 | 6.4% |
| 90 or more Minutes | 79 | 2.2% |
Commute Time by Sex in Berlin
The most common commute times in Berlin are 10 to 14 minutes (563 commuters, 28.7%) for males and 5 to 9 minutes (634 commuters, 40.8%) for females.
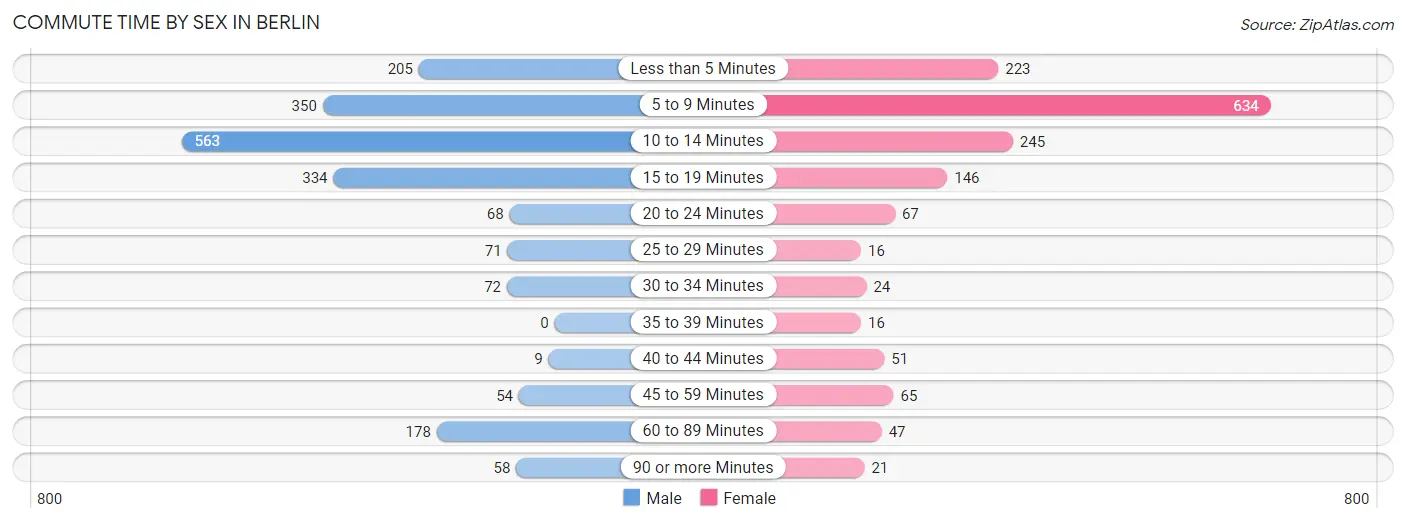
| Commute Time | Male | Female |
| Less than 5 Minutes | 205 (10.4%) | 223 (14.3%) |
| 5 to 9 Minutes | 350 (17.8%) | 634 (40.8%) |
| 10 to 14 Minutes | 563 (28.7%) | 245 (15.8%) |
| 15 to 19 Minutes | 334 (17.0%) | 146 (9.4%) |
| 20 to 24 Minutes | 68 (3.5%) | 67 (4.3%) |
| 25 to 29 Minutes | 71 (3.6%) | 16 (1.0%) |
| 30 to 34 Minutes | 72 (3.7%) | 24 (1.5%) |
| 35 to 39 Minutes | 0 (0.0%) | 16 (1.0%) |
| 40 to 44 Minutes | 9 (0.5%) | 51 (3.3%) |
| 45 to 59 Minutes | 54 (2.8%) | 65 (4.2%) |
| 60 to 89 Minutes | 178 (9.1%) | 47 (3.0%) |
| 90 or more Minutes | 58 (3.0%) | 21 (1.3%) |
Time of Departure to Work by Sex in Berlin
The most frequent times of departure to work in Berlin are 7:30 AM to 7:59 AM (319, 16.3%) for males and 7:30 AM to 7:59 AM (332, 21.3%) for females.
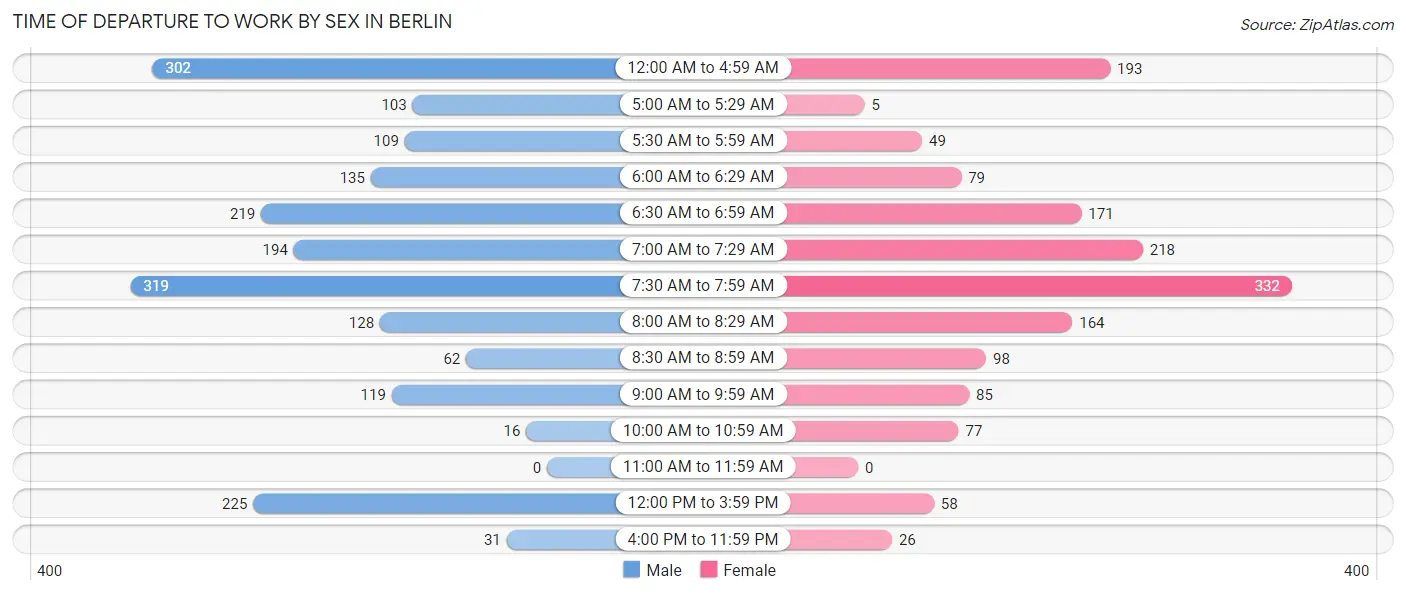
| Time of Departure | Male | Female |
| 12:00 AM to 4:59 AM | 302 (15.4%) | 193 (12.4%) |
| 5:00 AM to 5:29 AM | 103 (5.2%) | 5 (0.3%) |
| 5:30 AM to 5:59 AM | 109 (5.6%) | 49 (3.2%) |
| 6:00 AM to 6:29 AM | 135 (6.9%) | 79 (5.1%) |
| 6:30 AM to 6:59 AM | 219 (11.2%) | 171 (11.0%) |
| 7:00 AM to 7:29 AM | 194 (9.9%) | 218 (14.0%) |
| 7:30 AM to 7:59 AM | 319 (16.3%) | 332 (21.3%) |
| 8:00 AM to 8:29 AM | 128 (6.5%) | 164 (10.5%) |
| 8:30 AM to 8:59 AM | 62 (3.2%) | 98 (6.3%) |
| 9:00 AM to 9:59 AM | 119 (6.1%) | 85 (5.5%) |
| 10:00 AM to 10:59 AM | 16 (0.8%) | 77 (5.0%) |
| 11:00 AM to 11:59 AM | 0 (0.0%) | 0 (0.0%) |
| 12:00 PM to 3:59 PM | 225 (11.5%) | 58 (3.7%) |
| 4:00 PM to 11:59 PM | 31 (1.6%) | 26 (1.7%) |
| Total | 1,962 (100.0%) | 1,555 (100.0%) |
Housing Occupancy in Berlin
Occupancy by Ownership in Berlin
Of the total 3,638 dwellings in Berlin, owner-occupied units account for 2,161 (59.4%), while renter-occupied units make up 1,477 (40.6%).
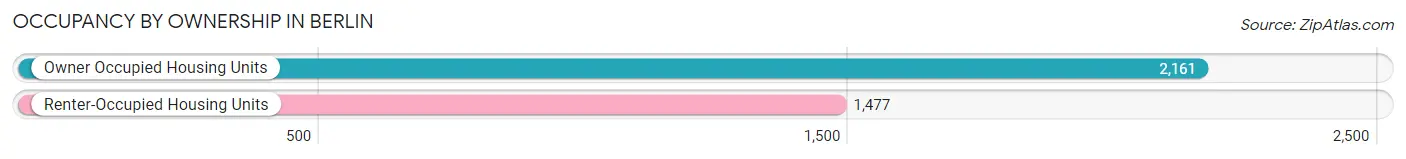
| Occupancy | # Housing Units | % Housing Units |
| Owner Occupied Housing Units | 2,161 | 59.4% |
| Renter-Occupied Housing Units | 1,477 | 40.6% |
| Total Occupied Housing Units | 3,638 | 100.0% |
Occupancy by Household Size in Berlin
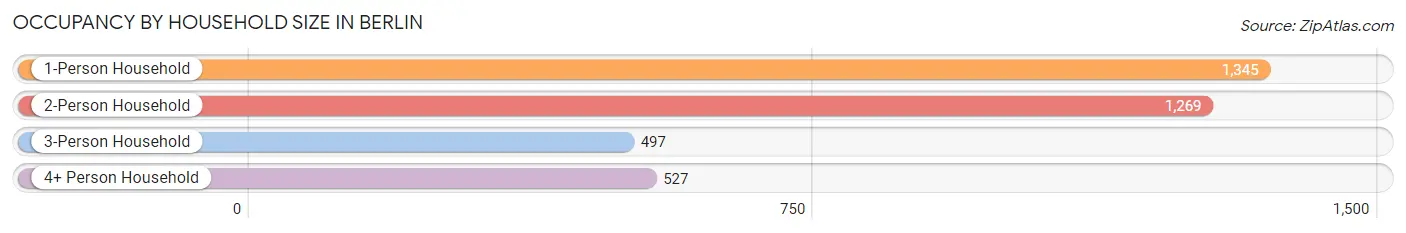
| Household Size | # Housing Units | % Housing Units |
| 1-Person Household | 1,345 | 37.0% |
| 2-Person Household | 1,269 | 34.9% |
| 3-Person Household | 497 | 13.7% |
| 4+ Person Household | 527 | 14.5% |
| Total Housing Units | 3,638 | 100.0% |
Occupancy by Ownership by Household Size in Berlin
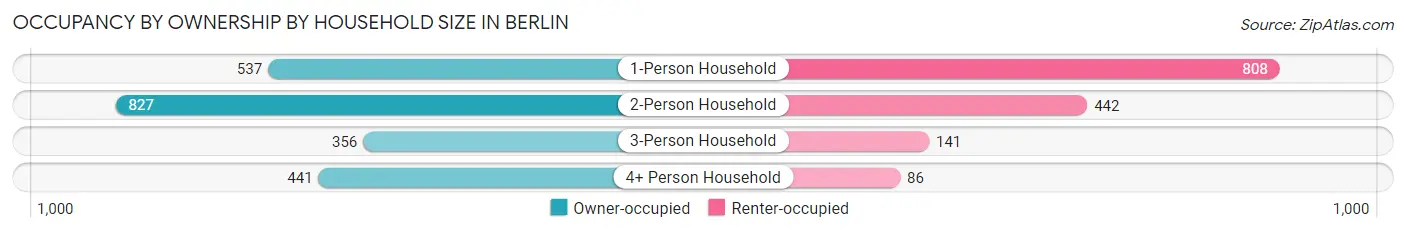
| Household Size | Owner-occupied | Renter-occupied |
| 1-Person Household | 537 (39.9%) | 808 (60.1%) |
| 2-Person Household | 827 (65.2%) | 442 (34.8%) |
| 3-Person Household | 356 (71.6%) | 141 (28.4%) |
| 4+ Person Household | 441 (83.7%) | 86 (16.3%) |
| Total Housing Units | 2,161 (59.4%) | 1,477 (40.6%) |
Occupancy by Educational Attainment in Berlin
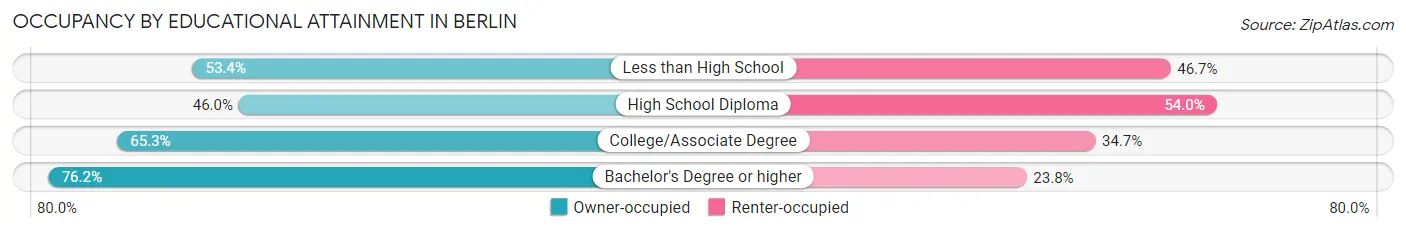
| Household Size | Owner-occupied | Renter-occupied |
| Less than High School | 239 (53.3%) | 209 (46.7%) |
| High School Diploma | 551 (46.0%) | 646 (54.0%) |
| College/Associate Degree | 882 (65.3%) | 469 (34.7%) |
| Bachelor's Degree or higher | 489 (76.2%) | 153 (23.8%) |
Occupancy by Age of Householder in Berlin
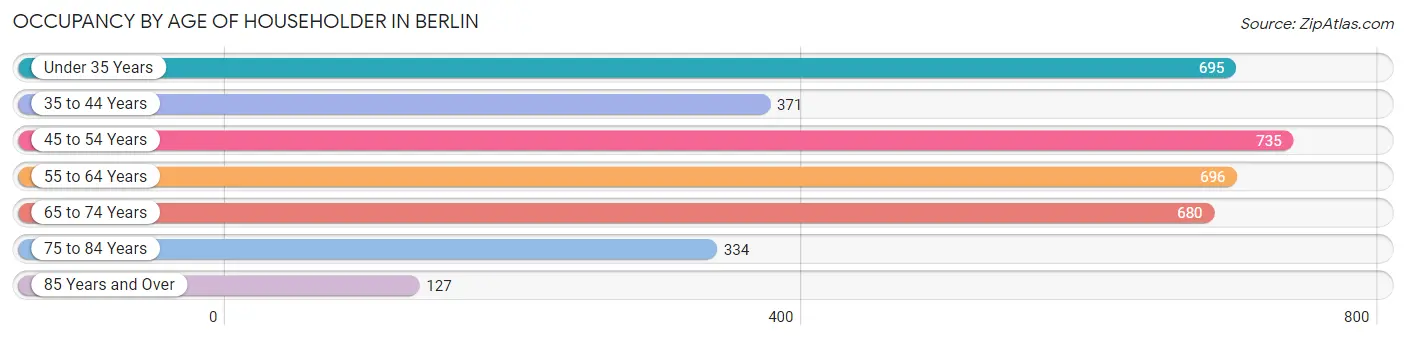
| Age Bracket | # Households | % Households |
| Under 35 Years | 695 | 19.1% |
| 35 to 44 Years | 371 | 10.2% |
| 45 to 54 Years | 735 | 20.2% |
| 55 to 64 Years | 696 | 19.1% |
| 65 to 74 Years | 680 | 18.7% |
| 75 to 84 Years | 334 | 9.2% |
| 85 Years and Over | 127 | 3.5% |
| Total | 3,638 | 100.0% |
Housing Finances in Berlin
Median Income by Occupancy in Berlin
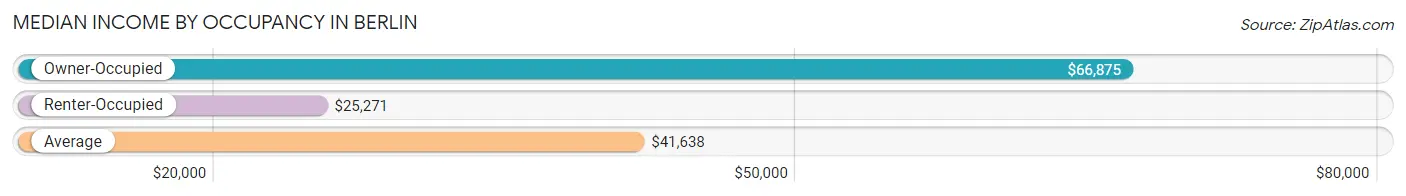
| Occupancy Type | # Households | Median Income |
| Owner-Occupied | 2,161 (59.4%) | $66,875 |
| Renter-Occupied | 1,477 (40.6%) | $25,271 |
| Average | 3,638 (100.0%) | $41,638 |
Occupancy by Householder Income Bracket in Berlin
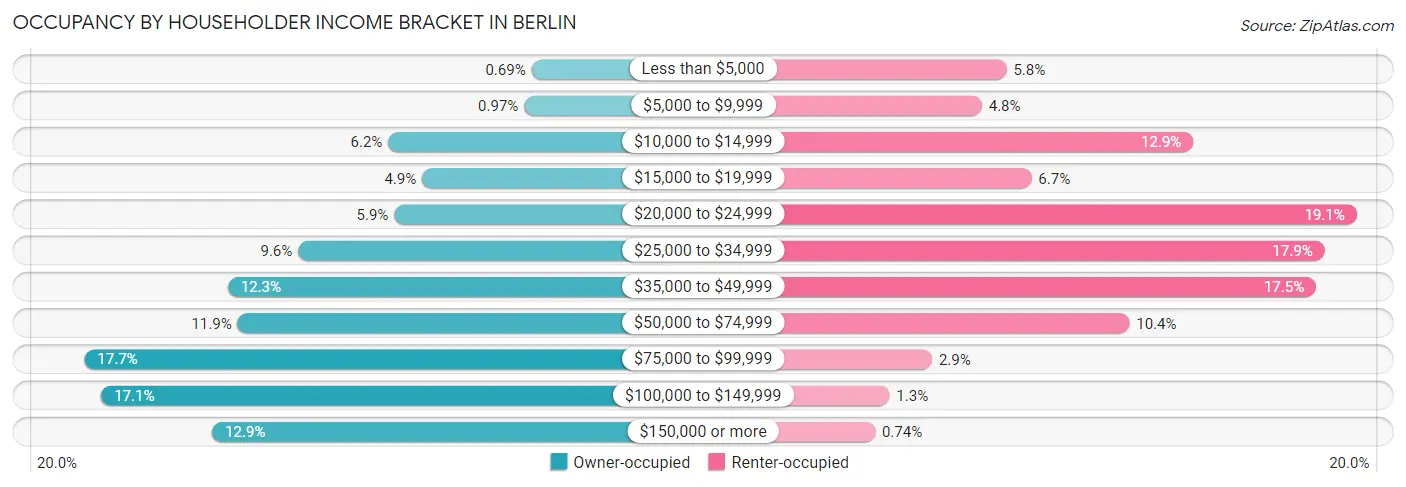
| Income Bracket | Owner-occupied | Renter-occupied |
| Less than $5,000 | 15 (0.7%) | 85 (5.8%) |
| $5,000 to $9,999 | 21 (1.0%) | 71 (4.8%) |
| $10,000 to $14,999 | 133 (6.1%) | 190 (12.9%) |
| $15,000 to $19,999 | 105 (4.9%) | 99 (6.7%) |
| $20,000 to $24,999 | 128 (5.9%) | 282 (19.1%) |
| $25,000 to $34,999 | 207 (9.6%) | 264 (17.9%) |
| $35,000 to $49,999 | 265 (12.3%) | 259 (17.5%) |
| $50,000 to $74,999 | 257 (11.9%) | 154 (10.4%) |
| $75,000 to $99,999 | 383 (17.7%) | 43 (2.9%) |
| $100,000 to $149,999 | 369 (17.1%) | 19 (1.3%) |
| $150,000 or more | 278 (12.9%) | 11 (0.7%) |
| Total | 2,161 (100.0%) | 1,477 (100.0%) |
Monthly Housing Cost Tiers in Berlin
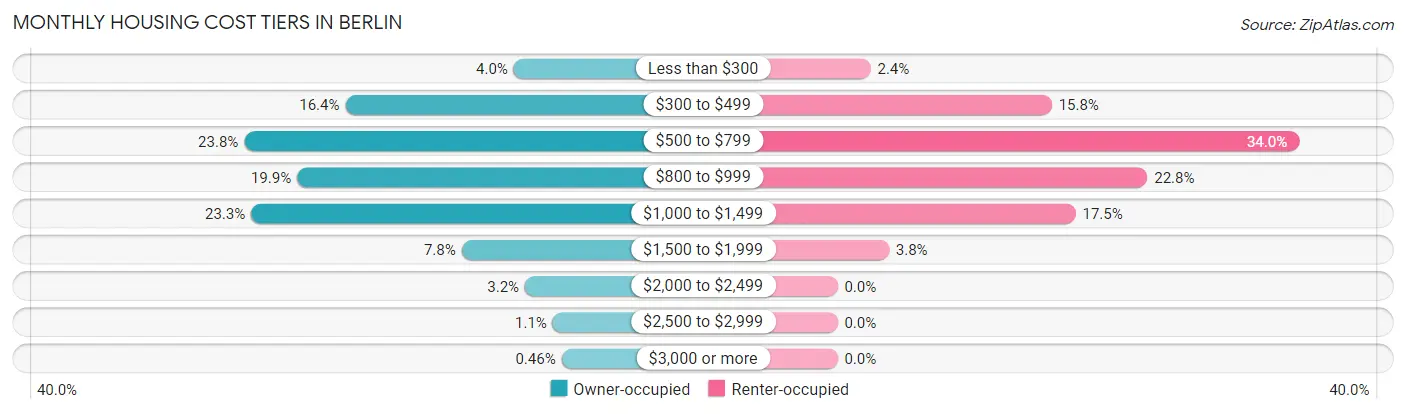
| Monthly Cost | Owner-occupied | Renter-occupied |
| Less than $300 | 86 (4.0%) | 36 (2.4%) |
| $300 to $499 | 354 (16.4%) | 233 (15.8%) |
| $500 to $799 | 515 (23.8%) | 502 (34.0%) |
| $800 to $999 | 431 (19.9%) | 337 (22.8%) |
| $1,000 to $1,499 | 504 (23.3%) | 259 (17.5%) |
| $1,500 to $1,999 | 169 (7.8%) | 56 (3.8%) |
| $2,000 to $2,499 | 68 (3.2%) | 0 (0.0%) |
| $2,500 to $2,999 | 24 (1.1%) | 0 (0.0%) |
| $3,000 or more | 10 (0.5%) | 0 (0.0%) |
| Total | 2,161 (100.0%) | 1,477 (100.0%) |
Physical Housing Characteristics in Berlin
Housing Structures in Berlin
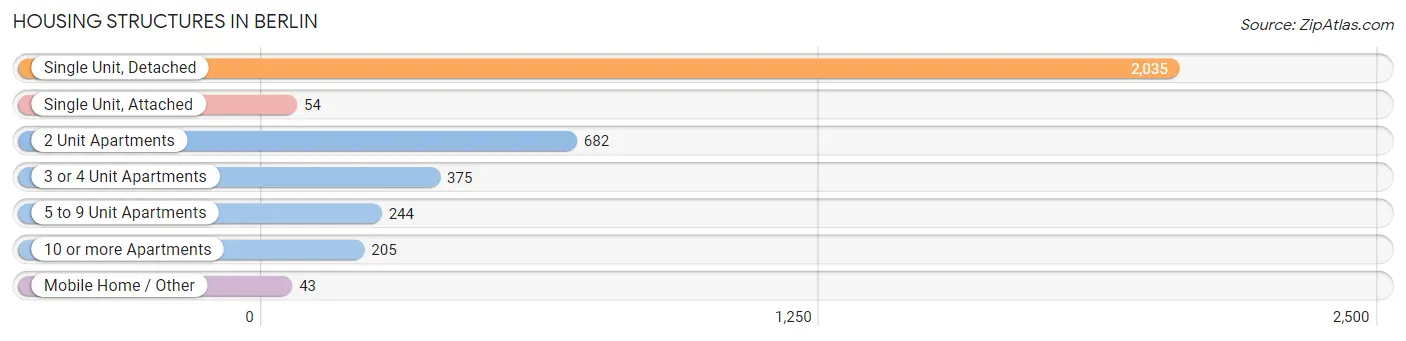
| Structure Type | # Housing Units | % Housing Units |
| Single Unit, Detached | 2,035 | 55.9% |
| Single Unit, Attached | 54 | 1.5% |
| 2 Unit Apartments | 682 | 18.8% |
| 3 or 4 Unit Apartments | 375 | 10.3% |
| 5 to 9 Unit Apartments | 244 | 6.7% |
| 10 or more Apartments | 205 | 5.6% |
| Mobile Home / Other | 43 | 1.2% |
| Total | 3,638 | 100.0% |
Housing Structures by Occupancy in Berlin
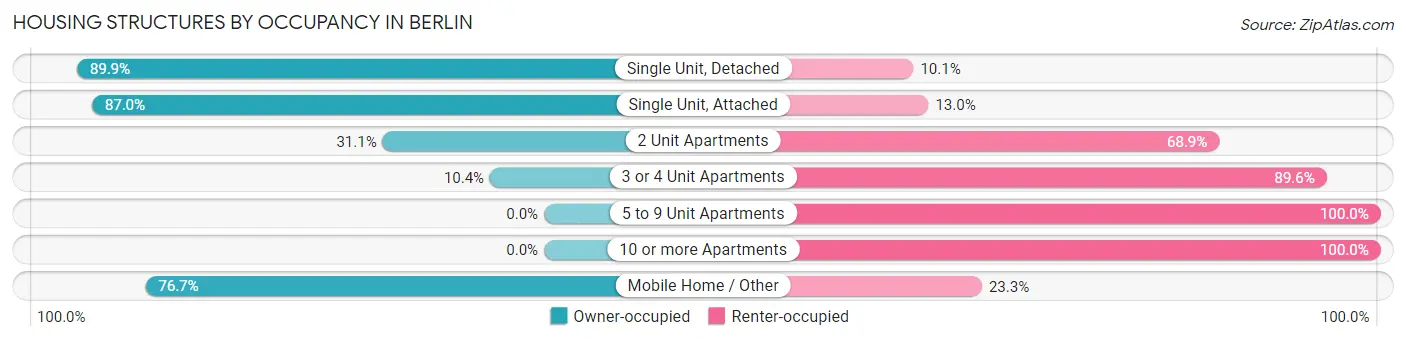
| Structure Type | Owner-occupied | Renter-occupied |
| Single Unit, Detached | 1,830 (89.9%) | 205 (10.1%) |
| Single Unit, Attached | 47 (87.0%) | 7 (13.0%) |
| 2 Unit Apartments | 212 (31.1%) | 470 (68.9%) |
| 3 or 4 Unit Apartments | 39 (10.4%) | 336 (89.6%) |
| 5 to 9 Unit Apartments | 0 (0.0%) | 244 (100.0%) |
| 10 or more Apartments | 0 (0.0%) | 205 (100.0%) |
| Mobile Home / Other | 33 (76.7%) | 10 (23.3%) |
| Total | 2,161 (59.4%) | 1,477 (40.6%) |
Housing Structures by Number of Rooms in Berlin
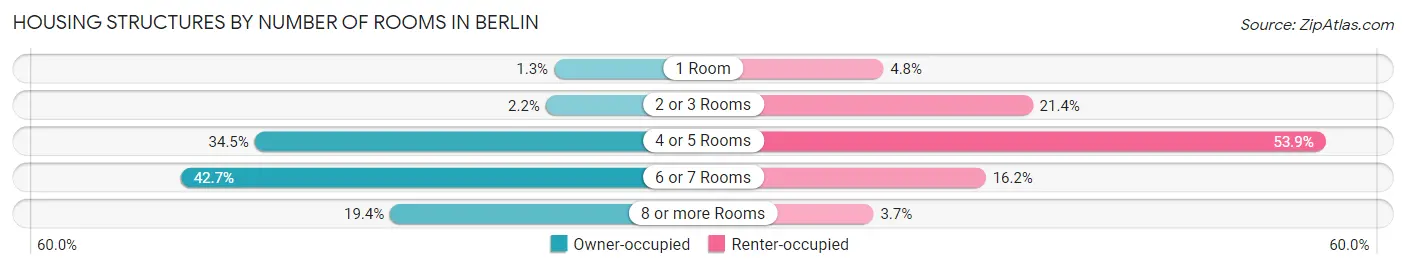
| Number of Rooms | Owner-occupied | Renter-occupied |
| 1 Room | 27 (1.3%) | 71 (4.8%) |
| 2 or 3 Rooms | 47 (2.2%) | 316 (21.4%) |
| 4 or 5 Rooms | 745 (34.5%) | 796 (53.9%) |
| 6 or 7 Rooms | 922 (42.7%) | 239 (16.2%) |
| 8 or more Rooms | 420 (19.4%) | 55 (3.7%) |
| Total | 2,161 (100.0%) | 1,477 (100.0%) |
Housing Structure by Heating Type in Berlin
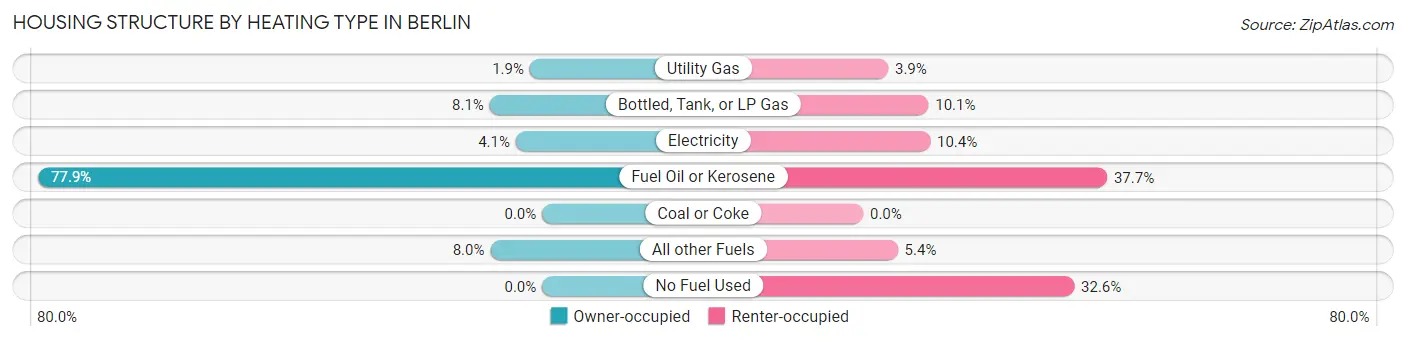
| Heating Type | Owner-occupied | Renter-occupied |
| Utility Gas | 41 (1.9%) | 57 (3.9%) |
| Bottled, Tank, or LP Gas | 175 (8.1%) | 149 (10.1%) |
| Electricity | 88 (4.1%) | 153 (10.4%) |
| Fuel Oil or Kerosene | 1,684 (77.9%) | 557 (37.7%) |
| Coal or Coke | 0 (0.0%) | 0 (0.0%) |
| All other Fuels | 173 (8.0%) | 79 (5.3%) |
| No Fuel Used | 0 (0.0%) | 482 (32.6%) |
| Total | 2,161 (100.0%) | 1,477 (100.0%) |
Household Vehicle Usage in Berlin
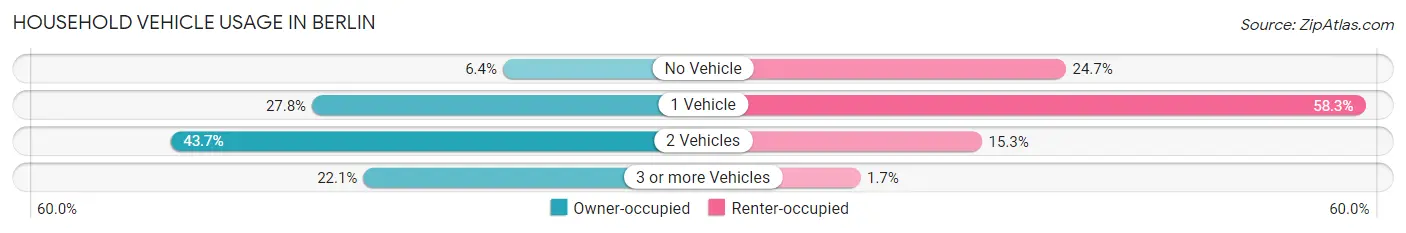
| Vehicles per Household | Owner-occupied | Renter-occupied |
| No Vehicle | 139 (6.4%) | 365 (24.7%) |
| 1 Vehicle | 601 (27.8%) | 861 (58.3%) |
| 2 Vehicles | 944 (43.7%) | 226 (15.3%) |
| 3 or more Vehicles | 477 (22.1%) | 25 (1.7%) |
| Total | 2,161 (100.0%) | 1,477 (100.0%) |
Real Estate & Mortgages in Berlin
Real Estate and Mortgage Overview in Berlin
| Characteristic | Without Mortgage | With Mortgage |
| Housing Units | 1,164 | 997 |
| Median Property Value | $81,400 | $111,000 |
| Median Household Income | $40,690 | $185 |
| Monthly Housing Costs | $565 | $10 |
| Real Estate Taxes | $2,727 | $14 |
Property Value by Mortgage Status in Berlin
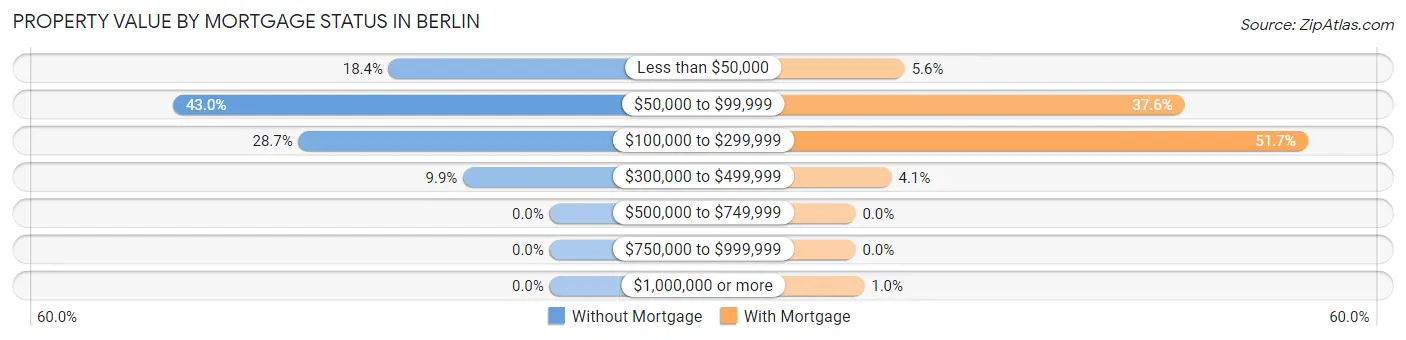
| Property Value | Without Mortgage | With Mortgage |
| Less than $50,000 | 214 (18.4%) | 56 (5.6%) |
| $50,000 to $99,999 | 501 (43.0%) | 375 (37.6%) |
| $100,000 to $299,999 | 334 (28.7%) | 515 (51.6%) |
| $300,000 to $499,999 | 115 (9.9%) | 41 (4.1%) |
| $500,000 to $749,999 | 0 (0.0%) | 0 (0.0%) |
| $750,000 to $999,999 | 0 (0.0%) | 0 (0.0%) |
| $1,000,000 or more | 0 (0.0%) | 10 (1.0%) |
| Total | 1,164 (100.0%) | 997 (100.0%) |
Household Income by Mortgage Status in Berlin
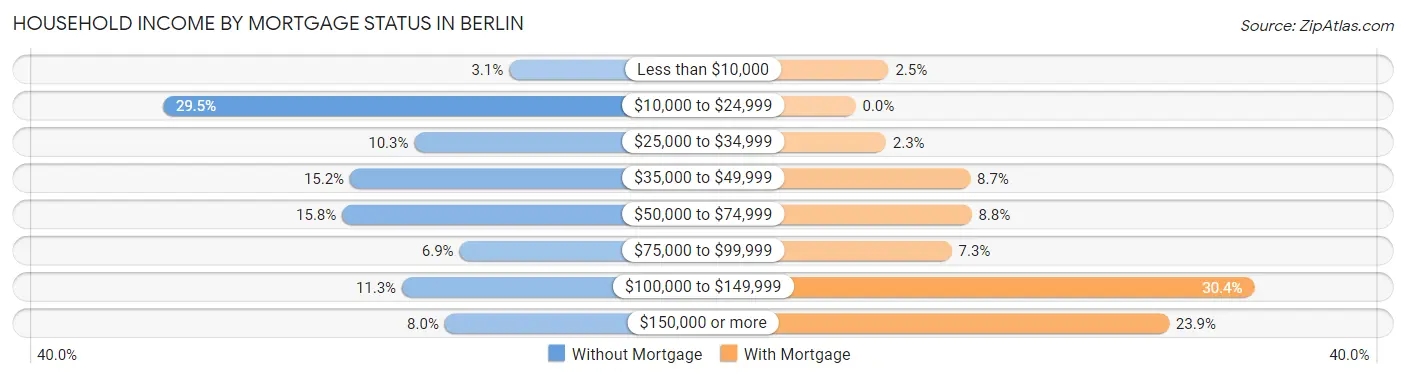
| Household Income | Without Mortgage | With Mortgage |
| Less than $10,000 | 36 (3.1%) | 25 (2.5%) |
| $10,000 to $24,999 | 343 (29.5%) | 0 (0.0%) |
| $25,000 to $34,999 | 120 (10.3%) | 23 (2.3%) |
| $35,000 to $49,999 | 177 (15.2%) | 87 (8.7%) |
| $50,000 to $74,999 | 184 (15.8%) | 88 (8.8%) |
| $75,000 to $99,999 | 80 (6.9%) | 73 (7.3%) |
| $100,000 to $149,999 | 131 (11.3%) | 303 (30.4%) |
| $150,000 or more | 93 (8.0%) | 238 (23.9%) |
| Total | 1,164 (100.0%) | 997 (100.0%) |
Property Value to Household Income Ratio in Berlin
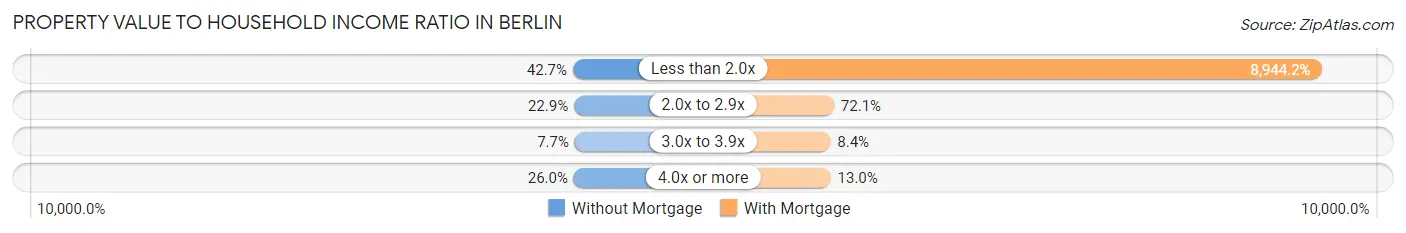
| Value-to-Income Ratio | Without Mortgage | With Mortgage |
| Less than 2.0x | 497 (42.7%) | 89,174 (8,944.2%) |
| 2.0x to 2.9x | 266 (22.9%) | 719 (72.1%) |
| 3.0x to 3.9x | 90 (7.7%) | 84 (8.4%) |
| 4.0x or more | 303 (26.0%) | 130 (13.0%) |
| Total | 1,164 (100.0%) | 997 (100.0%) |
Real Estate Taxes by Mortgage Status in Berlin
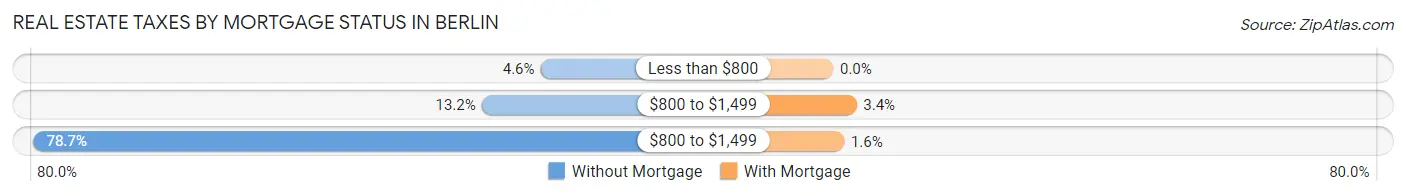
| Property Taxes | Without Mortgage | With Mortgage |
| Less than $800 | 54 (4.6%) | 0 (0.0%) |
| $800 to $1,499 | 154 (13.2%) | 34 (3.4%) |
| $800 to $1,499 | 916 (78.7%) | 16 (1.6%) |
| Total | 1,164 (100.0%) | 997 (100.0%) |
Health & Disability in Berlin
Health Insurance Coverage by Age in Berlin
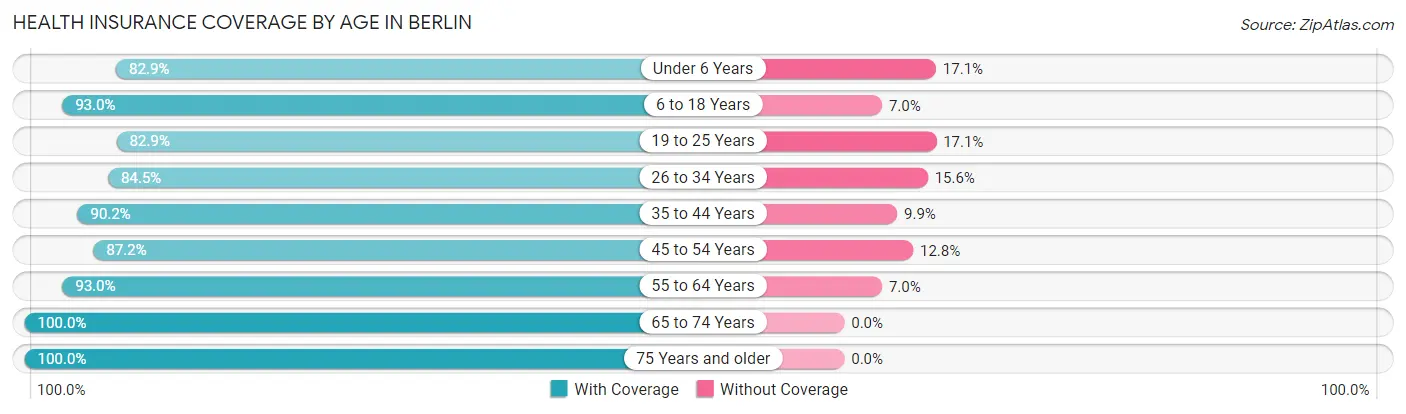
| Age Bracket | With Coverage | Without Coverage |
| Under 6 Years | 403 (82.9%) | 83 (17.1%) |
| 6 to 18 Years | 1,020 (93.0%) | 77 (7.0%) |
| 19 to 25 Years | 522 (82.9%) | 108 (17.1%) |
| 26 to 34 Years | 869 (84.5%) | 160 (15.5%) |
| 35 to 44 Years | 659 (90.1%) | 72 (9.9%) |
| 45 to 54 Years | 993 (87.2%) | 146 (12.8%) |
| 55 to 64 Years | 1,151 (93.0%) | 87 (7.0%) |
| 65 to 74 Years | 973 (100.0%) | 0 (0.0%) |
| 75 Years and older | 661 (100.0%) | 0 (0.0%) |
| Total | 7,251 (90.8%) | 733 (9.2%) |
Health Insurance Coverage by Citizenship Status in Berlin
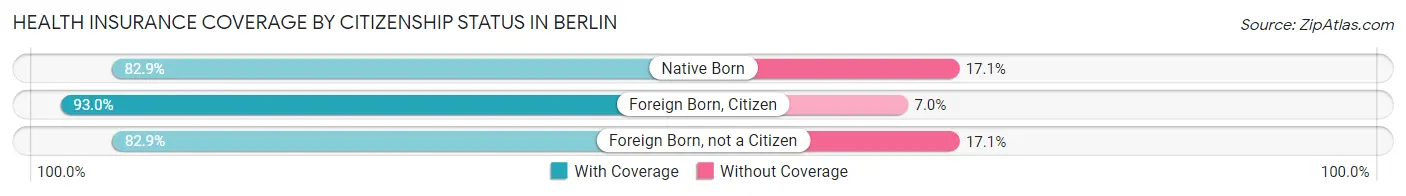
| Citizenship Status | With Coverage | Without Coverage |
| Native Born | 403 (82.9%) | 83 (17.1%) |
| Foreign Born, Citizen | 1,020 (93.0%) | 77 (7.0%) |
| Foreign Born, not a Citizen | 522 (82.9%) | 108 (17.1%) |
Health Insurance Coverage by Household Income in Berlin
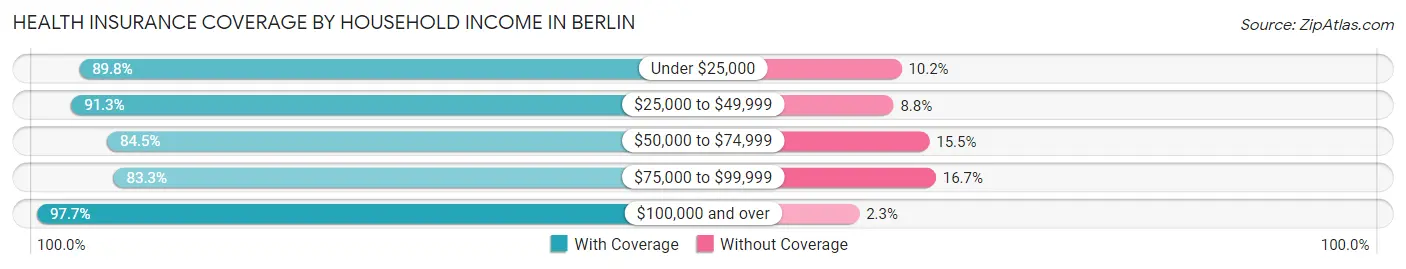
| Household Income | With Coverage | Without Coverage |
| Under $25,000 | 1,446 (89.8%) | 165 (10.2%) |
| $25,000 to $49,999 | 1,721 (91.2%) | 165 (8.7%) |
| $50,000 to $74,999 | 826 (84.5%) | 151 (15.5%) |
| $75,000 to $99,999 | 994 (83.3%) | 199 (16.7%) |
| $100,000 and over | 2,219 (97.7%) | 53 (2.3%) |
Public vs Private Health Insurance Coverage by Age in Berlin
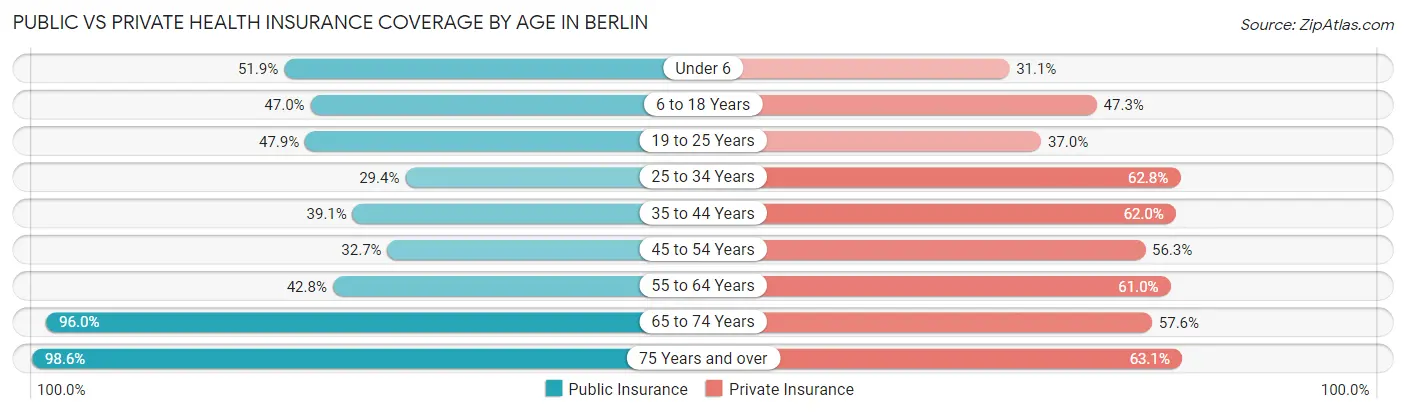
| Age Bracket | Public Insurance | Private Insurance |
| Under 6 | 252 (51.8%) | 151 (31.1%) |
| 6 to 18 Years | 515 (46.9%) | 519 (47.3%) |
| 19 to 25 Years | 302 (47.9%) | 233 (37.0%) |
| 25 to 34 Years | 302 (29.3%) | 646 (62.8%) |
| 35 to 44 Years | 286 (39.1%) | 453 (62.0%) |
| 45 to 54 Years | 372 (32.7%) | 641 (56.3%) |
| 55 to 64 Years | 530 (42.8%) | 755 (61.0%) |
| 65 to 74 Years | 934 (96.0%) | 560 (57.6%) |
| 75 Years and over | 652 (98.6%) | 417 (63.1%) |
| Total | 4,145 (51.9%) | 4,375 (54.8%) |
Disability Status by Sex by Age in Berlin
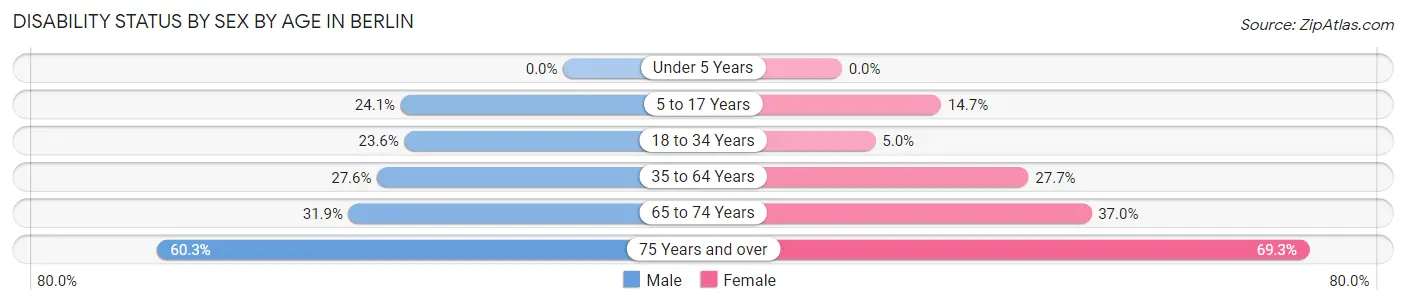
| Age Bracket | Male | Female |
| Under 5 Years | 0 (0.0%) | 0 (0.0%) |
| 5 to 17 Years | 172 (24.1%) | 61 (14.7%) |
| 18 to 34 Years | 235 (23.6%) | 35 (5.0%) |
| 35 to 64 Years | 459 (27.6%) | 401 (27.7%) |
| 65 to 74 Years | 144 (31.9%) | 193 (37.0%) |
| 75 Years and over | 135 (60.3%) | 303 (69.3%) |
Disability Class by Sex by Age in Berlin
Disability Class: Hearing Difficulty
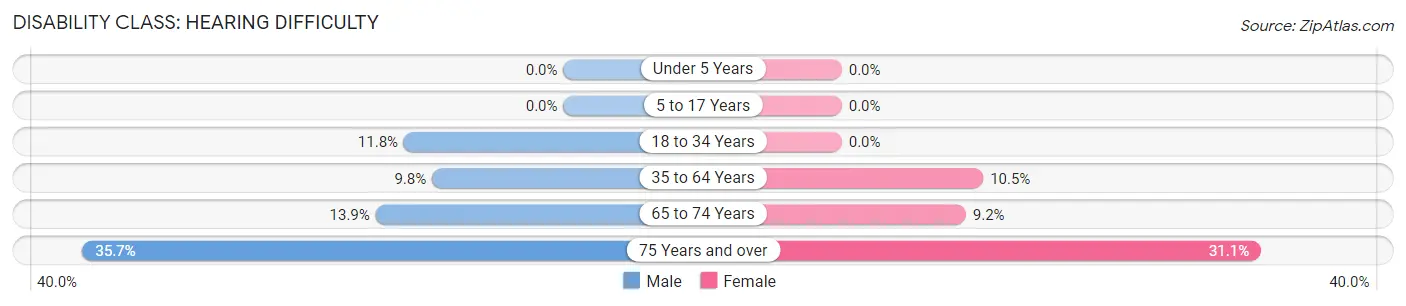
| Age Bracket | Male | Female |
| Under 5 Years | 0 (0.0%) | 0 (0.0%) |
| 5 to 17 Years | 0 (0.0%) | 0 (0.0%) |
| 18 to 34 Years | 118 (11.8%) | 0 (0.0%) |
| 35 to 64 Years | 162 (9.8%) | 152 (10.5%) |
| 65 to 74 Years | 63 (13.9%) | 48 (9.2%) |
| 75 Years and over | 80 (35.7%) | 136 (31.1%) |
Disability Class: Vision Difficulty
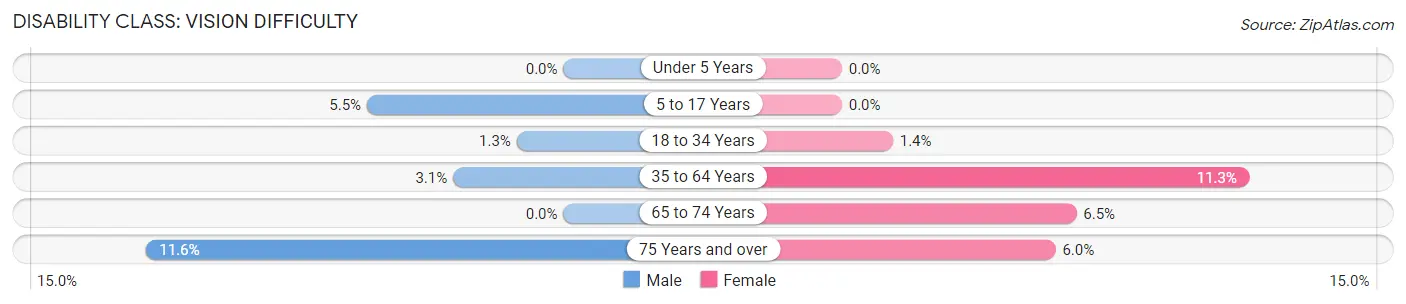
| Age Bracket | Male | Female |
| Under 5 Years | 0 (0.0%) | 0 (0.0%) |
| 5 to 17 Years | 39 (5.5%) | 0 (0.0%) |
| 18 to 34 Years | 13 (1.3%) | 10 (1.4%) |
| 35 to 64 Years | 51 (3.1%) | 164 (11.3%) |
| 65 to 74 Years | 0 (0.0%) | 34 (6.5%) |
| 75 Years and over | 26 (11.6%) | 26 (5.9%) |
Disability Class: Cognitive Difficulty
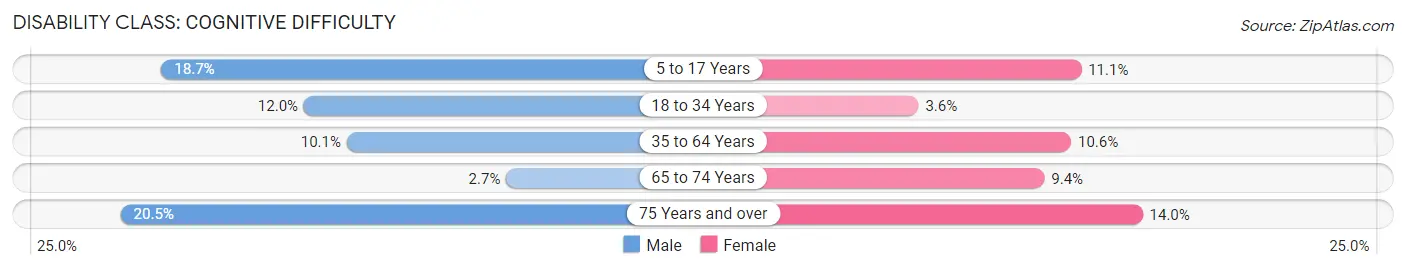
| Age Bracket | Male | Female |
| 5 to 17 Years | 133 (18.6%) | 46 (11.1%) |
| 18 to 34 Years | 120 (12.0%) | 25 (3.6%) |
| 35 to 64 Years | 167 (10.1%) | 154 (10.6%) |
| 65 to 74 Years | 12 (2.6%) | 49 (9.4%) |
| 75 Years and over | 46 (20.5%) | 61 (14.0%) |
Disability Class: Ambulatory Difficulty
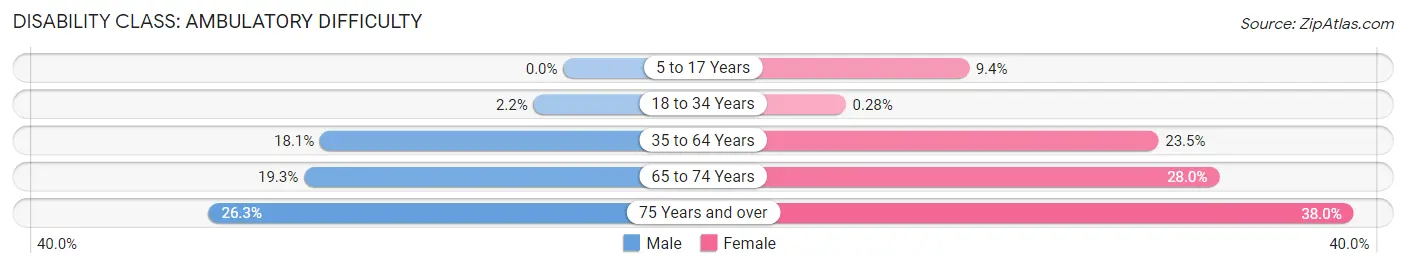
| Age Bracket | Male | Female |
| 5 to 17 Years | 0 (0.0%) | 39 (9.4%) |
| 18 to 34 Years | 22 (2.2%) | 2 (0.3%) |
| 35 to 64 Years | 300 (18.1%) | 340 (23.5%) |
| 65 to 74 Years | 87 (19.3%) | 146 (28.0%) |
| 75 Years and over | 59 (26.3%) | 166 (38.0%) |
Disability Class: Self-Care Difficulty
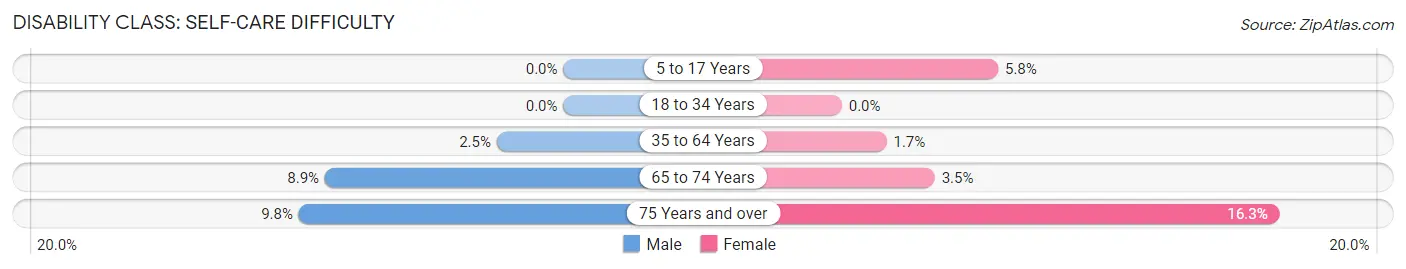
| Age Bracket | Male | Female |
| 5 to 17 Years | 0 (0.0%) | 24 (5.8%) |
| 18 to 34 Years | 0 (0.0%) | 0 (0.0%) |
| 35 to 64 Years | 41 (2.5%) | 24 (1.7%) |
| 65 to 74 Years | 40 (8.8%) | 18 (3.5%) |
| 75 Years and over | 22 (9.8%) | 71 (16.3%) |
Technology Access in Berlin
Computing Device Access in Berlin
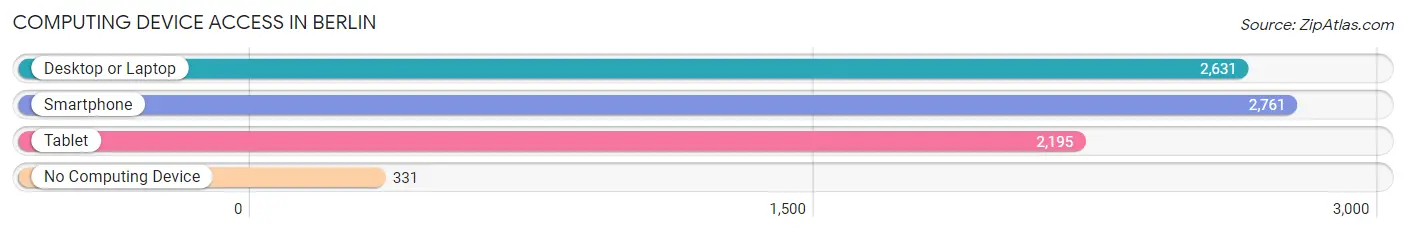
| Device Type | # Households | % Households |
| Desktop or Laptop | 2,631 | 72.3% |
| Smartphone | 2,761 | 75.9% |
| Tablet | 2,195 | 60.3% |
| No Computing Device | 331 | 9.1% |
| Total | 3,638 | 100.0% |
Internet Access in Berlin
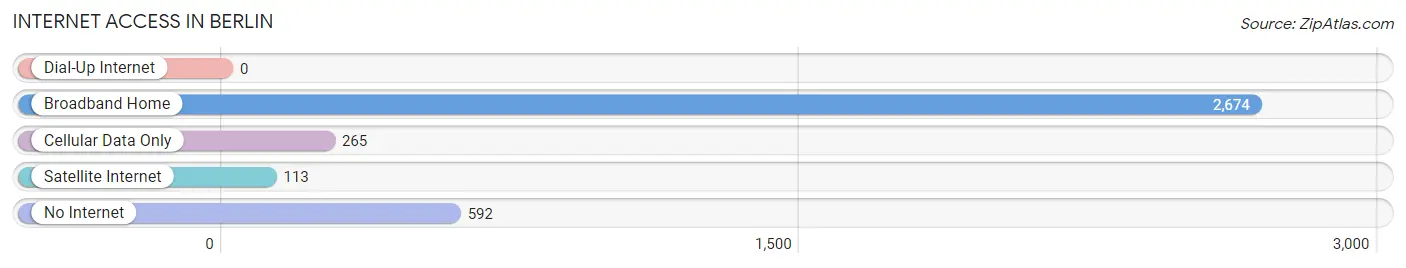
| Internet Type | # Households | % Households |
| Dial-Up Internet | 0 | 0.0% |
| Broadband Home | 2,674 | 73.5% |
| Cellular Data Only | 265 | 7.3% |
| Satellite Internet | 113 | 3.1% |
| No Internet | 592 | 16.3% |
| Total | 3,638 | 100.0% |
Berlin Summary
Berlin is a city located in Coos County, New Hampshire, United States. It is the largest city in the county and the second largest in the state. The population was 10,051 at the 2010 census. It includes the village of Cascade.
Geography
Berlin is located in northern New Hampshire at the junction of the Androscoggin and Dead Rivers. It is bordered to the north by the White Mountains and to the south by the Mahoosuc Range. The city is situated in the northern part of the state, approximately 90 miles north of Concord, the state capital.
The city has a total area of 24.2 square miles, of which 23.9 square miles is land and 0.3 square miles is water. The highest point in Berlin is the summit of Mount Cabot, at 4,170 feet above sea level.
History
Berlin was first settled in 1771 by a group of settlers from Massachusetts. The town was originally called Maynesborough, after Sir William Mayne, a British officer who had served in the French and Indian War. The name was changed to Berlin in 1829, after the Prussian capital.
The city was incorporated in 1829 and quickly became an important industrial center. The city was home to several paper mills, sawmills, and gristmills. The city also had a thriving lumber industry, which was the main source of employment for many of the city's residents.
In the late 19th century, Berlin was a major center for the production of woolen goods. The city was also home to several shoe factories, which produced shoes for the U.S. Army during World War I.
Economy
Berlin is the economic center of Coos County. The city is home to several large employers, including the Androscoggin Mill, which produces paper products; the Berlin Mills Company, which produces lumber and wood products; and the Berlin Shoe Company, which produces shoes.
The city is also home to several smaller businesses, including restaurants, retail stores, and service providers. The city is also home to several medical facilities, including the Androscoggin Valley Hospital and the Berlin Health Center.
Demographics
As of the 2010 census, there were 10,051 people, 4,093 households, and 2,541 families residing in the city. The population density was 420.2 people per square mile. The racial makeup of the city was 94.3% White, 0.7% African American, 0.5% Native American, 0.7% Asian, 0.1% Pacific Islander, 1.2% from other races, and 2.5% from two or more races. Hispanic or Latino of any race were 3.2% of the population.
The median income for a household in the city was $37,917, and the median income for a family was $45,945. The per capita income for the city was $19,945. About 11.3% of families and 14.2% of the population were below the poverty line, including 19.2% of those under age 18 and 8.7% of those age 65 or over.
Berlin is a diverse city, with a mix of cultures and backgrounds. The city is home to a large French-Canadian population, as well as a growing Somali population. The city also has a large number of immigrants from other countries, including Mexico, India, and Vietnam.
Common Questions
What is Per Capita Income in Berlin?
Per Capita income in Berlin is $25,843.
What is the Median Family Income in Berlin?
Median Family Income in Berlin is $61,627.
What is the Median Household income in Berlin?
Median Household Income in Berlin is $41,638.
What is Income or Wage Gap in Berlin?
Income or Wage Gap in Berlin is 16.9%.
Women in Berlin earn 83.1 cents for every dollar earned by a man.
What is Inequality or Gini Index in Berlin?
Inequality or Gini Index in Berlin is 0.48.
What is the Total Population of Berlin?
Total Population of Berlin is 9,485.
What is the Total Male Population of Berlin?
Total Male Population of Berlin is 5,621.
What is the Total Female Population of Berlin?
Total Female Population of Berlin is 3,864.
What is the Ratio of Males per 100 Females in Berlin?
There are 145.47 Males per 100 Females in Berlin.
What is the Ratio of Females per 100 Males in Berlin?
There are 68.74 Females per 100 Males in Berlin.
What is the Median Population Age in Berlin?
Median Population Age in Berlin is 44.2 Years.
What is the Average Family Size in Berlin
Average Family Size in Berlin is 2.8 People.
What is the Average Household Size in Berlin
Average Household Size in Berlin is 2.2 People.
How Large is the Labor Force in Berlin?
There are 4,060 People in the Labor Forcein in Berlin.
What is the Percentage of People in the Labor Force in Berlin?
49.9% of People are in the Labor Force in Berlin.
What is the Unemployment Rate in Berlin?
Unemployment Rate in Berlin is 5.2%.