West Stewartstown, NH Map & Demographics
West Stewartstown Map
West Stewartstown Overview
$19,105
PER CAPITA INCOME
$63,333
AVG HOUSEHOLD INCOME
64.0%
WAGE / INCOME GAP [ % ]
36.0¢/ $1
WAGE / INCOME GAP [ $ ]
0.24
INEQUALITY / GINI INDEX
465
TOTAL POPULATION
191
MALE POPULATION
274
FEMALE POPULATION
69.71
MALES / 100 FEMALES
143.46
FEMALES / 100 MALES
44.3
MEDIAN AGE
2.4
AVG FAMILY SIZE
2.4
AVG HOUSEHOLD SIZE
194
LABOR FORCE [ PEOPLE ]
47.7%
PERCENT IN LABOR FORCE
8.8%
UNEMPLOYMENT RATE
West Stewartstown Zip Codes
West Stewartstown Area Codes
Income in West Stewartstown
Income Overview in West Stewartstown
| Characteristic | Number | Measure |
| Per Capita Income | 465 | $19,105 |
| Median Family Income | 97 | $0 |
| Mean Family Income | 97 | $42,245 |
| Median Household Income | 146 | $63,333 |
| Mean Household Income | 146 | $54,203 |
| Income Deficit | 97 | $0 |
| Wage / Income Gap (%) | 465 | 64.03% |
| Wage / Income Gap ($) | 465 | 35.97¢ per $1 |
| Gini / Inequality Index | 465 | 0.24 |
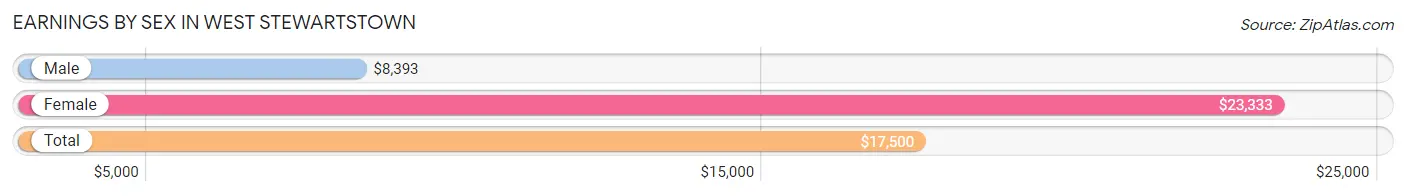
Earnings by Sex in West Stewartstown
Average Earnings in West Stewartstown are $17,500, $8,393 for men and $23,333 for women, a difference of 64.0%.
| Sex | Number | Average Earnings |
| Male | 62 (30.1%) | $8,393 |
| Female | 144 (69.9%) | $23,333 |
| Total | 206 (100.0%) | $17,500 |
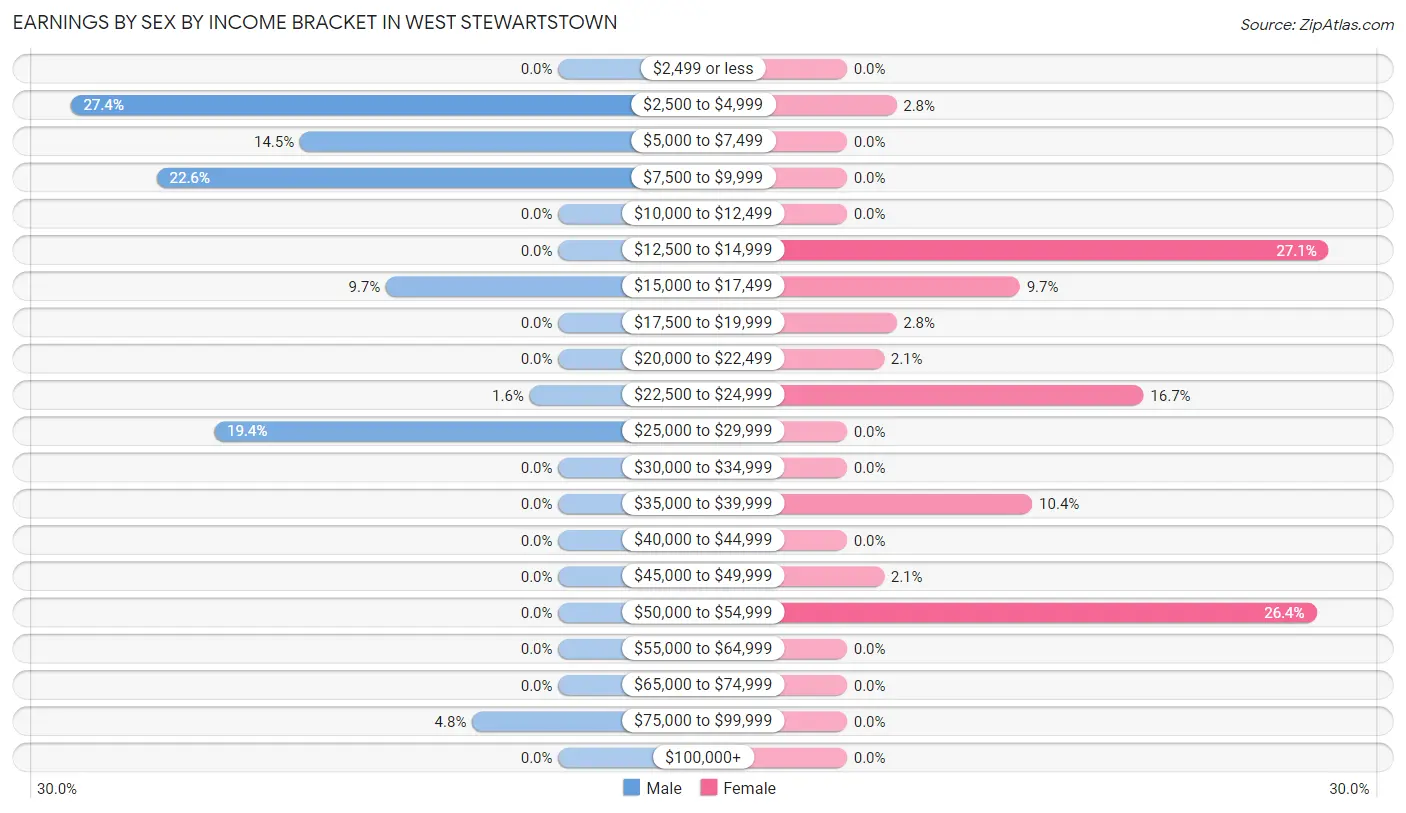
Earnings by Sex by Income Bracket in West Stewartstown
The most common earnings brackets in West Stewartstown are $2,500 to $4,999 for men (17 | 27.4%) and $12,500 to $14,999 for women (39 | 27.1%).
| Income | Male | Female |
| $2,499 or less | 0 (0.0%) | 0 (0.0%) |
| $2,500 to $4,999 | 17 (27.4%) | 4 (2.8%) |
| $5,000 to $7,499 | 9 (14.5%) | 0 (0.0%) |
| $7,500 to $9,999 | 14 (22.6%) | 0 (0.0%) |
| $10,000 to $12,499 | 0 (0.0%) | 0 (0.0%) |
| $12,500 to $14,999 | 0 (0.0%) | 39 (27.1%) |
| $15,000 to $17,499 | 6 (9.7%) | 14 (9.7%) |
| $17,500 to $19,999 | 0 (0.0%) | 4 (2.8%) |
| $20,000 to $22,499 | 0 (0.0%) | 3 (2.1%) |
| $22,500 to $24,999 | 1 (1.6%) | 24 (16.7%) |
| $25,000 to $29,999 | 12 (19.4%) | 0 (0.0%) |
| $30,000 to $34,999 | 0 (0.0%) | 0 (0.0%) |
| $35,000 to $39,999 | 0 (0.0%) | 15 (10.4%) |
| $40,000 to $44,999 | 0 (0.0%) | 0 (0.0%) |
| $45,000 to $49,999 | 0 (0.0%) | 3 (2.1%) |
| $50,000 to $54,999 | 0 (0.0%) | 38 (26.4%) |
| $55,000 to $64,999 | 0 (0.0%) | 0 (0.0%) |
| $65,000 to $74,999 | 0 (0.0%) | 0 (0.0%) |
| $75,000 to $99,999 | 3 (4.8%) | 0 (0.0%) |
| $100,000+ | 0 (0.0%) | 0 (0.0%) |
| Total | 62 (100.0%) | 144 (100.0%) |
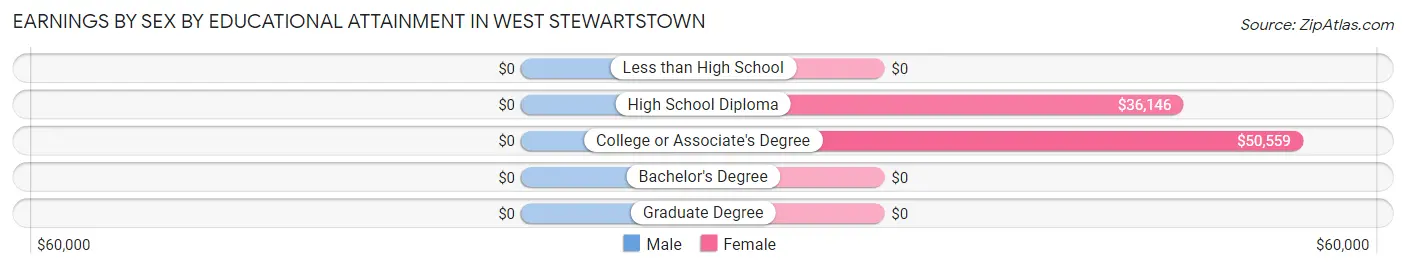
Earnings by Sex by Educational Attainment in West Stewartstown
| Educational Attainment | Male Income | Female Income |
| Less than High School | - | - |
| High School Diploma | - | - |
| College or Associate's Degree | - | - |
| Bachelor's Degree | - | - |
| Graduate Degree | - | - |
| Total | - | - |
Family Income in West Stewartstown
Family Income Brackets in West Stewartstown
According to the West Stewartstown family income data, there are 48 families falling into the $25,000 to $34,999 income range, which is the most common income bracket and makes up 49.5% of all families.
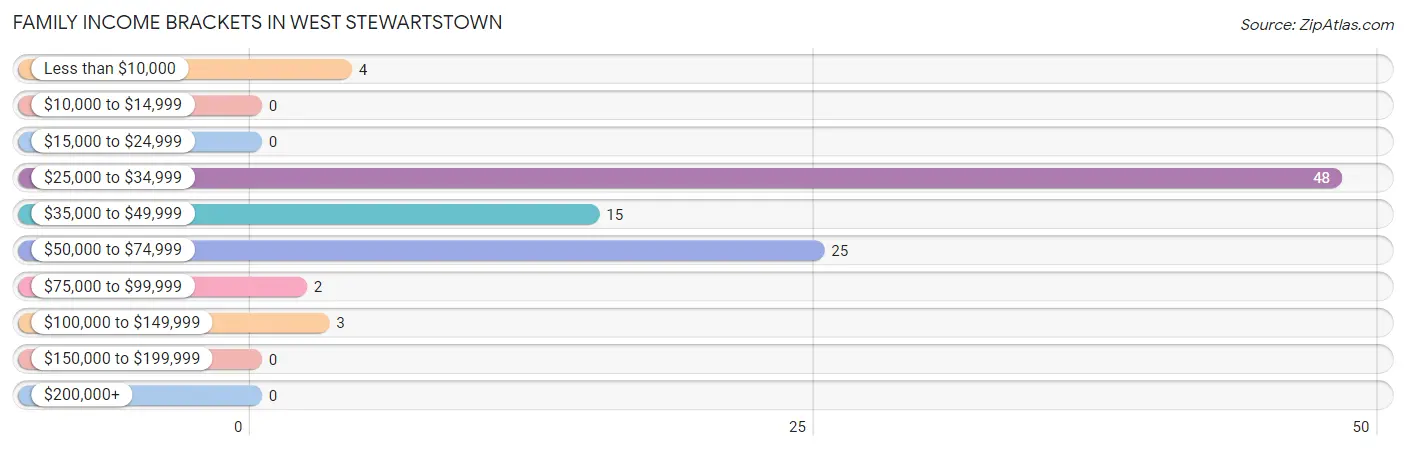
| Income Bracket | # Families | % Families |
| Less than $10,000 | 4 | 4.1% |
| $10,000 to $14,999 | 0 | 0.0% |
| $15,000 to $24,999 | 0 | 0.0% |
| $25,000 to $34,999 | 48 | 49.5% |
| $35,000 to $49,999 | 15 | 15.5% |
| $50,000 to $74,999 | 25 | 25.8% |
| $75,000 to $99,999 | 2 | 2.1% |
| $100,000 to $149,999 | 3 | 3.1% |
| $150,000 to $199,999 | 0 | 0.0% |
| $200,000+ | 0 | 0.0% |
Family Income by Famaliy Size in West Stewartstown
3-person families (39 | 40.2%) account for the highest median family income in West Stewartstown with $67,569 per family, while 3-person families (39 | 40.2%) have the highest median income of $22,523 per family member.
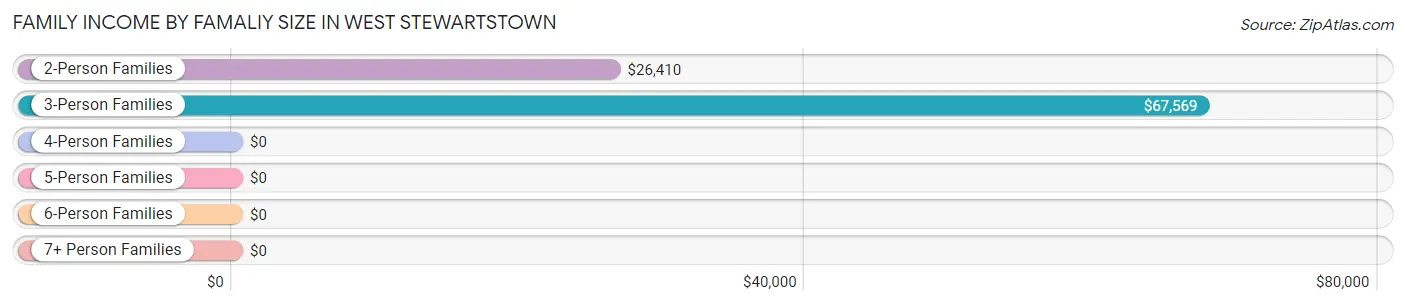
| Income Bracket | # Families | Median Income |
| 2-Person Families | 52 (53.6%) | $26,410 |
| 3-Person Families | 39 (40.2%) | $67,569 |
| 4-Person Families | 3 (3.1%) | $0 |
| 5-Person Families | 3 (3.1%) | $0 |
| 6-Person Families | 0 (0.0%) | $0 |
| 7+ Person Families | 0 (0.0%) | $0 |
| Total | 97 (100.0%) | $0 |
Family Income by Number of Earners in West Stewartstown
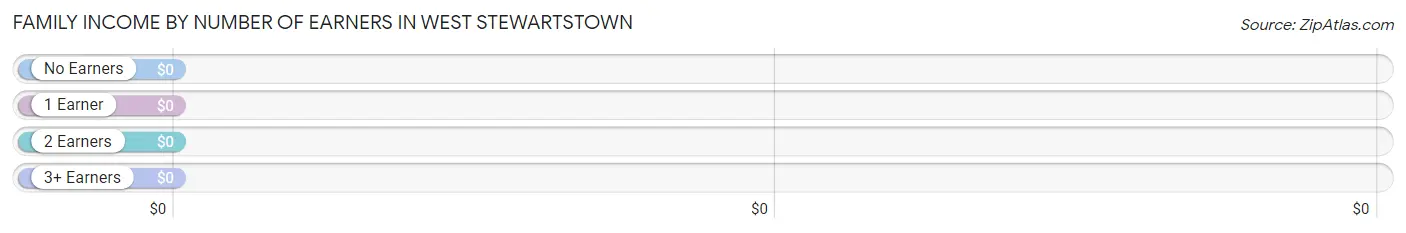
| Number of Earners | # Families | Median Income |
| No Earners | 0 (0.0%) | $0 |
| 1 Earner | 94 (96.9%) | $0 |
| 2 Earners | 3 (3.1%) | $0 |
| 3+ Earners | 0 (0.0%) | $0 |
| Total | 97 (100.0%) | $0 |
Household Income in West Stewartstown
Household Income Brackets in West Stewartstown
With 41 households falling in the category, the $75,000 to $99,999 income range is the most frequent in West Stewartstown, accounting for 28.1% of all households.
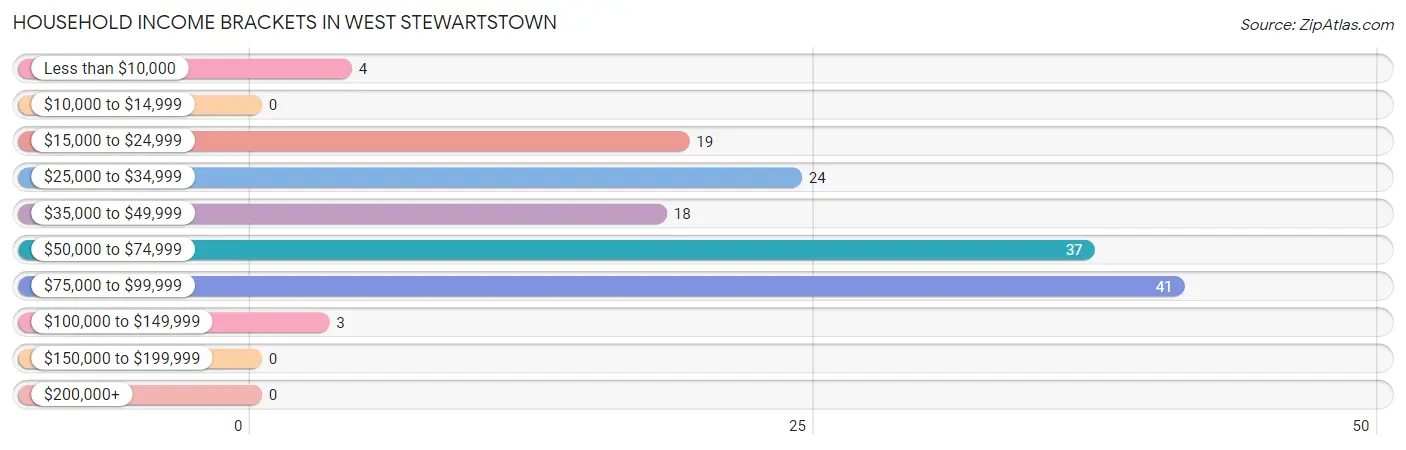
| Income Bracket | # Households | % Households |
| Less than $10,000 | 4 | 2.7% |
| $10,000 to $14,999 | 0 | 0.0% |
| $15,000 to $24,999 | 19 | 13.0% |
| $25,000 to $34,999 | 24 | 16.4% |
| $35,000 to $49,999 | 18 | 12.3% |
| $50,000 to $74,999 | 37 | 25.3% |
| $75,000 to $99,999 | 41 | 28.1% |
| $100,000 to $149,999 | 3 | 2.1% |
| $150,000 to $199,999 | 0 | 0.0% |
| $200,000+ | 0 | 0.0% |
Household Income by Householder Age in West Stewartstown
The median household income in West Stewartstown is $63,333, with the highest median household income of $76,026 found in the 25 to 44 years age bracket for the primary householder. A total of 46 households (31.5%) fall into this category. Meanwhile, the 15 to 24 years age bracket for the primary householder has the lowest median household income of $0, with 21 households (14.4%) in this group.
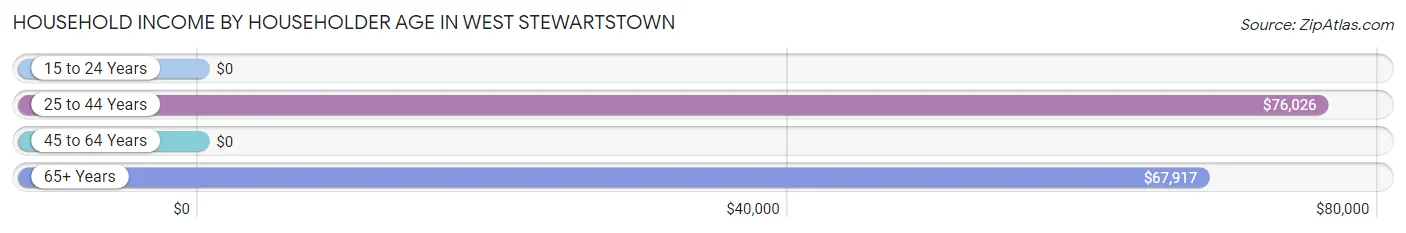
| Income Bracket | # Households | Median Income |
| 15 to 24 Years | 21 (14.4%) | $0 |
| 25 to 44 Years | 46 (31.5%) | $76,026 |
| 45 to 64 Years | 39 (26.7%) | $0 |
| 65+ Years | 40 (27.4%) | $67,917 |
| Total | 146 (100.0%) | $63,333 |
Poverty in West Stewartstown
Income Below Poverty by Sex and Age in West Stewartstown
With 15.5% poverty level for males and 5.8% for females among the residents of West Stewartstown, 18 to 24 year old males and 25 to 34 year old females are the most vulnerable to poverty, with 21 males (33.3%) and 4 females (57.1%) in their respective age groups living below the poverty level.
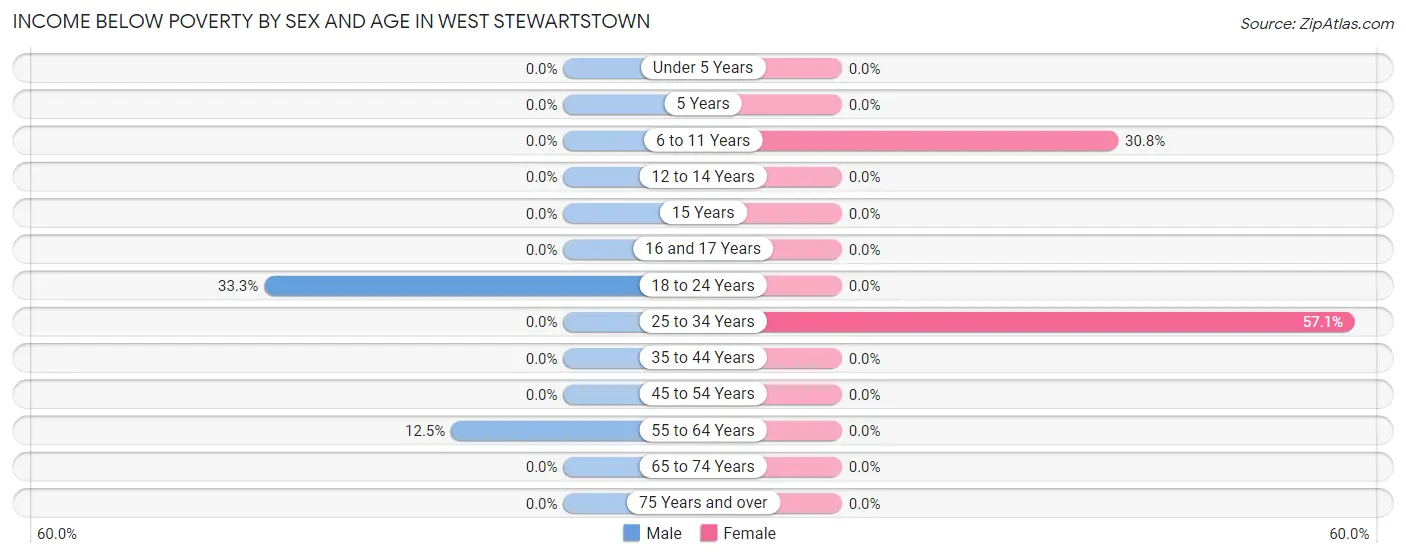
| Age Bracket | Male | Female |
| Under 5 Years | 0 (0.0%) | 0 (0.0%) |
| 5 Years | 0 (0.0%) | 0 (0.0%) |
| 6 to 11 Years | 0 (0.0%) | 8 (30.8%) |
| 12 to 14 Years | 0 (0.0%) | 0 (0.0%) |
| 15 Years | 0 (0.0%) | 0 (0.0%) |
| 16 and 17 Years | 0 (0.0%) | 0 (0.0%) |
| 18 to 24 Years | 21 (33.3%) | 0 (0.0%) |
| 25 to 34 Years | 0 (0.0%) | 4 (57.1%) |
| 35 to 44 Years | 0 (0.0%) | 0 (0.0%) |
| 45 to 54 Years | 0 (0.0%) | 0 (0.0%) |
| 55 to 64 Years | 2 (12.5%) | 0 (0.0%) |
| 65 to 74 Years | 0 (0.0%) | 0 (0.0%) |
| 75 Years and over | 0 (0.0%) | 0 (0.0%) |
| Total | 23 (15.5%) | 12 (5.8%) |
Income Above Poverty by Sex and Age in West Stewartstown
According to the poverty statistics in West Stewartstown, males aged 6 to 11 years and females aged under 5 years are the age groups that are most secure financially, with 100.0% of males and 100.0% of females in these age groups living above the poverty line.
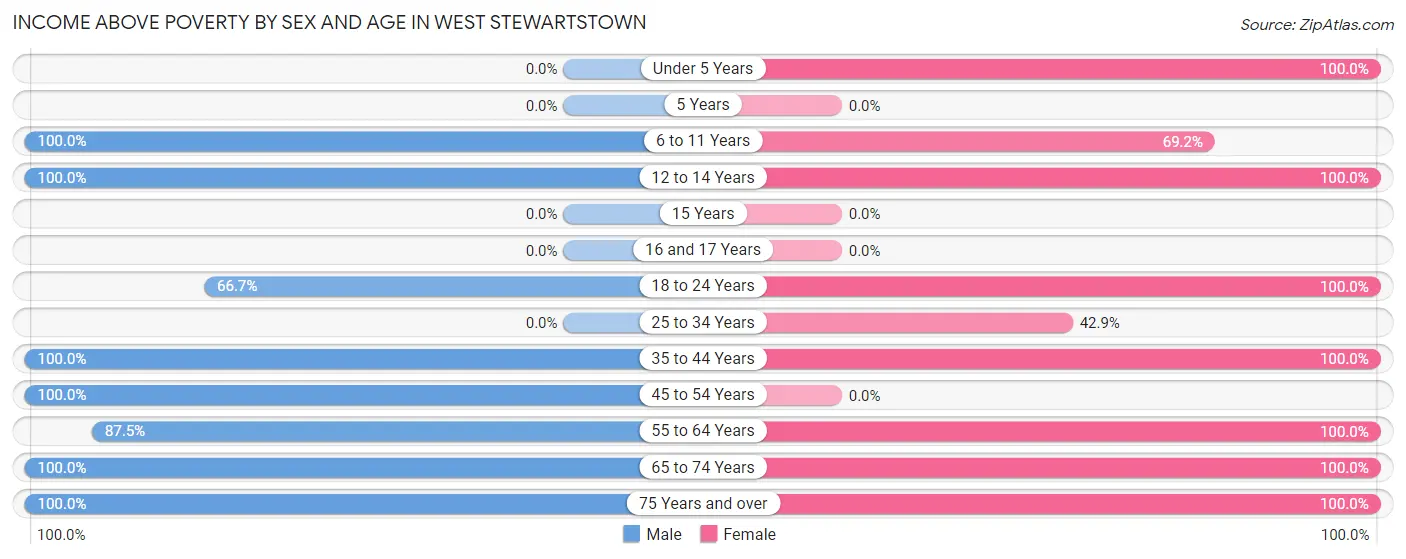
| Age Bracket | Male | Female |
| Under 5 Years | 0 (0.0%) | 12 (100.0%) |
| 5 Years | 0 (0.0%) | 0 (0.0%) |
| 6 to 11 Years | 11 (100.0%) | 18 (69.2%) |
| 12 to 14 Years | 4 (100.0%) | 5 (100.0%) |
| 15 Years | 0 (0.0%) | 0 (0.0%) |
| 16 and 17 Years | 0 (0.0%) | 0 (0.0%) |
| 18 to 24 Years | 42 (66.7%) | 21 (100.0%) |
| 25 to 34 Years | 0 (0.0%) | 3 (42.9%) |
| 35 to 44 Years | 2 (100.0%) | 88 (100.0%) |
| 45 to 54 Years | 20 (100.0%) | 0 (0.0%) |
| 55 to 64 Years | 14 (87.5%) | 18 (100.0%) |
| 65 to 74 Years | 23 (100.0%) | 26 (100.0%) |
| 75 Years and over | 9 (100.0%) | 4 (100.0%) |
| Total | 125 (84.5%) | 195 (94.2%) |
Income Below Poverty Among Married-Couple Families in West Stewartstown
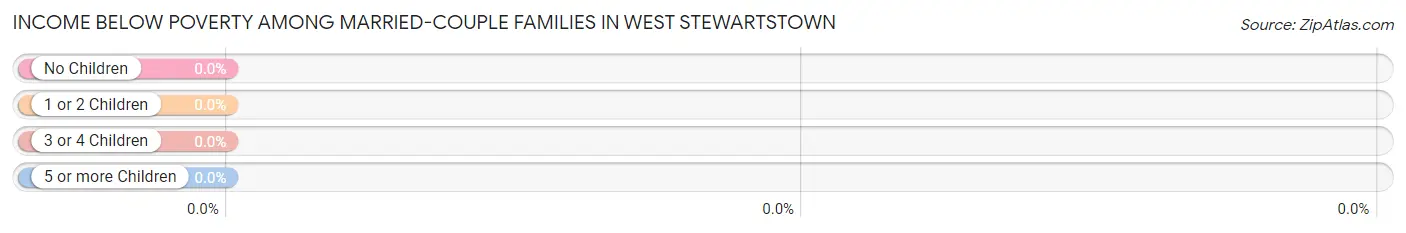
| Children | Above Poverty | Below Poverty |
| No Children | 8 (100.0%) | 0 (0.0%) |
| 1 or 2 Children | 21 (100.0%) | 0 (0.0%) |
| 3 or 4 Children | 0 (0.0%) | 0 (0.0%) |
| 5 or more Children | 0 (0.0%) | 0 (0.0%) |
| Total | 29 (100.0%) | 0 (0.0%) |
Income Below Poverty Among Single-Parent Households in West Stewartstown
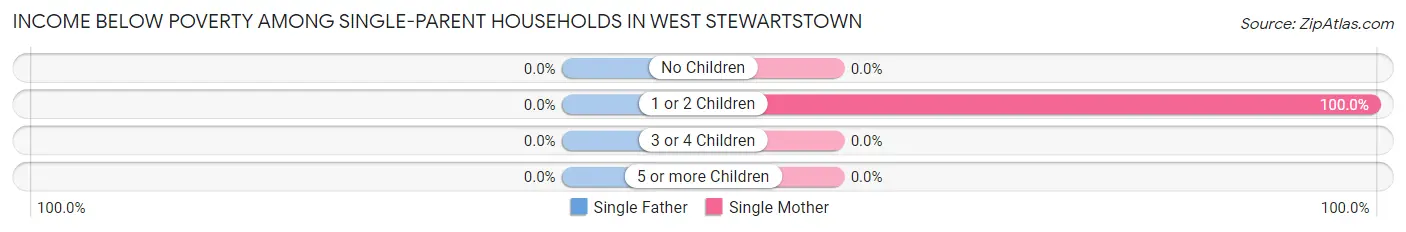
| Children | Single Father | Single Mother |
| No Children | 0 (0.0%) | 0 (0.0%) |
| 1 or 2 Children | 0 (0.0%) | 4 (100.0%) |
| 3 or 4 Children | 0 (0.0%) | 0 (0.0%) |
| 5 or more Children | 0 (0.0%) | 0 (0.0%) |
| Total | 0 (0.0%) | 4 (6.8%) |
Income Below Poverty Among Married-Couple vs Single-Parent Households in West Stewartstown
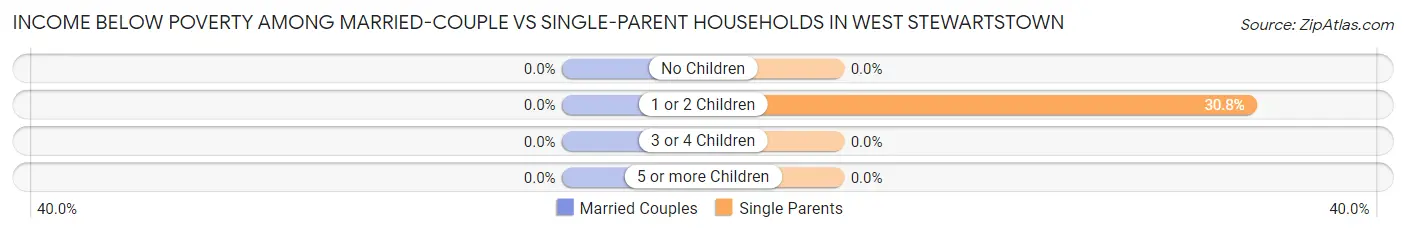
| Children | Married-Couple Families | Single-Parent Households |
| No Children | 0 (0.0%) | 0 (0.0%) |
| 1 or 2 Children | 0 (0.0%) | 4 (30.8%) |
| 3 or 4 Children | 0 (0.0%) | 0 (0.0%) |
| 5 or more Children | 0 (0.0%) | 0 (0.0%) |
| Total | 0 (0.0%) | 4 (5.9%) |
Race in West Stewartstown
The most populous races in West Stewartstown are White / Caucasian (450 | 96.8%), Hispanic or Latino (16 | 3.4%), and Two or more Races (9 | 1.9%).
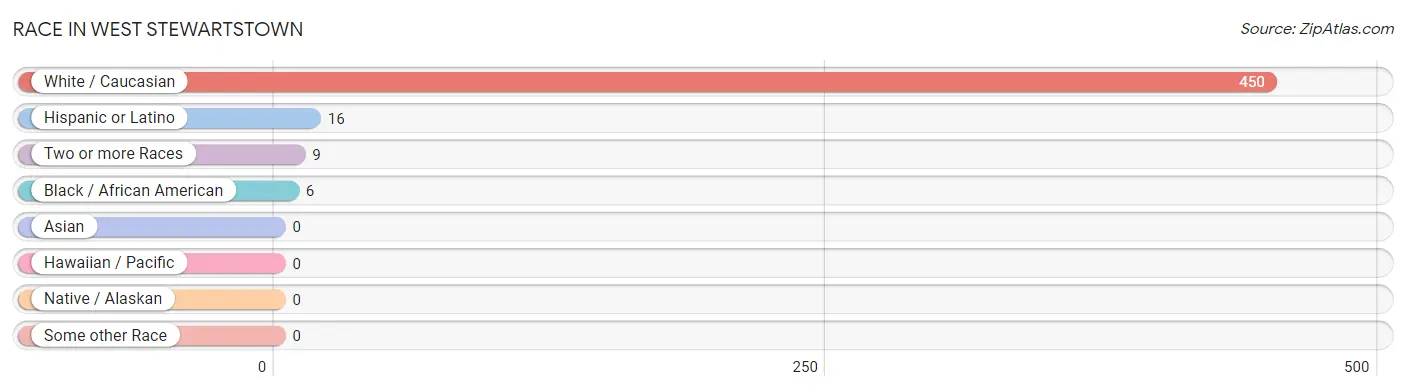
| Race | # Population | % Population |
| Asian | 0 | 0.0% |
| Black / African American | 6 | 1.3% |
| Hawaiian / Pacific | 0 | 0.0% |
| Hispanic or Latino | 16 | 3.4% |
| Native / Alaskan | 0 | 0.0% |
| White / Caucasian | 450 | 96.8% |
| Two or more Races | 9 | 1.9% |
| Some other Race | 0 | 0.0% |
| Total | 465 | 100.0% |
Ancestry in West Stewartstown
The most populous ancestries reported in West Stewartstown are English (87 | 18.7%), American (47 | 10.1%), Irish (39 | 8.4%), French (24 | 5.2%), and Italian (24 | 5.2%), together accounting for 47.5% of all West Stewartstown residents.
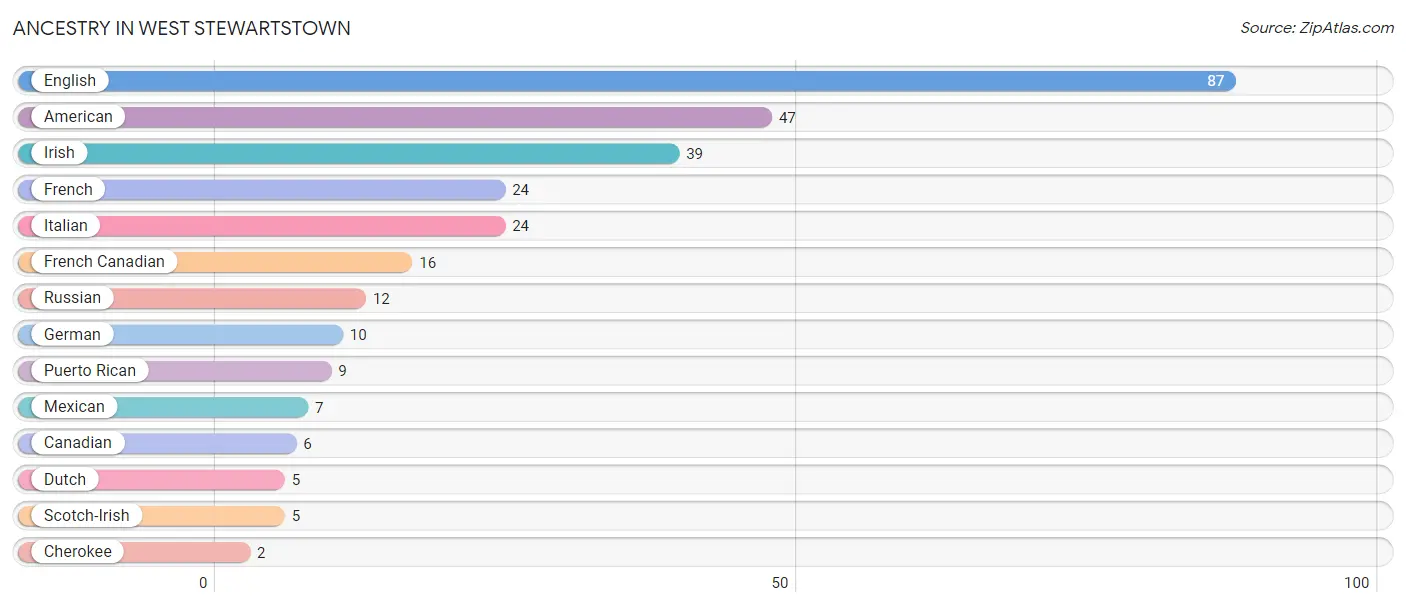
| Ancestry | # Population | % Population |
| American | 47 | 10.1% |
| Canadian | 6 | 1.3% |
| Cherokee | 2 | 0.4% |
| Dutch | 5 | 1.1% |
| English | 87 | 18.7% |
| French | 24 | 5.2% |
| French Canadian | 16 | 3.4% |
| German | 10 | 2.1% |
| Irish | 39 | 8.4% |
| Italian | 24 | 5.2% |
| Mexican | 7 | 1.5% |
| Puerto Rican | 9 | 1.9% |
| Russian | 12 | 2.6% |
| Scotch-Irish | 5 | 1.1% | View All 14 Rows |
Immigrants in West Stewartstown
The most numerous immigrant groups reported in West Stewartstown came from , and Canada (10 | 2.1%), together accounting for 2.1% of all West Stewartstown residents.

| Immigration Origin | # Population | % Population |
| Canada | 10 | 2.1% | View All 1 Rows |
Sex and Age in West Stewartstown
Sex and Age in West Stewartstown
The most populous age groups in West Stewartstown are 20 to 24 Years (63 | 33.0%) for men and 40 to 44 Years (80 | 29.2%) for women.
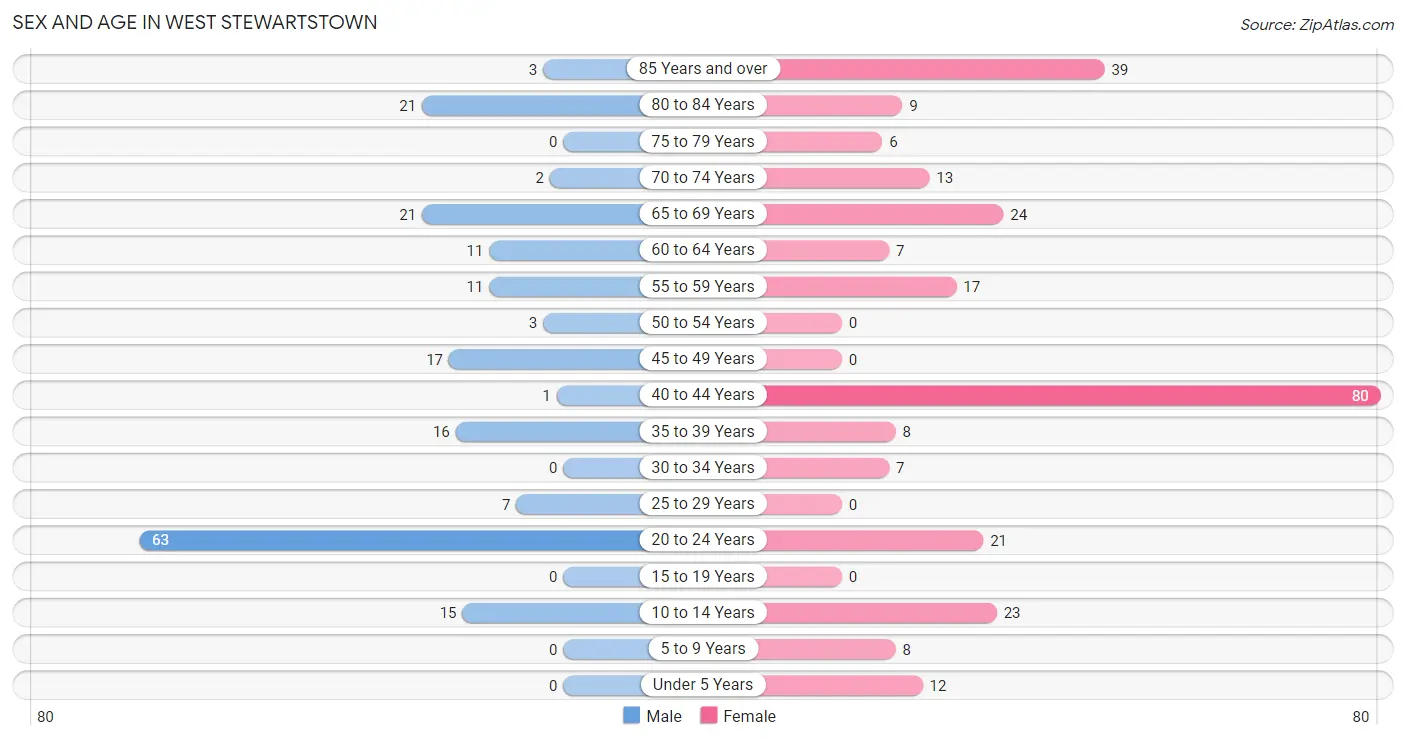
| Age Bracket | Male | Female |
| Under 5 Years | 0 (0.0%) | 12 (4.4%) |
| 5 to 9 Years | 0 (0.0%) | 8 (2.9%) |
| 10 to 14 Years | 15 (7.9%) | 23 (8.4%) |
| 15 to 19 Years | 0 (0.0%) | 0 (0.0%) |
| 20 to 24 Years | 63 (33.0%) | 21 (7.7%) |
| 25 to 29 Years | 7 (3.7%) | 0 (0.0%) |
| 30 to 34 Years | 0 (0.0%) | 7 (2.5%) |
| 35 to 39 Years | 16 (8.4%) | 8 (2.9%) |
| 40 to 44 Years | 1 (0.5%) | 80 (29.2%) |
| 45 to 49 Years | 17 (8.9%) | 0 (0.0%) |
| 50 to 54 Years | 3 (1.6%) | 0 (0.0%) |
| 55 to 59 Years | 11 (5.8%) | 17 (6.2%) |
| 60 to 64 Years | 11 (5.8%) | 7 (2.5%) |
| 65 to 69 Years | 21 (11.0%) | 24 (8.8%) |
| 70 to 74 Years | 2 (1.1%) | 13 (4.7%) |
| 75 to 79 Years | 0 (0.0%) | 6 (2.2%) |
| 80 to 84 Years | 21 (11.0%) | 9 (3.3%) |
| 85 Years and over | 3 (1.6%) | 39 (14.2%) |
| Total | 191 (100.0%) | 274 (100.0%) |
Families and Households in West Stewartstown
Median Family Size in West Stewartstown
The median family size in West Stewartstown is 2.44 persons per family, with single male/father families (9 | 9.3%) accounting for the largest median family size of 3.56 persons per family. On the other hand, single female/mother families (59 | 60.8%) represent the smallest median family size with 2.17 persons per family.
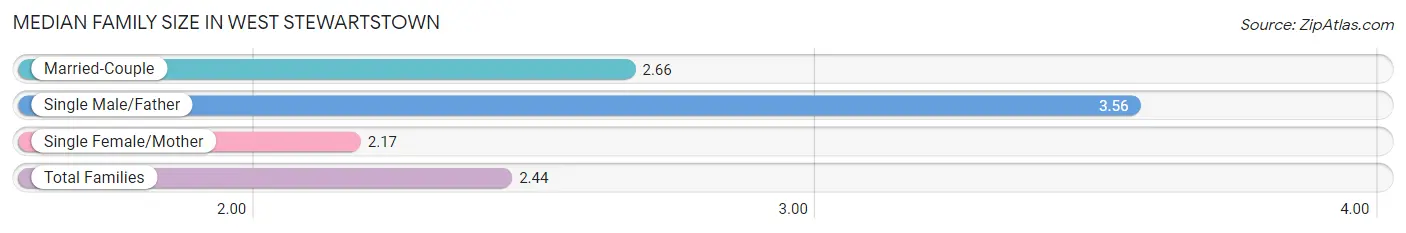
| Family Type | # Families | Family Size |
| Married-Couple | 29 (29.9%) | 2.66 |
| Single Male/Father | 9 (9.3%) | 3.56 |
| Single Female/Mother | 59 (60.8%) | 2.17 |
| Total Families | 97 (100.0%) | 2.44 |
Median Household Size in West Stewartstown
The median household size in West Stewartstown is 2.43 persons per household, with single male/father households (9 | 6.2%) accounting for the largest median household size of 4.44 persons per household. non-family households (49 | 33.6%) represent the smallest median household size with 1.29 persons per household.
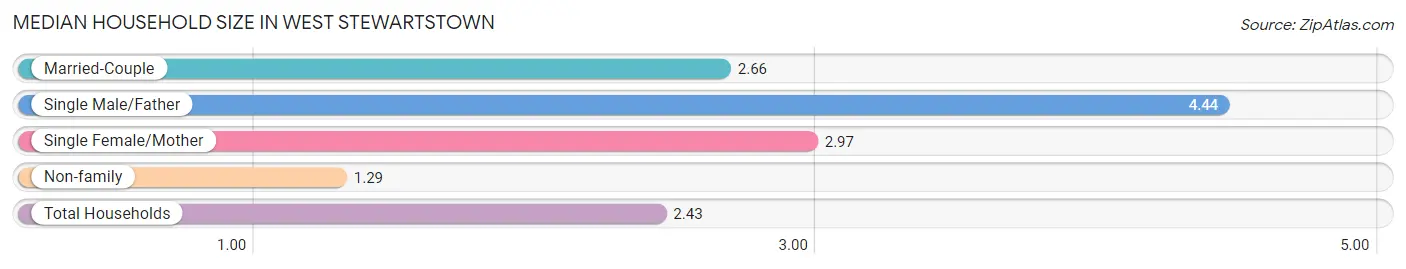
| Household Type | # Households | Household Size |
| Married-Couple | 29 (19.9%) | 2.66 |
| Single Male/Father | 9 (6.2%) | 4.44 |
| Single Female/Mother | 59 (40.4%) | 2.97 |
| Non-family | 49 (33.6%) | 1.29 |
| Total Households | 146 (100.0%) | 2.43 |
Household Size by Marriage Status in West Stewartstown
Out of a total of 146 households in West Stewartstown, 97 (66.4%) are family households, while 49 (33.6%) are nonfamily households. The most numerous type of family households are 3-person households, comprising 73, and the most common type of nonfamily households are 2-person households, comprising 25.
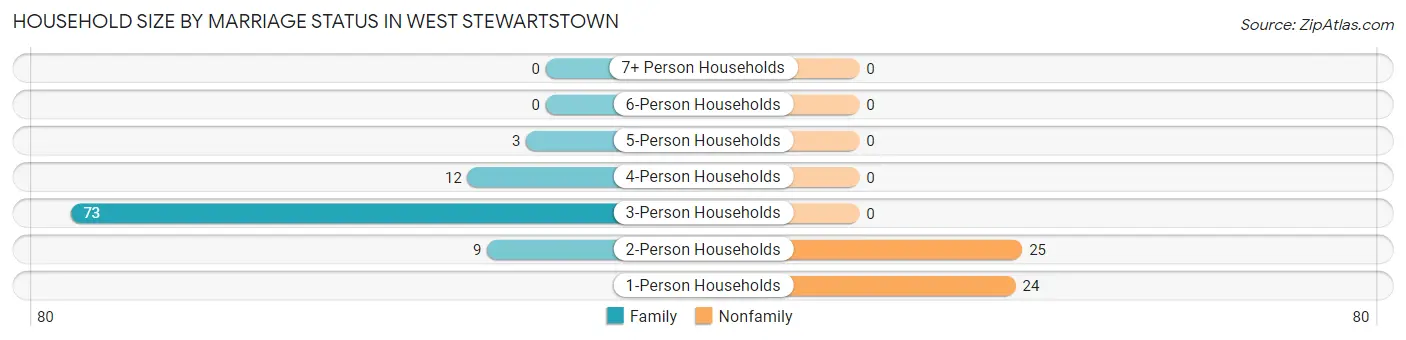
| Household Size | Family Households | Nonfamily Households |
| 1-Person Households | - | 24 (16.4%) |
| 2-Person Households | 9 (6.2%) | 25 (17.1%) |
| 3-Person Households | 73 (50.0%) | 0 (0.0%) |
| 4-Person Households | 12 (8.2%) | 0 (0.0%) |
| 5-Person Households | 3 (2.1%) | 0 (0.0%) |
| 6-Person Households | 0 (0.0%) | 0 (0.0%) |
| 7+ Person Households | 0 (0.0%) | 0 (0.0%) |
| Total | 97 (66.4%) | 49 (33.6%) |
Female Fertility in West Stewartstown
Fertility by Age in West Stewartstown
| Age Bracket | Women with Births | Births / 1,000 Women |
| 15 to 19 years | 0 (0.0%) | 0.0 |
| 20 to 34 years | 0 (0.0%) | 0.0 |
| 35 to 50 years | 0 (0.0%) | 0.0 |
| Total | 0 (0.0%) | 0.0 |
Fertility by Age by Marriage Status in West Stewartstown
| Age Bracket | Married | Unmarried |
| 15 to 19 years | 0 (0.0%) | 0 (0.0%) |
| 20 to 34 years | 0 (0.0%) | 0 (0.0%) |
| 35 to 50 years | 0 (0.0%) | 0 (0.0%) |
| Total | 0 (0.0%) | 0 (0.0%) |
Fertility by Education in West Stewartstown
| Educational Attainment | Women with Births | Births / 1,000 Women |
| Less than High School | 0 (0.0%) | 0.0 |
| High School Diploma | 0 (0.0%) | 0.0 |
| College or Associate's Degree | 0 (0.0%) | 0.0 |
| Bachelor's Degree | 0 (0.0%) | 0.0 |
| Graduate Degree | 0 (0.0%) | 0.0 |
| Total | 0 (0.0%) | 0.0 |
Fertility by Education by Marriage Status in West Stewartstown
| Educational Attainment | Married | Unmarried |
| Less than High School | 0 (0.0%) | 0 (0.0%) |
| High School Diploma | 0 (0.0%) | 0 (0.0%) |
| College or Associate's Degree | 0 (0.0%) | 0 (0.0%) |
| Bachelor's Degree | 0 (0.0%) | 0 (0.0%) |
| Graduate Degree | 0 (0.0%) | 0 (0.0%) |
| Total | 0 (0.0%) | 0 (0.0%) |
Employment Characteristics in West Stewartstown
Employment by Class of Employer in West Stewartstown
Among the 177 employed individuals in West Stewartstown, private company employees (91 | 51.4%), federal government employees (38 | 21.5%), and self-employed (not incorporated) (17 | 9.6%) make up the most common classes of employment.
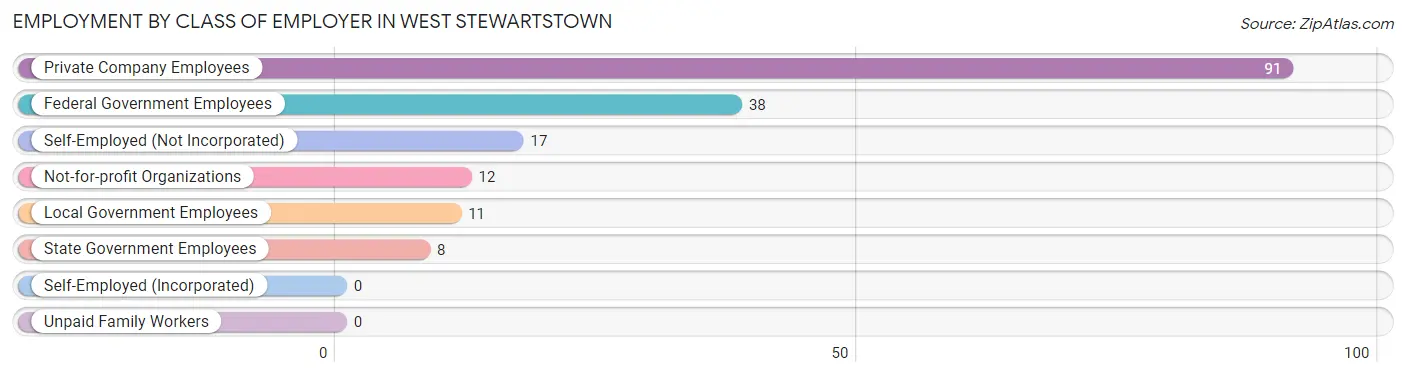
| Employer Class | # Employees | % Employees |
| Private Company Employees | 91 | 51.4% |
| Self-Employed (Incorporated) | 0 | 0.0% |
| Self-Employed (Not Incorporated) | 17 | 9.6% |
| Not-for-profit Organizations | 12 | 6.8% |
| Local Government Employees | 11 | 6.2% |
| State Government Employees | 8 | 4.5% |
| Federal Government Employees | 38 | 21.5% |
| Unpaid Family Workers | 0 | 0.0% |
| Total | 177 | 100.0% |
Employment Status by Age in West Stewartstown
According to the labor force statistics for West Stewartstown, out of the total population over 16 years of age (407), 47.7% or 194 individuals are in the labor force, with 8.8% or 17 of them unemployed. The age group with the highest labor force participation rate is 30 to 34 years, with 100.0% or 7 individuals in the labor force. Within the labor force, the 45 to 54 years age range has the highest percentage of unemployed individuals, with 47.1% or 8 of them being unemployed.
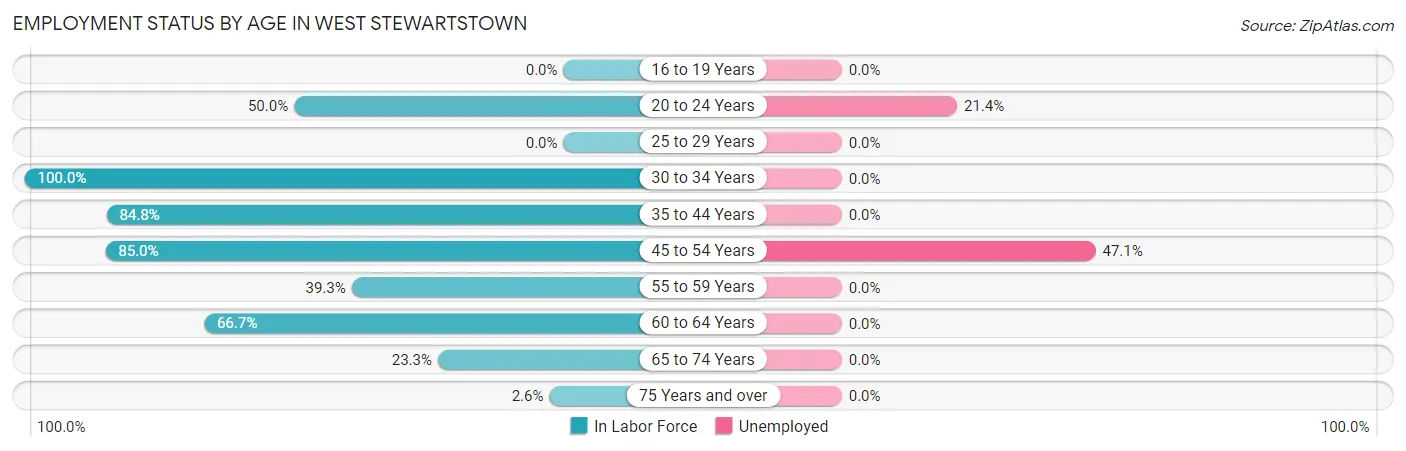
| Age Bracket | In Labor Force | Unemployed |
| 16 to 19 Years | 0 (0.0%) | 0 (0.0%) |
| 20 to 24 Years | 42 (50.0%) | 9 (21.4%) |
| 25 to 29 Years | 0 (0.0%) | 0 (0.0%) |
| 30 to 34 Years | 7 (100.0%) | 0 (0.0%) |
| 35 to 44 Years | 89 (84.8%) | 0 (0.0%) |
| 45 to 54 Years | 17 (85.0%) | 8 (47.1%) |
| 55 to 59 Years | 11 (39.3%) | 0 (0.0%) |
| 60 to 64 Years | 12 (66.7%) | 0 (0.0%) |
| 65 to 74 Years | 14 (23.3%) | 0 (0.0%) |
| 75 Years and over | 2 (2.6%) | 0 (0.0%) |
| Total | 194 (47.7%) | 17 (8.8%) |
Employment Status by Educational Attainment in West Stewartstown
According to labor force statistics for West Stewartstown, 73.5% of individuals (136) out of the total population between 25 and 64 years of age (185) are in the labor force, with 5.9% or 8 of them being unemployed. The group with the highest labor force participation rate are those with the educational attainment of less than high school, with 83.0% or 39 individuals in the labor force. Within the labor force, individuals with high school diploma education have the highest percentage of unemployment, with 16.3% or 8 of them being unemployed.
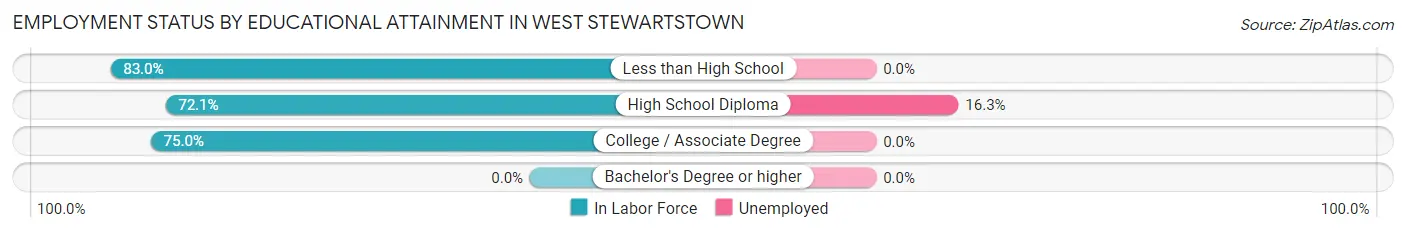
| Educational Attainment | In Labor Force | Unemployed |
| Less than High School | 39 (83.0%) | 0 (0.0%) |
| High School Diploma | 49 (72.1%) | 11 (16.3%) |
| College / Associate Degree | 48 (75.0%) | 0 (0.0%) |
| Bachelor's Degree or higher | 0 (0.0%) | 0 (0.0%) |
| Total | 136 (73.5%) | 11 (5.9%) |
Employment Occupations by Sex in West Stewartstown
Management, Business, Science and Arts Occupations
The most common Management, Business, Science and Arts occupations in West Stewartstown are , and Business & Financial (8 | 4.5%).
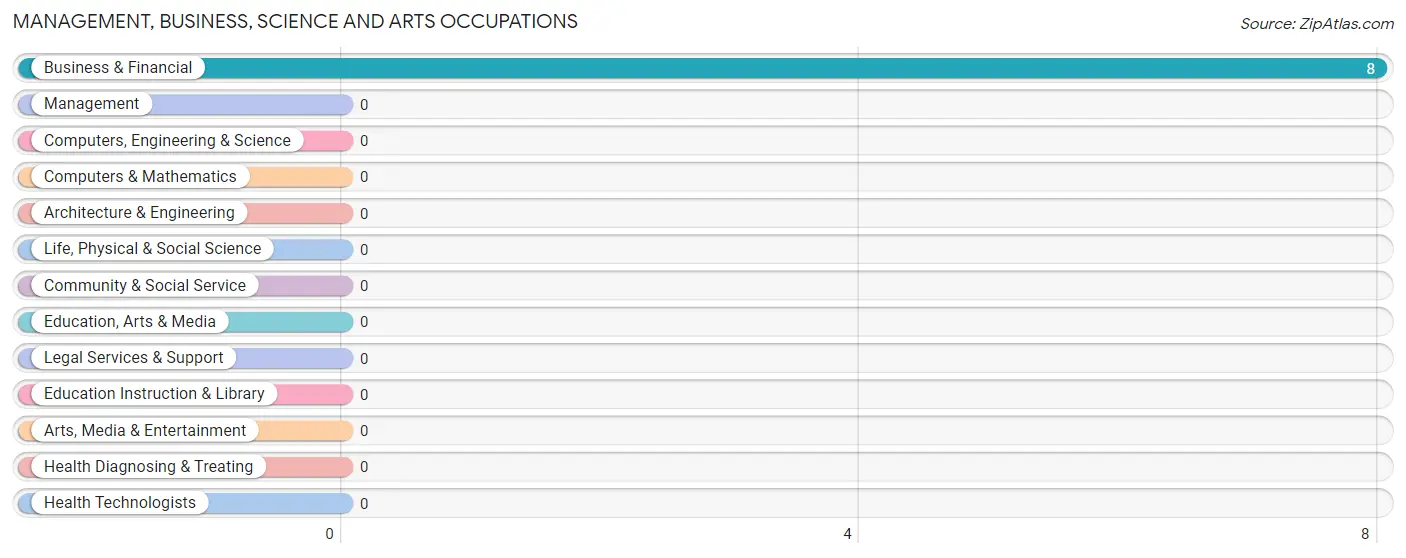
Management, Business, Science and Arts Occupations by Sex
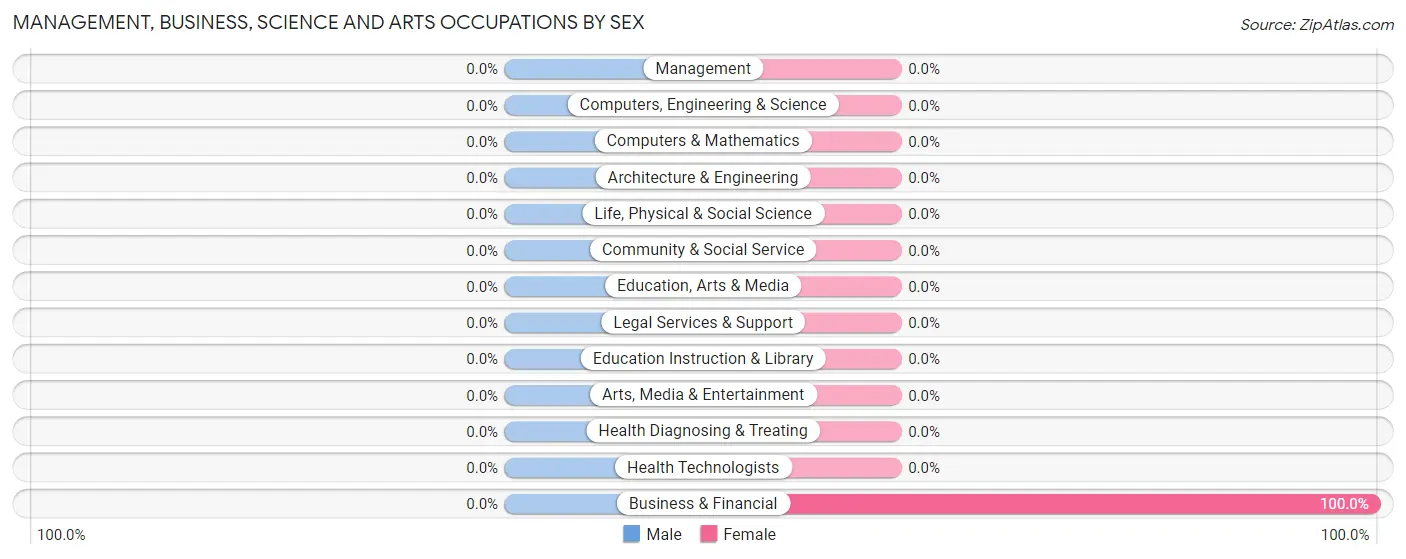
| Occupation | Male | Female |
| Management | 0 (0.0%) | 0 (0.0%) |
| Business & Financial | 0 (0.0%) | 8 (100.0%) |
| Computers, Engineering & Science | 0 (0.0%) | 0 (0.0%) |
| Computers & Mathematics | 0 (0.0%) | 0 (0.0%) |
| Architecture & Engineering | 0 (0.0%) | 0 (0.0%) |
| Life, Physical & Social Science | 0 (0.0%) | 0 (0.0%) |
| Community & Social Service | 0 (0.0%) | 0 (0.0%) |
| Education, Arts & Media | 0 (0.0%) | 0 (0.0%) |
| Legal Services & Support | 0 (0.0%) | 0 (0.0%) |
| Education Instruction & Library | 0 (0.0%) | 0 (0.0%) |
| Arts, Media & Entertainment | 0 (0.0%) | 0 (0.0%) |
| Health Diagnosing & Treating | 0 (0.0%) | 0 (0.0%) |
| Health Technologists | 0 (0.0%) | 0 (0.0%) |
| Total (Category) | 0 (0.0%) | 8 (100.0%) |
| Total (Overall) | 33 (18.6%) | 144 (81.4%) |
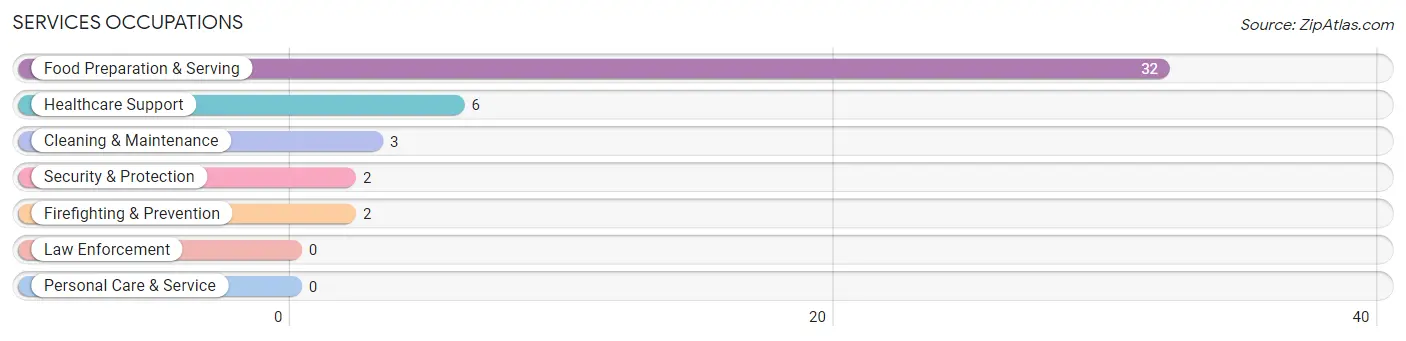
Services Occupations
The most common Services occupations in West Stewartstown are Food Preparation & Serving (32 | 18.1%), Healthcare Support (6 | 3.4%), Cleaning & Maintenance (3 | 1.7%), Security & Protection (2 | 1.1%), and Firefighting & Prevention (2 | 1.1%).
Services Occupations by Sex
Within the Services occupations in West Stewartstown, the most male-oriented occupations are Security & Protection (100.0%), and Firefighting & Prevention (100.0%), while the most female-oriented occupations are Healthcare Support (100.0%), Food Preparation & Serving (100.0%), and Cleaning & Maintenance (100.0%).
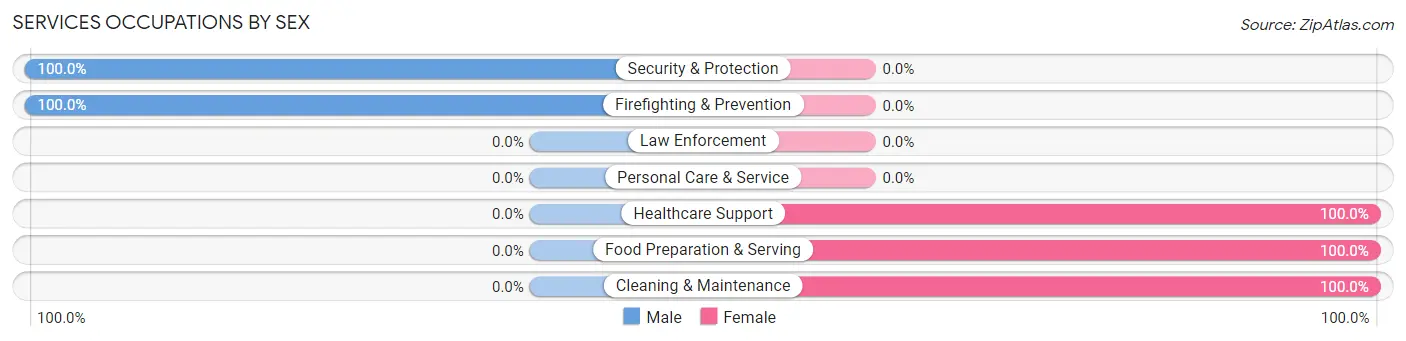
| Occupation | Male | Female |
| Healthcare Support | 0 (0.0%) | 6 (100.0%) |
| Security & Protection | 2 (100.0%) | 0 (0.0%) |
| Firefighting & Prevention | 2 (100.0%) | 0 (0.0%) |
| Law Enforcement | 0 (0.0%) | 0 (0.0%) |
| Food Preparation & Serving | 0 (0.0%) | 32 (100.0%) |
| Cleaning & Maintenance | 0 (0.0%) | 3 (100.0%) |
| Personal Care & Service | 0 (0.0%) | 0 (0.0%) |
| Total (Category) | 2 (4.6%) | 41 (95.4%) |
| Total (Overall) | 33 (18.6%) | 144 (81.4%) |
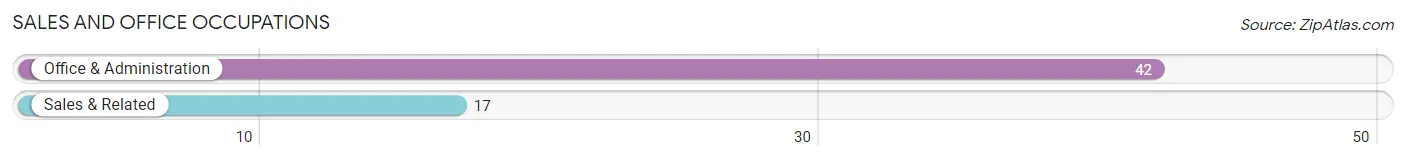
Sales and Office Occupations
The most common Sales and Office occupations in West Stewartstown are Office & Administration (42 | 23.7%), and Sales & Related (17 | 9.6%).
Sales and Office Occupations by Sex
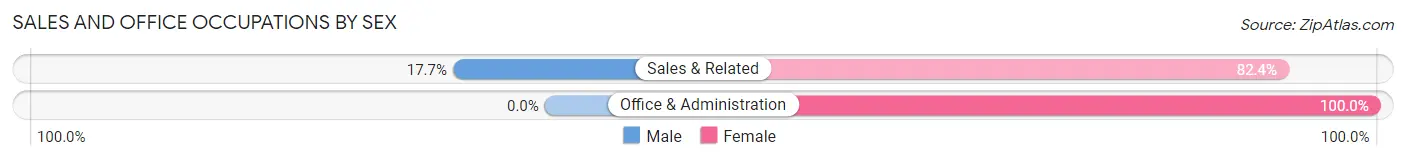
| Occupation | Male | Female |
| Sales & Related | 3 (17.6%) | 14 (82.4%) |
| Office & Administration | 0 (0.0%) | 42 (100.0%) |
| Total (Category) | 3 (5.1%) | 56 (94.9%) |
| Total (Overall) | 33 (18.6%) | 144 (81.4%) |
Natural Resources, Construction and Maintenance Occupations
The most common Natural Resources, Construction and Maintenance occupations in West Stewartstown are , and Construction & Extraction (21 | 11.9%).
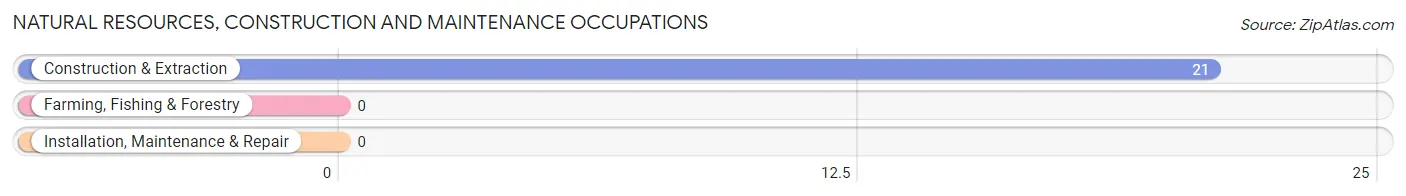
Natural Resources, Construction and Maintenance Occupations by Sex
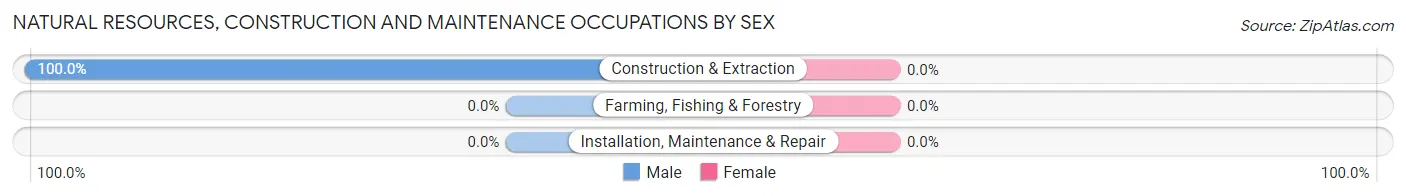
| Occupation | Male | Female |
| Farming, Fishing & Forestry | 0 (0.0%) | 0 (0.0%) |
| Construction & Extraction | 21 (100.0%) | 0 (0.0%) |
| Installation, Maintenance & Repair | 0 (0.0%) | 0 (0.0%) |
| Total (Category) | 21 (100.0%) | 0 (0.0%) |
| Total (Overall) | 33 (18.6%) | 144 (81.4%) |
Production, Transportation and Moving Occupations
The most common Production, Transportation and Moving occupations in West Stewartstown are Production (40 | 22.6%), and Material Moving (6 | 3.4%).
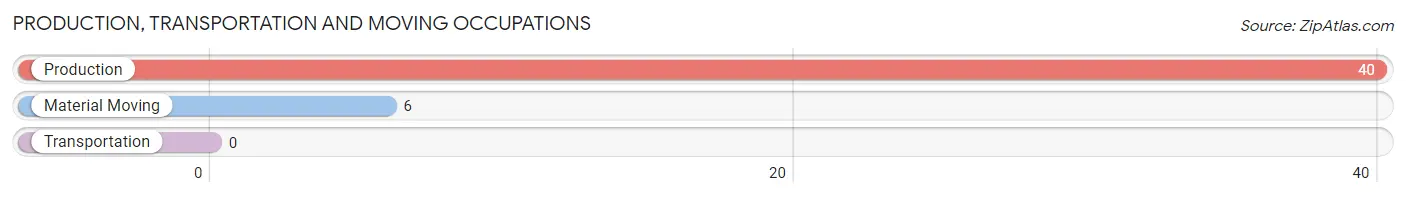
Production, Transportation and Moving Occupations by Sex
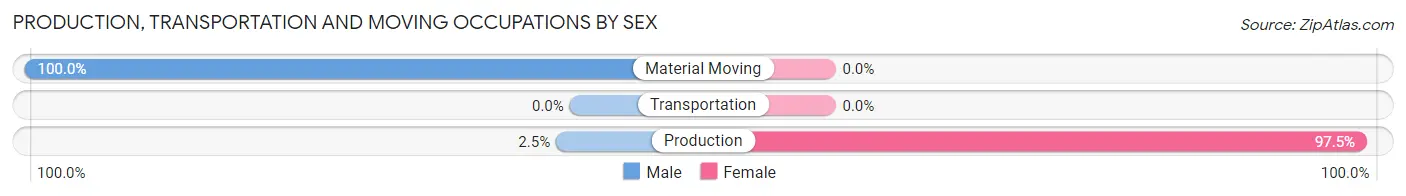
| Occupation | Male | Female |
| Production | 1 (2.5%) | 39 (97.5%) |
| Transportation | 0 (0.0%) | 0 (0.0%) |
| Material Moving | 6 (100.0%) | 0 (0.0%) |
| Total (Category) | 7 (15.2%) | 39 (84.8%) |
| Total (Overall) | 33 (18.6%) | 144 (81.4%) |
Employment Industries by Sex in West Stewartstown
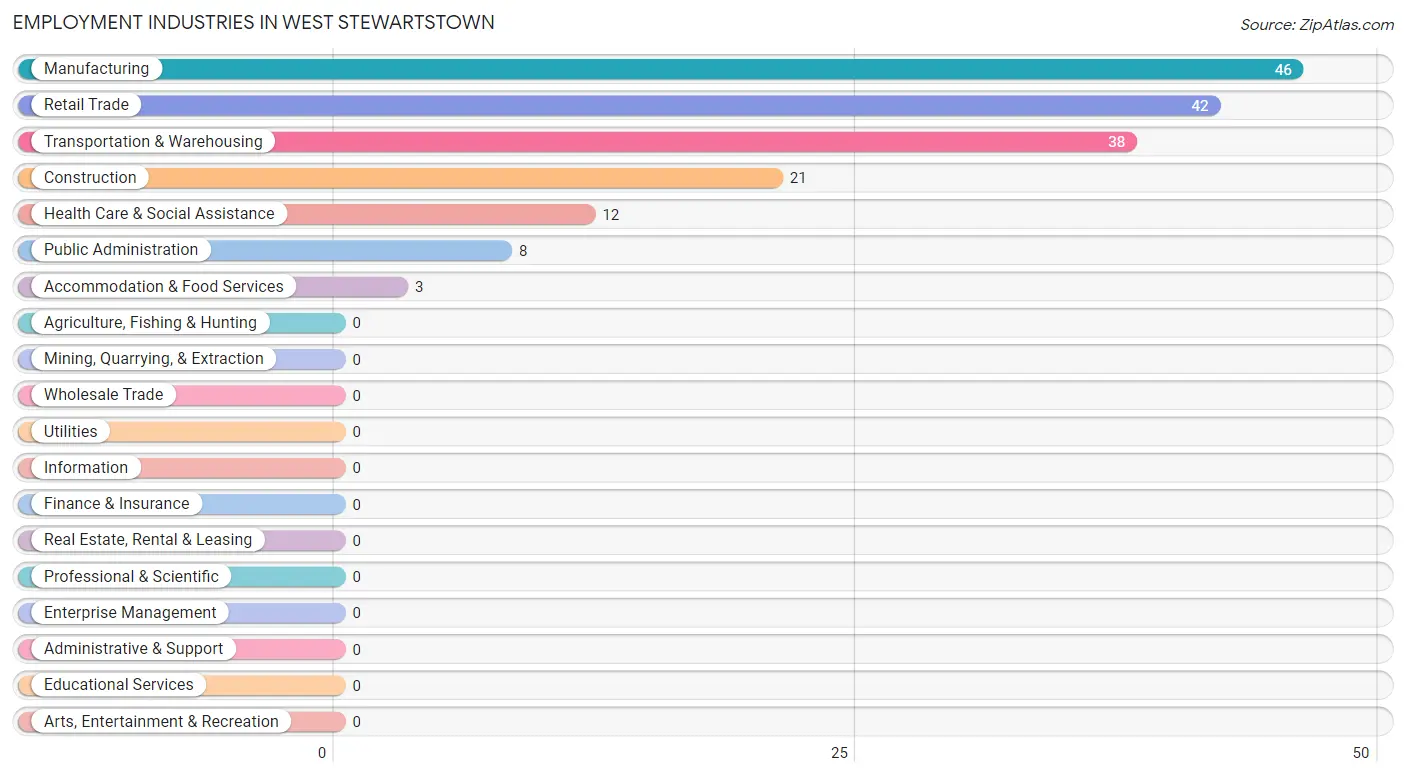
Employment Industries in West Stewartstown
The major employment industries in West Stewartstown include Manufacturing (46 | 26.0%), Retail Trade (42 | 23.7%), Transportation & Warehousing (38 | 21.5%), Construction (21 | 11.9%), and Health Care & Social Assistance (12 | 6.8%).
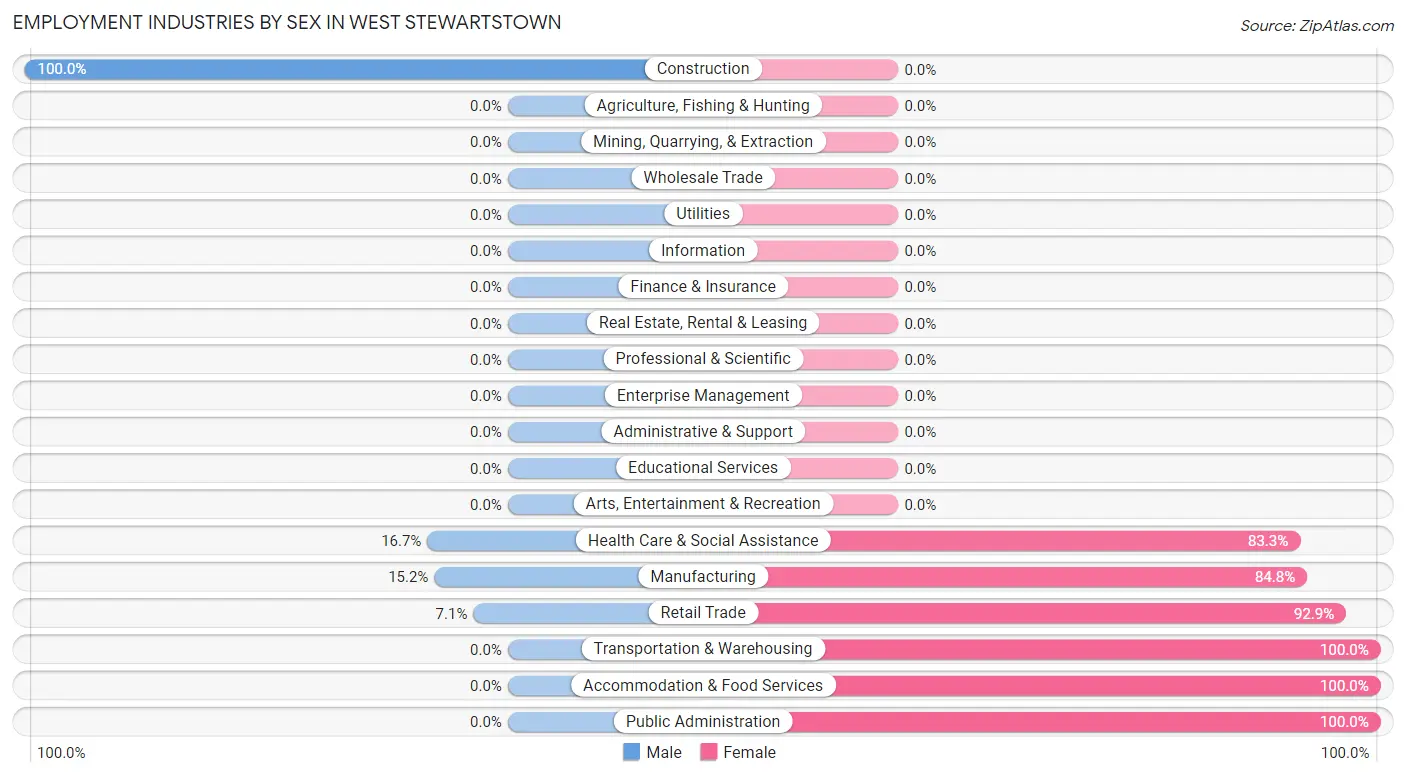
Employment Industries by Sex in West Stewartstown
The West Stewartstown industries that see more men than women are Construction (100.0%), Health Care & Social Assistance (16.7%), and Manufacturing (15.2%), whereas the industries that tend to have a higher number of women are Transportation & Warehousing (100.0%), Accommodation & Food Services (100.0%), and Public Administration (100.0%).
| Industry | Male | Female |
| Agriculture, Fishing & Hunting | 0 (0.0%) | 0 (0.0%) |
| Mining, Quarrying, & Extraction | 0 (0.0%) | 0 (0.0%) |
| Construction | 21 (100.0%) | 0 (0.0%) |
| Manufacturing | 7 (15.2%) | 39 (84.8%) |
| Wholesale Trade | 0 (0.0%) | 0 (0.0%) |
| Retail Trade | 3 (7.1%) | 39 (92.9%) |
| Transportation & Warehousing | 0 (0.0%) | 38 (100.0%) |
| Utilities | 0 (0.0%) | 0 (0.0%) |
| Information | 0 (0.0%) | 0 (0.0%) |
| Finance & Insurance | 0 (0.0%) | 0 (0.0%) |
| Real Estate, Rental & Leasing | 0 (0.0%) | 0 (0.0%) |
| Professional & Scientific | 0 (0.0%) | 0 (0.0%) |
| Enterprise Management | 0 (0.0%) | 0 (0.0%) |
| Administrative & Support | 0 (0.0%) | 0 (0.0%) |
| Educational Services | 0 (0.0%) | 0 (0.0%) |
| Health Care & Social Assistance | 2 (16.7%) | 10 (83.3%) |
| Arts, Entertainment & Recreation | 0 (0.0%) | 0 (0.0%) |
| Accommodation & Food Services | 0 (0.0%) | 3 (100.0%) |
| Public Administration | 0 (0.0%) | 8 (100.0%) |
| Total | 33 (18.6%) | 144 (81.4%) |
Education in West Stewartstown
School Enrollment in West Stewartstown
The most common levels of schooling among the 64 students in West Stewartstown are middle school (33 | 51.6%), nursery / preschool (12 | 18.8%), and elementary school (11 | 17.2%).

| School Level | # Students | % Students |
| Nursery / Preschool | 12 | 18.8% |
| Kindergarten | 0 | 0.0% |
| Elementary School | 11 | 17.2% |
| Middle School | 33 | 51.6% |
| High School | 8 | 12.5% |
| College / Undergraduate | 0 | 0.0% |
| Graduate / Professional | 0 | 0.0% |
| Total | 64 | 100.0% |
School Enrollment by Age by Funding Source in West Stewartstown
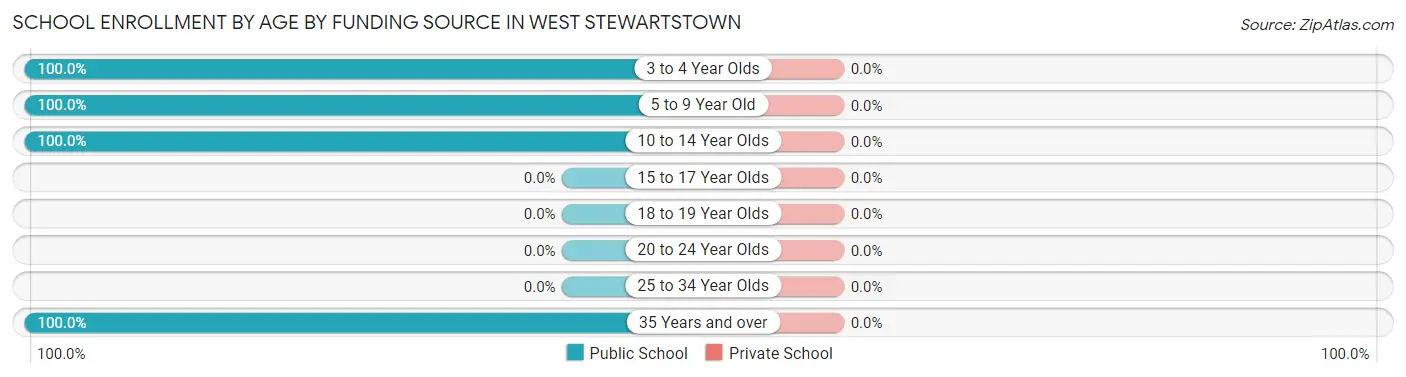
| Age Bracket | Public School | Private School |
| 3 to 4 Year Olds | 12 (100.0%) | 0 (0.0%) |
| 5 to 9 Year Old | 8 (100.0%) | 0 (0.0%) |
| 10 to 14 Year Olds | 38 (100.0%) | 0 (0.0%) |
| 15 to 17 Year Olds | 0 (0.0%) | 0 (0.0%) |
| 18 to 19 Year Olds | 0 (0.0%) | 0 (0.0%) |
| 20 to 24 Year Olds | 0 (0.0%) | 0 (0.0%) |
| 25 to 34 Year Olds | 0 (0.0%) | 0 (0.0%) |
| 35 Years and over | 6 (100.0%) | 0 (0.0%) |
| Total | 64 (100.0%) | 0 (0.0%) |
Educational Attainment by Field of Study in West Stewartstown
Business (20 | 58.8%), science & technology (6 | 17.6%), education (5 | 14.7%), and social sciences (3 | 8.8%) are the most common fields of study among 34 individuals in West Stewartstown who have obtained a bachelor's degree or higher.
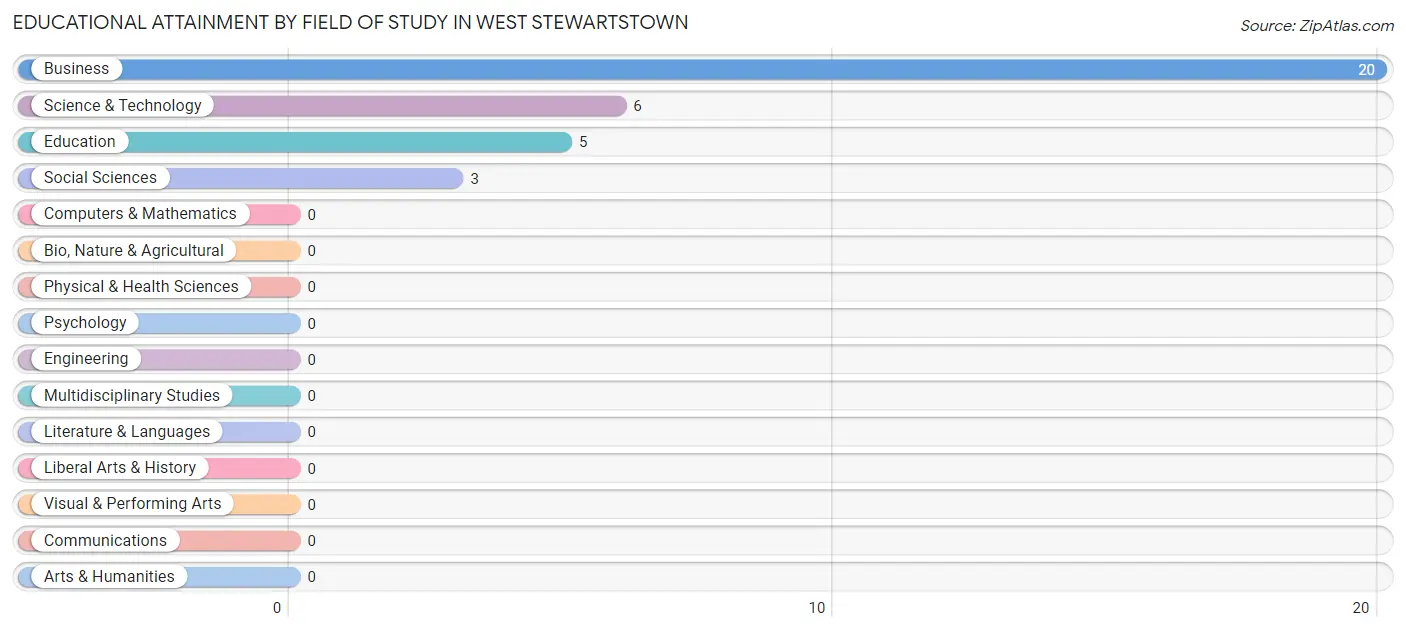
| Field of Study | # Graduates | % Graduates |
| Computers & Mathematics | 0 | 0.0% |
| Bio, Nature & Agricultural | 0 | 0.0% |
| Physical & Health Sciences | 0 | 0.0% |
| Psychology | 0 | 0.0% |
| Social Sciences | 3 | 8.8% |
| Engineering | 0 | 0.0% |
| Multidisciplinary Studies | 0 | 0.0% |
| Science & Technology | 6 | 17.6% |
| Business | 20 | 58.8% |
| Education | 5 | 14.7% |
| Literature & Languages | 0 | 0.0% |
| Liberal Arts & History | 0 | 0.0% |
| Visual & Performing Arts | 0 | 0.0% |
| Communications | 0 | 0.0% |
| Arts & Humanities | 0 | 0.0% |
| Total | 34 | 100.0% |
Transportation & Commute in West Stewartstown
Vehicle Availability by Sex in West Stewartstown
The most prevalent vehicle ownership categories in West Stewartstown are males with 2 vehicles (22, accounting for 66.7%) and females with 2 vehicles (134, making up 15.3%).
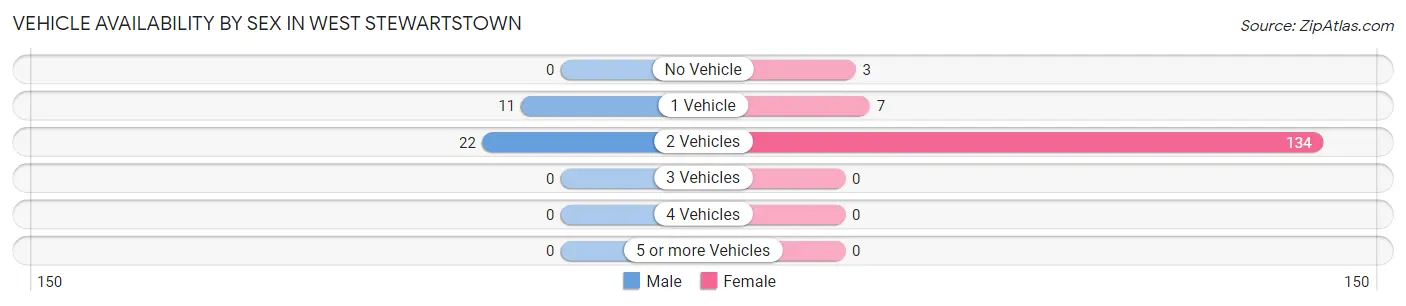
| Vehicles Available | Male | Female |
| No Vehicle | 0 (0.0%) | 3 (2.1%) |
| 1 Vehicle | 11 (33.3%) | 7 (4.9%) |
| 2 Vehicles | 22 (66.7%) | 134 (93.1%) |
| 3 Vehicles | 0 (0.0%) | 0 (0.0%) |
| 4 Vehicles | 0 (0.0%) | 0 (0.0%) |
| 5 or more Vehicles | 0 (0.0%) | 0 (0.0%) |
| Total | 33 (100.0%) | 144 (100.0%) |
Commute Time in West Stewartstown
The most frequently occuring commute durations in West Stewartstown are 10 to 14 minutes (49 commuters, 30.6%), 45 to 59 minutes (44 commuters, 27.5%), and 15 to 19 minutes (39 commuters, 24.4%).
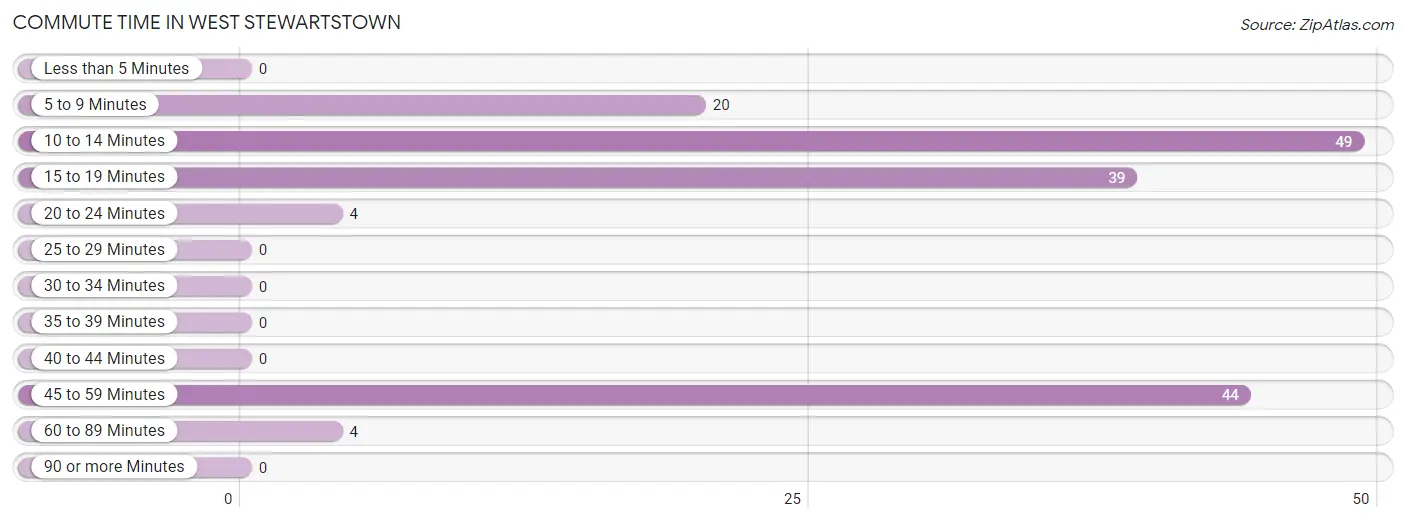
| Commute Time | # Commuters | % Commuters |
| Less than 5 Minutes | 0 | 0.0% |
| 5 to 9 Minutes | 20 | 12.5% |
| 10 to 14 Minutes | 49 | 30.6% |
| 15 to 19 Minutes | 39 | 24.4% |
| 20 to 24 Minutes | 4 | 2.5% |
| 25 to 29 Minutes | 0 | 0.0% |
| 30 to 34 Minutes | 0 | 0.0% |
| 35 to 39 Minutes | 0 | 0.0% |
| 40 to 44 Minutes | 0 | 0.0% |
| 45 to 59 Minutes | 44 | 27.5% |
| 60 to 89 Minutes | 4 | 2.5% |
| 90 or more Minutes | 0 | 0.0% |
Commute Time by Sex in West Stewartstown
The most common commute times in West Stewartstown are 10 to 14 minutes (14 commuters, 42.4%) for males and 15 to 19 minutes (39 commuters, 30.7%) for females.
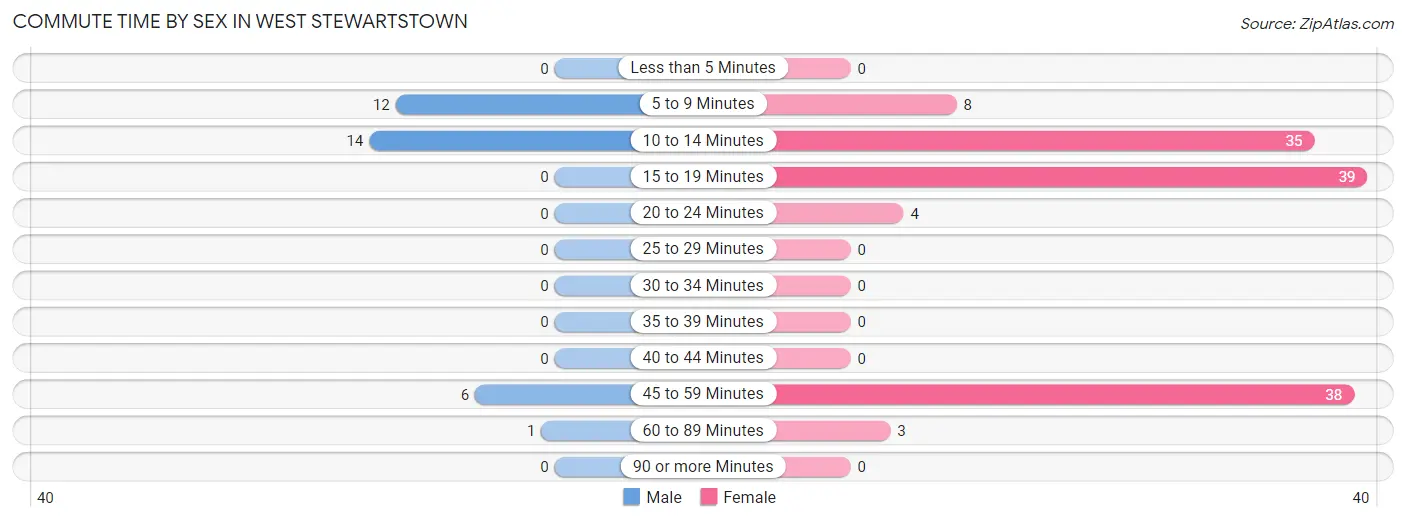
| Commute Time | Male | Female |
| Less than 5 Minutes | 0 (0.0%) | 0 (0.0%) |
| 5 to 9 Minutes | 12 (36.4%) | 8 (6.3%) |
| 10 to 14 Minutes | 14 (42.4%) | 35 (27.6%) |
| 15 to 19 Minutes | 0 (0.0%) | 39 (30.7%) |
| 20 to 24 Minutes | 0 (0.0%) | 4 (3.2%) |
| 25 to 29 Minutes | 0 (0.0%) | 0 (0.0%) |
| 30 to 34 Minutes | 0 (0.0%) | 0 (0.0%) |
| 35 to 39 Minutes | 0 (0.0%) | 0 (0.0%) |
| 40 to 44 Minutes | 0 (0.0%) | 0 (0.0%) |
| 45 to 59 Minutes | 6 (18.2%) | 38 (29.9%) |
| 60 to 89 Minutes | 1 (3.0%) | 3 (2.4%) |
| 90 or more Minutes | 0 (0.0%) | 0 (0.0%) |
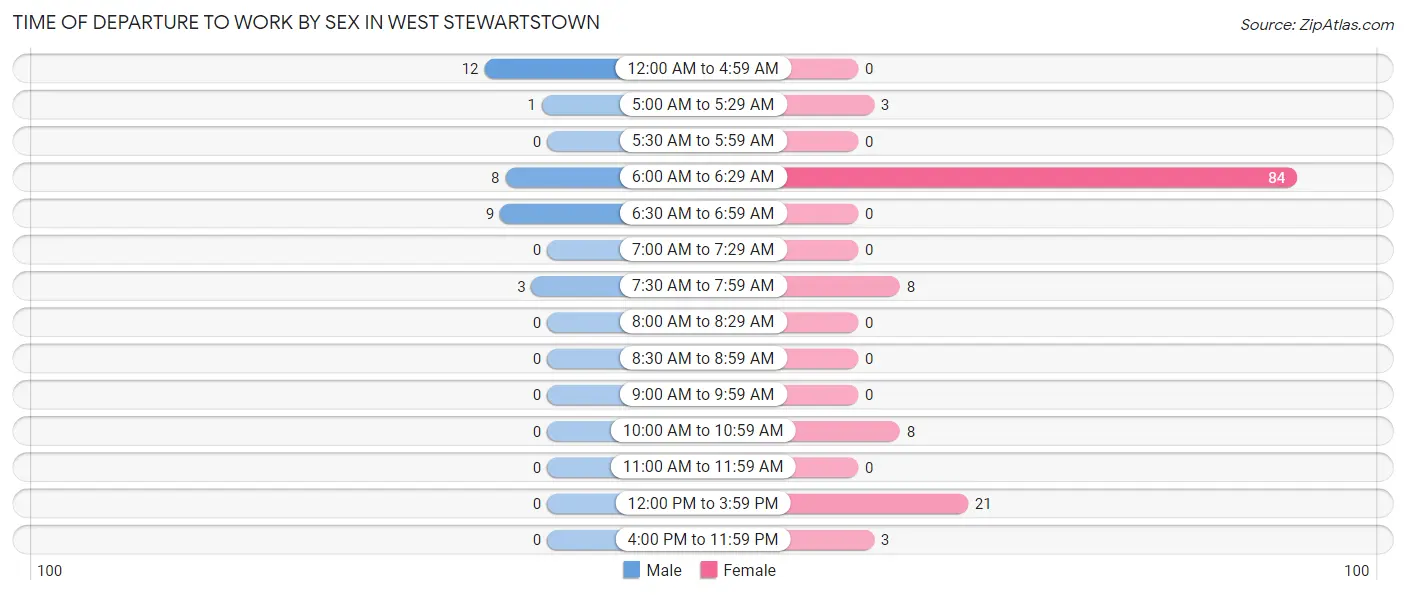
Time of Departure to Work by Sex in West Stewartstown
The most frequent times of departure to work in West Stewartstown are 12:00 AM to 4:59 AM (12, 36.4%) for males and 6:00 AM to 6:29 AM (84, 66.1%) for females.
| Time of Departure | Male | Female |
| 12:00 AM to 4:59 AM | 12 (36.4%) | 0 (0.0%) |
| 5:00 AM to 5:29 AM | 1 (3.0%) | 3 (2.4%) |
| 5:30 AM to 5:59 AM | 0 (0.0%) | 0 (0.0%) |
| 6:00 AM to 6:29 AM | 8 (24.2%) | 84 (66.1%) |
| 6:30 AM to 6:59 AM | 9 (27.3%) | 0 (0.0%) |
| 7:00 AM to 7:29 AM | 0 (0.0%) | 0 (0.0%) |
| 7:30 AM to 7:59 AM | 3 (9.1%) | 8 (6.3%) |
| 8:00 AM to 8:29 AM | 0 (0.0%) | 0 (0.0%) |
| 8:30 AM to 8:59 AM | 0 (0.0%) | 0 (0.0%) |
| 9:00 AM to 9:59 AM | 0 (0.0%) | 0 (0.0%) |
| 10:00 AM to 10:59 AM | 0 (0.0%) | 8 (6.3%) |
| 11:00 AM to 11:59 AM | 0 (0.0%) | 0 (0.0%) |
| 12:00 PM to 3:59 PM | 0 (0.0%) | 21 (16.5%) |
| 4:00 PM to 11:59 PM | 0 (0.0%) | 3 (2.4%) |
| Total | 33 (100.0%) | 127 (100.0%) |
Housing Occupancy in West Stewartstown
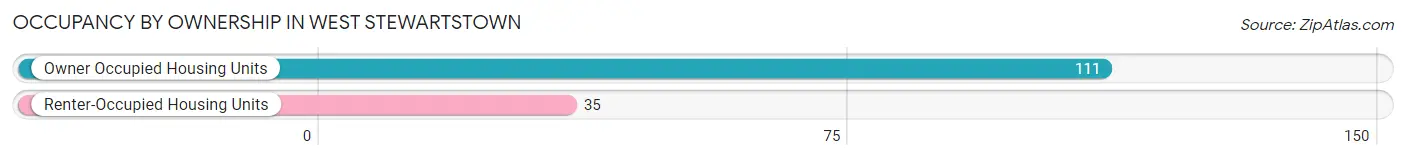
Occupancy by Ownership in West Stewartstown
Of the total 146 dwellings in West Stewartstown, owner-occupied units account for 111 (76.0%), while renter-occupied units make up 35 (24.0%).
| Occupancy | # Housing Units | % Housing Units |
| Owner Occupied Housing Units | 111 | 76.0% |
| Renter-Occupied Housing Units | 35 | 24.0% |
| Total Occupied Housing Units | 146 | 100.0% |
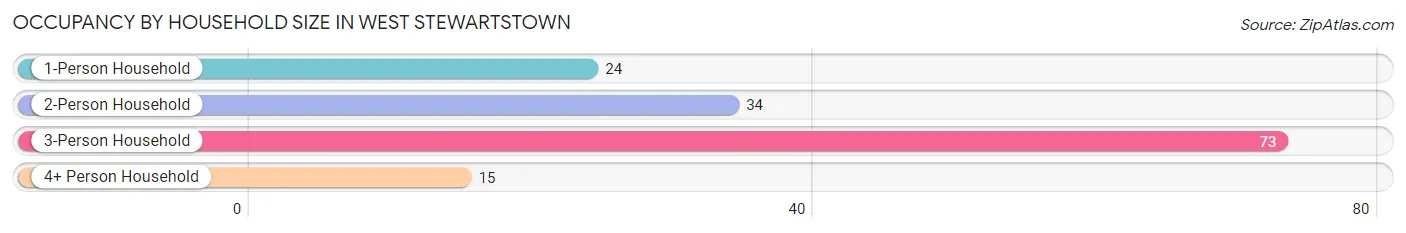
Occupancy by Household Size in West Stewartstown
| Household Size | # Housing Units | % Housing Units |
| 1-Person Household | 24 | 16.4% |
| 2-Person Household | 34 | 23.3% |
| 3-Person Household | 73 | 50.0% |
| 4+ Person Household | 15 | 10.3% |
| Total Housing Units | 146 | 100.0% |
Occupancy by Ownership by Household Size in West Stewartstown
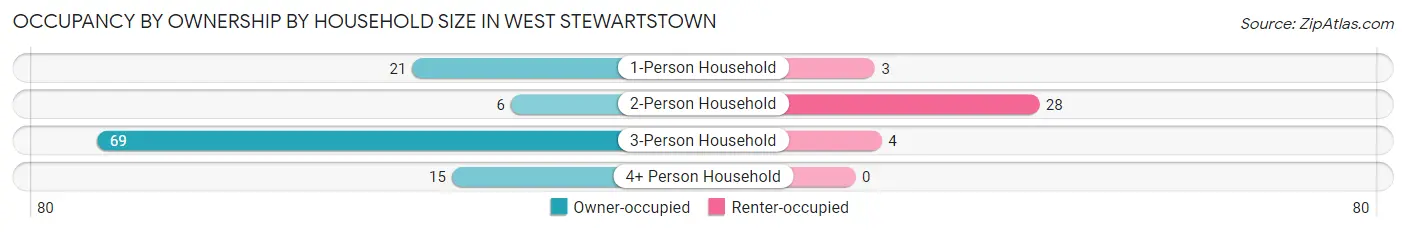
| Household Size | Owner-occupied | Renter-occupied |
| 1-Person Household | 21 (87.5%) | 3 (12.5%) |
| 2-Person Household | 6 (17.6%) | 28 (82.4%) |
| 3-Person Household | 69 (94.5%) | 4 (5.5%) |
| 4+ Person Household | 15 (100.0%) | 0 (0.0%) |
| Total Housing Units | 111 (76.0%) | 35 (24.0%) |
Occupancy by Educational Attainment in West Stewartstown
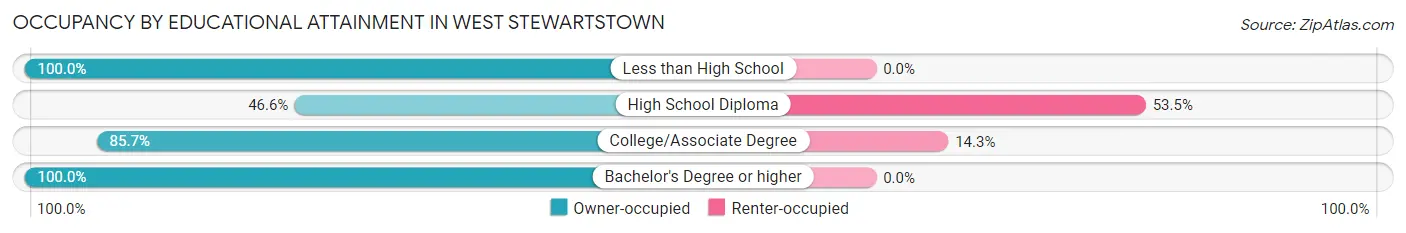
| Household Size | Owner-occupied | Renter-occupied |
| Less than High School | 39 (100.0%) | 0 (0.0%) |
| High School Diploma | 27 (46.6%) | 31 (53.4%) |
| College/Associate Degree | 24 (85.7%) | 4 (14.3%) |
| Bachelor's Degree or higher | 21 (100.0%) | 0 (0.0%) |
Occupancy by Age of Householder in West Stewartstown
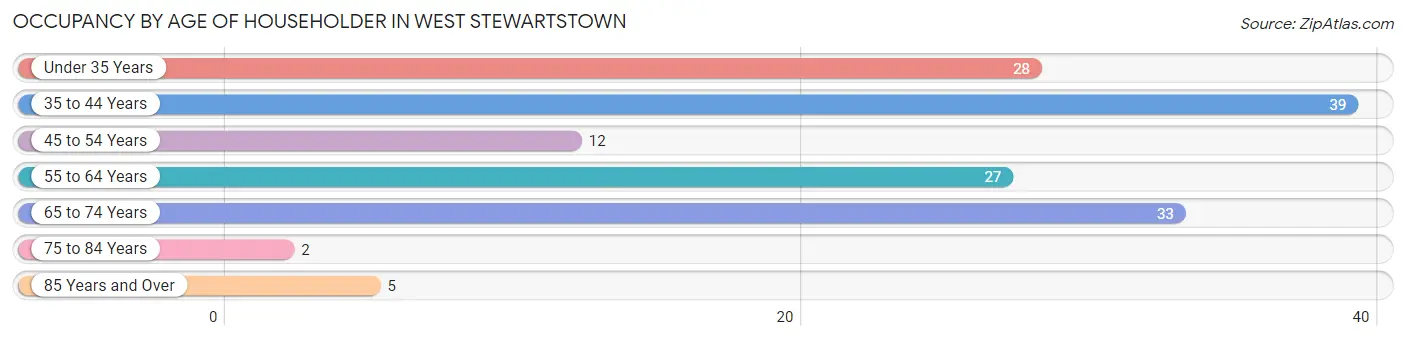
| Age Bracket | # Households | % Households |
| Under 35 Years | 28 | 19.2% |
| 35 to 44 Years | 39 | 26.7% |
| 45 to 54 Years | 12 | 8.2% |
| 55 to 64 Years | 27 | 18.5% |
| 65 to 74 Years | 33 | 22.6% |
| 75 to 84 Years | 2 | 1.4% |
| 85 Years and Over | 5 | 3.4% |
| Total | 146 | 100.0% |
Housing Finances in West Stewartstown
Median Income by Occupancy in West Stewartstown
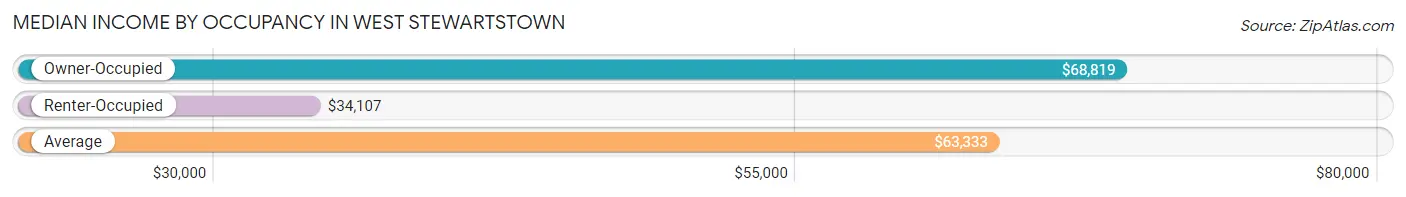
| Occupancy Type | # Households | Median Income |
| Owner-Occupied | 111 (76.0%) | $68,819 |
| Renter-Occupied | 35 (24.0%) | $34,107 |
| Average | 146 (100.0%) | $63,333 |
Occupancy by Householder Income Bracket in West Stewartstown
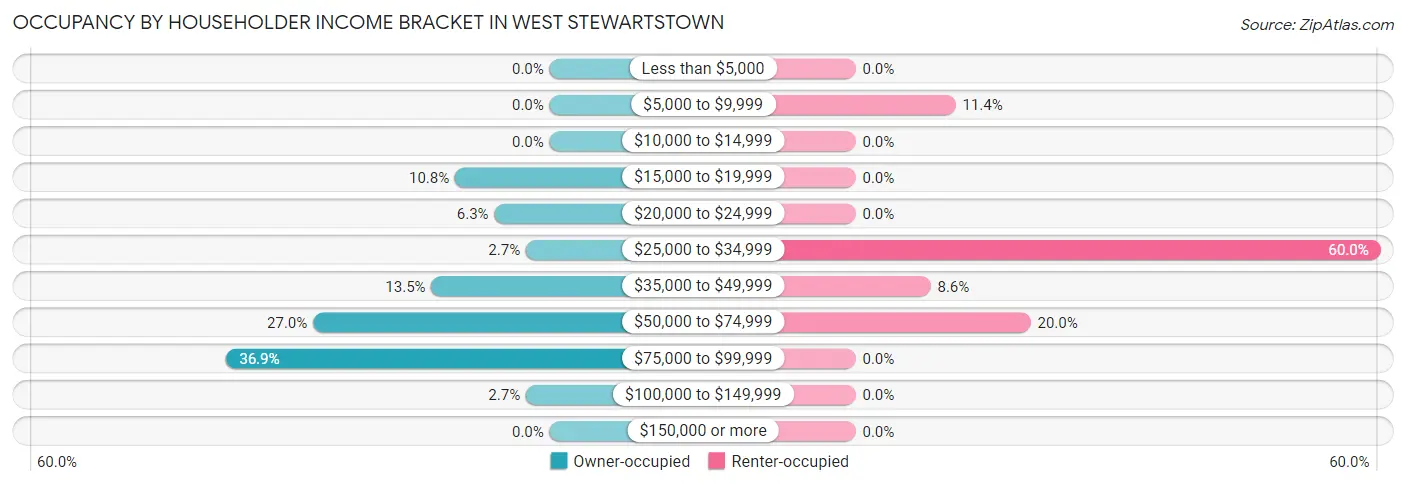
| Income Bracket | Owner-occupied | Renter-occupied |
| Less than $5,000 | 0 (0.0%) | 0 (0.0%) |
| $5,000 to $9,999 | 0 (0.0%) | 4 (11.4%) |
| $10,000 to $14,999 | 0 (0.0%) | 0 (0.0%) |
| $15,000 to $19,999 | 12 (10.8%) | 0 (0.0%) |
| $20,000 to $24,999 | 7 (6.3%) | 0 (0.0%) |
| $25,000 to $34,999 | 3 (2.7%) | 21 (60.0%) |
| $35,000 to $49,999 | 15 (13.5%) | 3 (8.6%) |
| $50,000 to $74,999 | 30 (27.0%) | 7 (20.0%) |
| $75,000 to $99,999 | 41 (36.9%) | 0 (0.0%) |
| $100,000 to $149,999 | 3 (2.7%) | 0 (0.0%) |
| $150,000 or more | 0 (0.0%) | 0 (0.0%) |
| Total | 111 (100.0%) | 35 (100.0%) |
Monthly Housing Cost Tiers in West Stewartstown
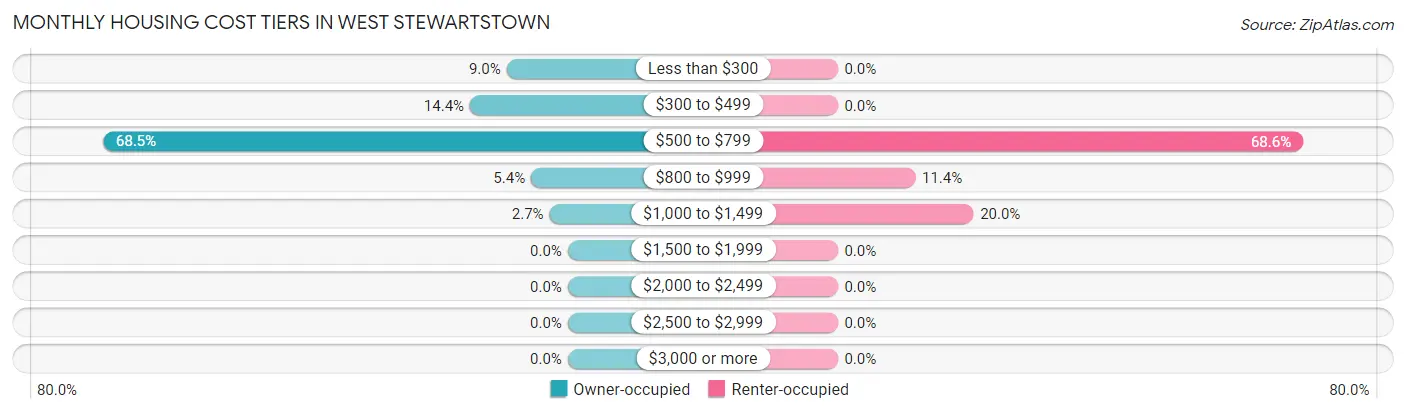
| Monthly Cost | Owner-occupied | Renter-occupied |
| Less than $300 | 10 (9.0%) | 0 (0.0%) |
| $300 to $499 | 16 (14.4%) | 0 (0.0%) |
| $500 to $799 | 76 (68.5%) | 24 (68.6%) |
| $800 to $999 | 6 (5.4%) | 4 (11.4%) |
| $1,000 to $1,499 | 3 (2.7%) | 7 (20.0%) |
| $1,500 to $1,999 | 0 (0.0%) | 0 (0.0%) |
| $2,000 to $2,499 | 0 (0.0%) | 0 (0.0%) |
| $2,500 to $2,999 | 0 (0.0%) | 0 (0.0%) |
| $3,000 or more | 0 (0.0%) | 0 (0.0%) |
| Total | 111 (100.0%) | 35 (100.0%) |
Physical Housing Characteristics in West Stewartstown
Housing Structures in West Stewartstown
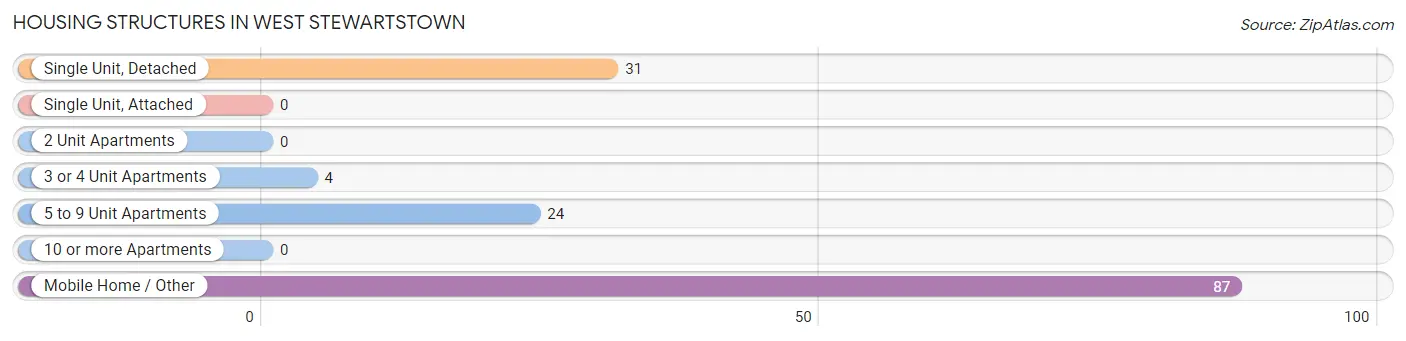
| Structure Type | # Housing Units | % Housing Units |
| Single Unit, Detached | 31 | 21.2% |
| Single Unit, Attached | 0 | 0.0% |
| 2 Unit Apartments | 0 | 0.0% |
| 3 or 4 Unit Apartments | 4 | 2.7% |
| 5 to 9 Unit Apartments | 24 | 16.4% |
| 10 or more Apartments | 0 | 0.0% |
| Mobile Home / Other | 87 | 59.6% |
| Total | 146 | 100.0% |
Housing Structures by Occupancy in West Stewartstown
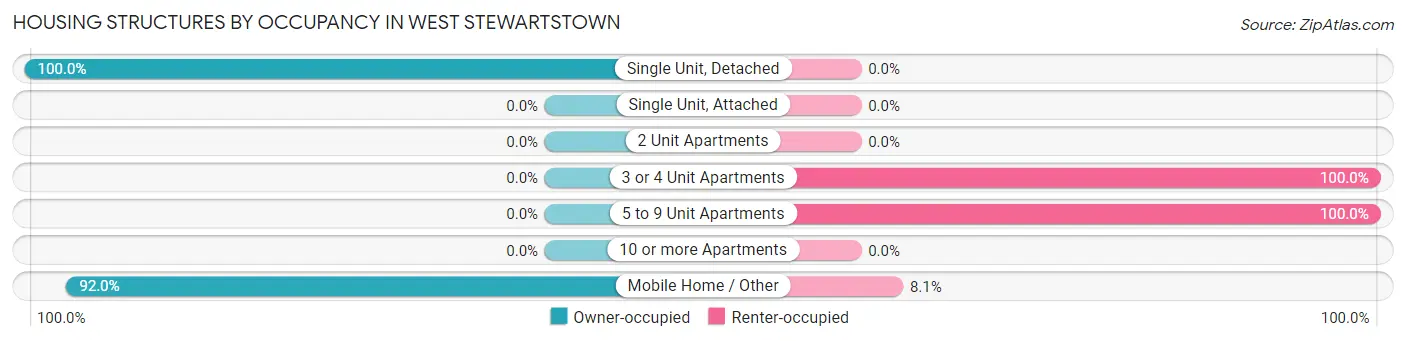
| Structure Type | Owner-occupied | Renter-occupied |
| Single Unit, Detached | 31 (100.0%) | 0 (0.0%) |
| Single Unit, Attached | 0 (0.0%) | 0 (0.0%) |
| 2 Unit Apartments | 0 (0.0%) | 0 (0.0%) |
| 3 or 4 Unit Apartments | 0 (0.0%) | 4 (100.0%) |
| 5 to 9 Unit Apartments | 0 (0.0%) | 24 (100.0%) |
| 10 or more Apartments | 0 (0.0%) | 0 (0.0%) |
| Mobile Home / Other | 80 (91.9%) | 7 (8.1%) |
| Total | 111 (76.0%) | 35 (24.0%) |
Housing Structures by Number of Rooms in West Stewartstown
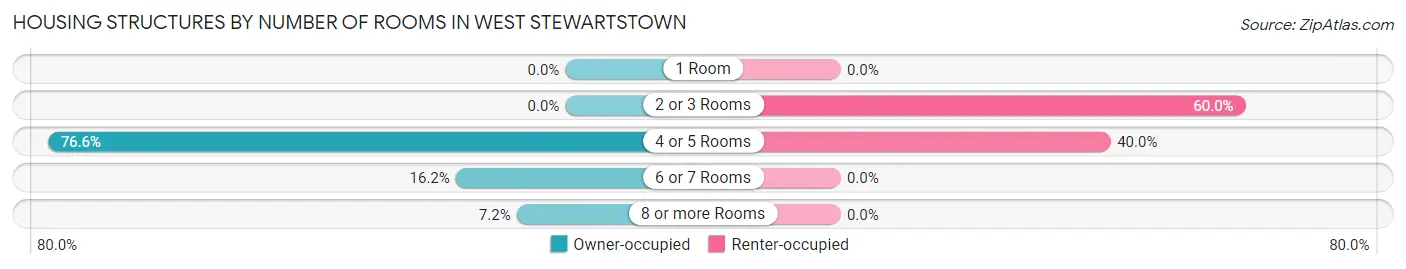
| Number of Rooms | Owner-occupied | Renter-occupied |
| 1 Room | 0 (0.0%) | 0 (0.0%) |
| 2 or 3 Rooms | 0 (0.0%) | 21 (60.0%) |
| 4 or 5 Rooms | 85 (76.6%) | 14 (40.0%) |
| 6 or 7 Rooms | 18 (16.2%) | 0 (0.0%) |
| 8 or more Rooms | 8 (7.2%) | 0 (0.0%) |
| Total | 111 (100.0%) | 35 (100.0%) |
Housing Structure by Heating Type in West Stewartstown
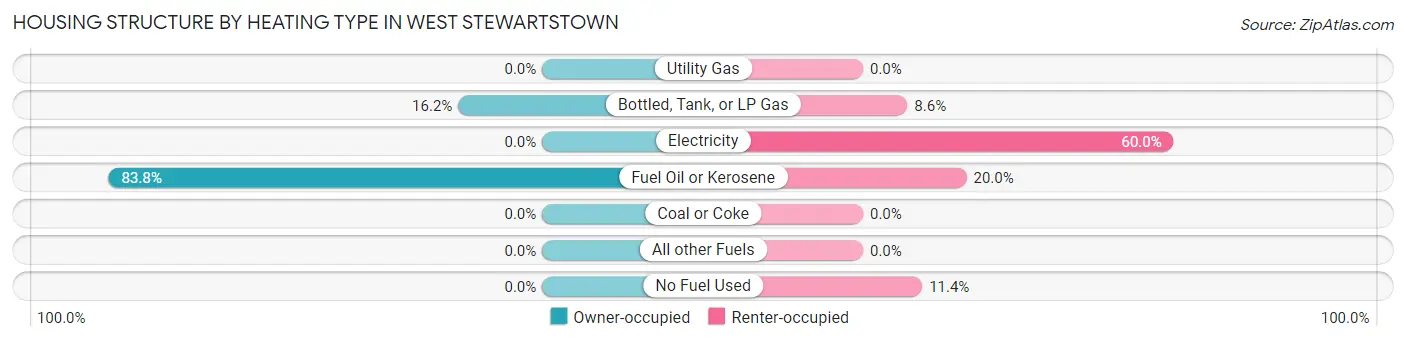
| Heating Type | Owner-occupied | Renter-occupied |
| Utility Gas | 0 (0.0%) | 0 (0.0%) |
| Bottled, Tank, or LP Gas | 18 (16.2%) | 3 (8.6%) |
| Electricity | 0 (0.0%) | 21 (60.0%) |
| Fuel Oil or Kerosene | 93 (83.8%) | 7 (20.0%) |
| Coal or Coke | 0 (0.0%) | 0 (0.0%) |
| All other Fuels | 0 (0.0%) | 0 (0.0%) |
| No Fuel Used | 0 (0.0%) | 4 (11.4%) |
| Total | 111 (100.0%) | 35 (100.0%) |
Household Vehicle Usage in West Stewartstown
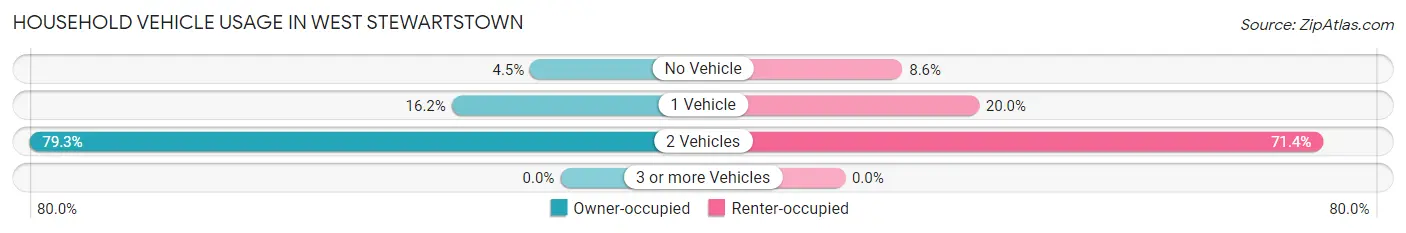
| Vehicles per Household | Owner-occupied | Renter-occupied |
| No Vehicle | 5 (4.5%) | 3 (8.6%) |
| 1 Vehicle | 18 (16.2%) | 7 (20.0%) |
| 2 Vehicles | 88 (79.3%) | 25 (71.4%) |
| 3 or more Vehicles | 0 (0.0%) | 0 (0.0%) |
| Total | 111 (100.0%) | 35 (100.0%) |
Real Estate & Mortgages in West Stewartstown
Real Estate and Mortgage Overview in West Stewartstown
| Characteristic | Without Mortgage | With Mortgage |
| Housing Units | 106 | 5 |
| Median Property Value | - | - |
| Median Household Income | $69,167 | $0 |
| Monthly Housing Costs | $560 | $0 |
| Real Estate Taxes | $903 | $0 |
Property Value by Mortgage Status in West Stewartstown
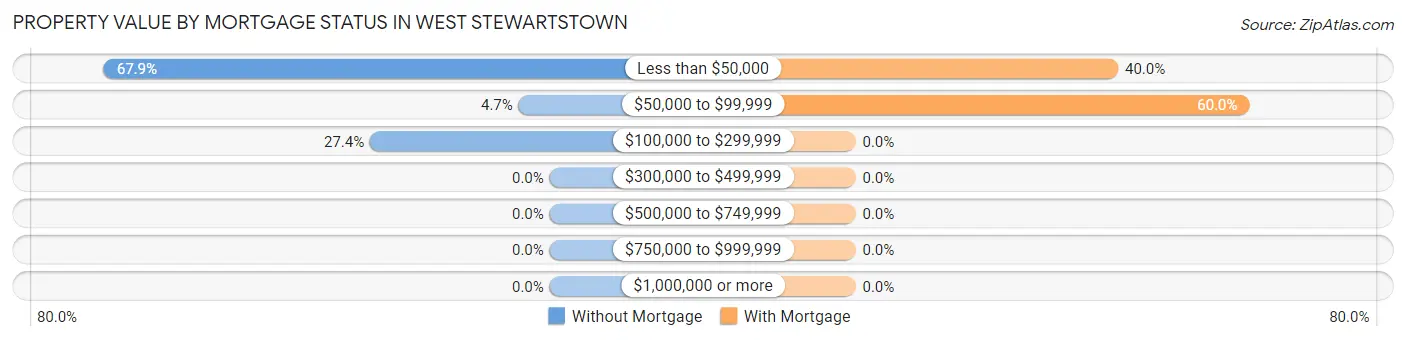
| Property Value | Without Mortgage | With Mortgage |
| Less than $50,000 | 72 (67.9%) | 2 (40.0%) |
| $50,000 to $99,999 | 5 (4.7%) | 3 (60.0%) |
| $100,000 to $299,999 | 29 (27.4%) | 0 (0.0%) |
| $300,000 to $499,999 | 0 (0.0%) | 0 (0.0%) |
| $500,000 to $749,999 | 0 (0.0%) | 0 (0.0%) |
| $750,000 to $999,999 | 0 (0.0%) | 0 (0.0%) |
| $1,000,000 or more | 0 (0.0%) | 0 (0.0%) |
| Total | 106 (100.0%) | 5 (100.0%) |
Household Income by Mortgage Status in West Stewartstown
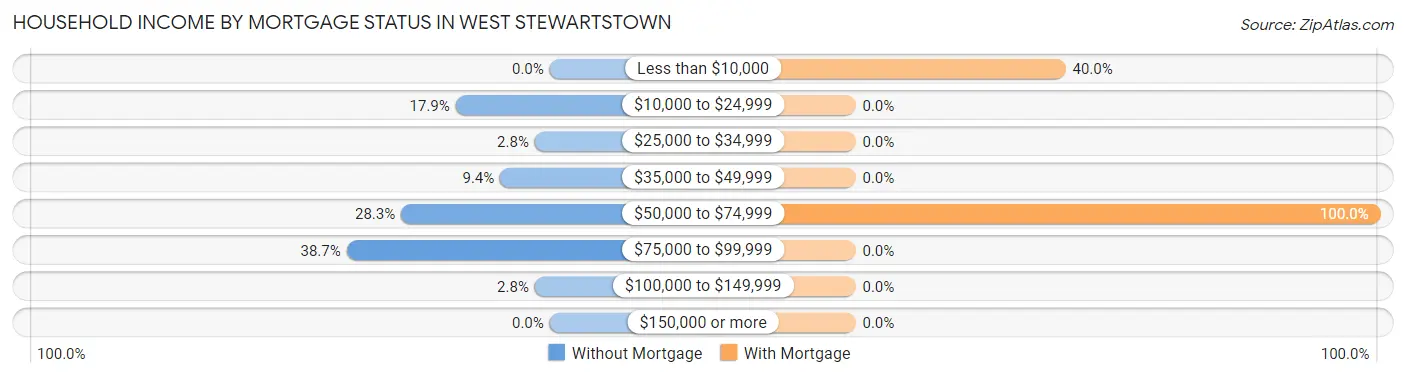
| Household Income | Without Mortgage | With Mortgage |
| Less than $10,000 | 0 (0.0%) | 2 (40.0%) |
| $10,000 to $24,999 | 19 (17.9%) | 0 (0.0%) |
| $25,000 to $34,999 | 3 (2.8%) | 0 (0.0%) |
| $35,000 to $49,999 | 10 (9.4%) | 0 (0.0%) |
| $50,000 to $74,999 | 30 (28.3%) | 5 (100.0%) |
| $75,000 to $99,999 | 41 (38.7%) | 0 (0.0%) |
| $100,000 to $149,999 | 3 (2.8%) | 0 (0.0%) |
| $150,000 or more | 0 (0.0%) | 0 (0.0%) |
| Total | 106 (100.0%) | 5 (100.0%) |
Property Value to Household Income Ratio in West Stewartstown
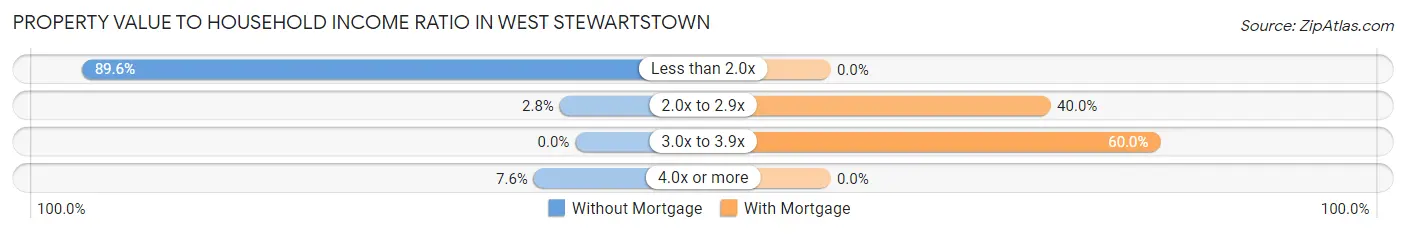
| Value-to-Income Ratio | Without Mortgage | With Mortgage |
| Less than 2.0x | 95 (89.6%) | 0 (0.0%) |
| 2.0x to 2.9x | 3 (2.8%) | 2 (40.0%) |
| 3.0x to 3.9x | 0 (0.0%) | 3 (60.0%) |
| 4.0x or more | 8 (7.5%) | 0 (0.0%) |
| Total | 106 (100.0%) | 5 (100.0%) |
Real Estate Taxes by Mortgage Status in West Stewartstown
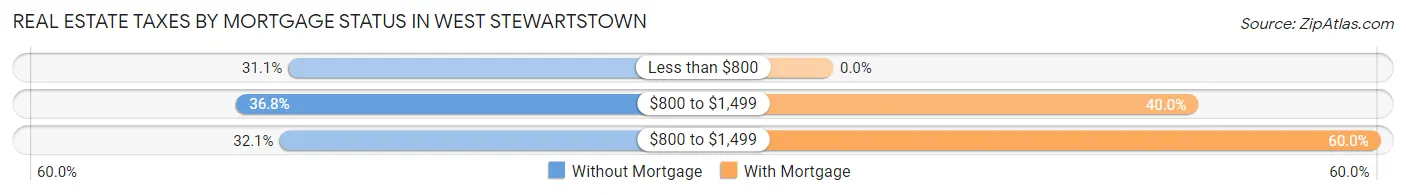
| Property Taxes | Without Mortgage | With Mortgage |
| Less than $800 | 33 (31.1%) | 0 (0.0%) |
| $800 to $1,499 | 39 (36.8%) | 2 (40.0%) |
| $800 to $1,499 | 34 (32.1%) | 3 (60.0%) |
| Total | 106 (100.0%) | 5 (100.0%) |
Health & Disability in West Stewartstown
Health Insurance Coverage by Age in West Stewartstown
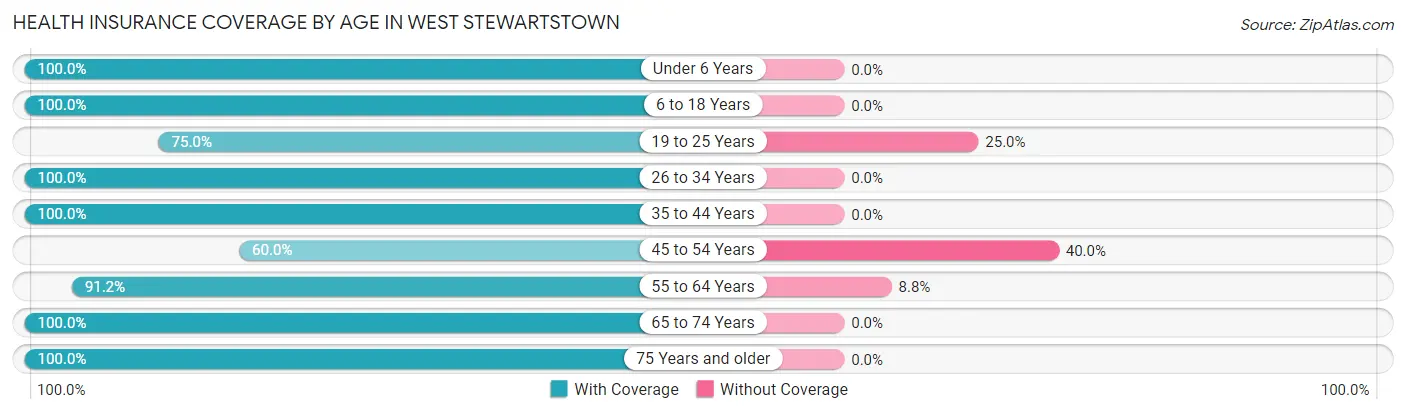
| Age Bracket | With Coverage | Without Coverage |
| Under 6 Years | 12 (100.0%) | 0 (0.0%) |
| 6 to 18 Years | 46 (100.0%) | 0 (0.0%) |
| 19 to 25 Years | 63 (75.0%) | 21 (25.0%) |
| 26 to 34 Years | 7 (100.0%) | 0 (0.0%) |
| 35 to 44 Years | 90 (100.0%) | 0 (0.0%) |
| 45 to 54 Years | 12 (60.0%) | 8 (40.0%) |
| 55 to 64 Years | 31 (91.2%) | 3 (8.8%) |
| 65 to 74 Years | 49 (100.0%) | 0 (0.0%) |
| 75 Years and older | 13 (100.0%) | 0 (0.0%) |
| Total | 323 (91.0%) | 32 (9.0%) |
Health Insurance Coverage by Citizenship Status in West Stewartstown
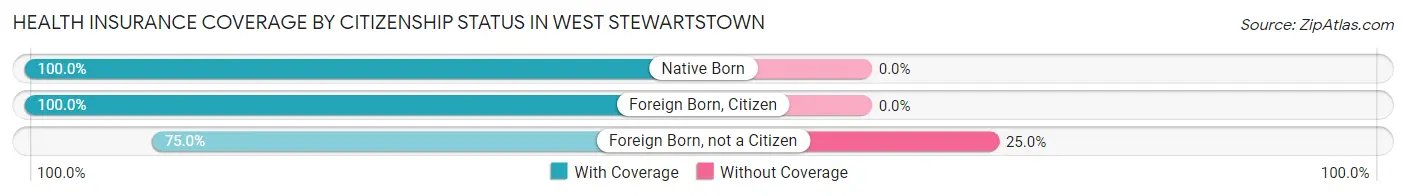
| Citizenship Status | With Coverage | Without Coverage |
| Native Born | 12 (100.0%) | 0 (0.0%) |
| Foreign Born, Citizen | 46 (100.0%) | 0 (0.0%) |
| Foreign Born, not a Citizen | 63 (75.0%) | 21 (25.0%) |
Health Insurance Coverage by Household Income in West Stewartstown
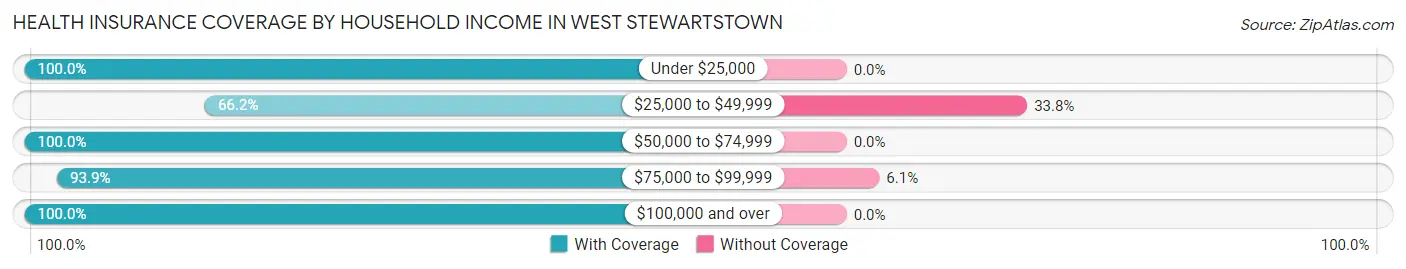
| Household Income | With Coverage | Without Coverage |
| Under $25,000 | 42 (100.0%) | 0 (0.0%) |
| $25,000 to $49,999 | 47 (66.2%) | 24 (33.8%) |
| $50,000 to $74,999 | 100 (100.0%) | 0 (0.0%) |
| $75,000 to $99,999 | 123 (93.9%) | 8 (6.1%) |
| $100,000 and over | 11 (100.0%) | 0 (0.0%) |
Public vs Private Health Insurance Coverage by Age in West Stewartstown
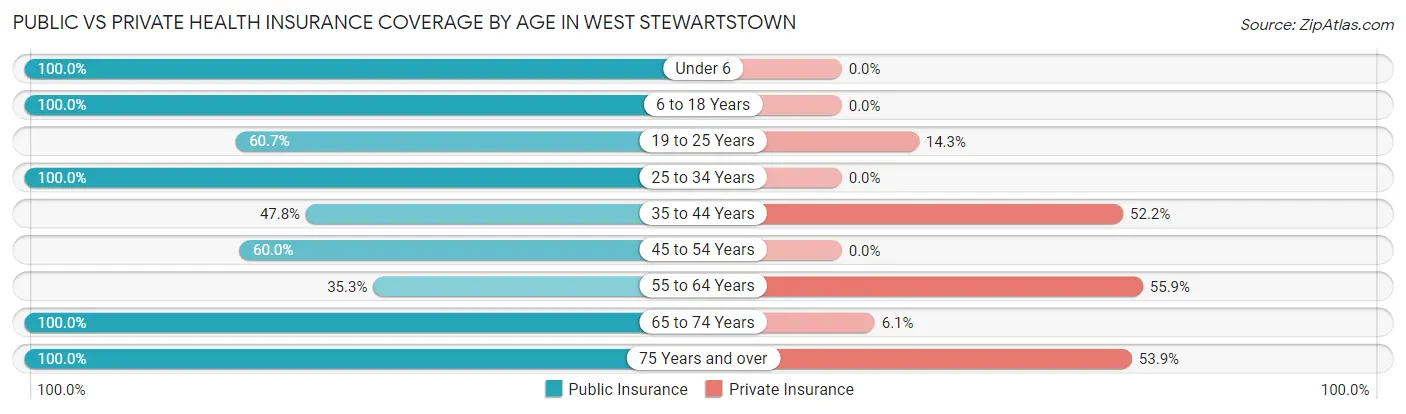
| Age Bracket | Public Insurance | Private Insurance |
| Under 6 | 12 (100.0%) | 0 (0.0%) |
| 6 to 18 Years | 46 (100.0%) | 0 (0.0%) |
| 19 to 25 Years | 51 (60.7%) | 12 (14.3%) |
| 25 to 34 Years | 7 (100.0%) | 0 (0.0%) |
| 35 to 44 Years | 43 (47.8%) | 47 (52.2%) |
| 45 to 54 Years | 12 (60.0%) | 0 (0.0%) |
| 55 to 64 Years | 12 (35.3%) | 19 (55.9%) |
| 65 to 74 Years | 49 (100.0%) | 3 (6.1%) |
| 75 Years and over | 13 (100.0%) | 7 (53.8%) |
| Total | 245 (69.0%) | 88 (24.8%) |
Disability Status by Sex by Age in West Stewartstown
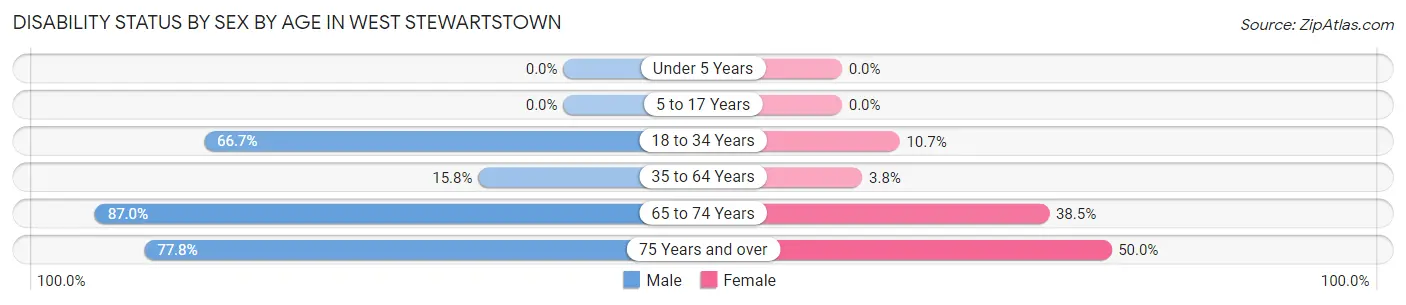
| Age Bracket | Male | Female |
| Under 5 Years | 0 (0.0%) | 0 (0.0%) |
| 5 to 17 Years | 0 (0.0%) | 0 (0.0%) |
| 18 to 34 Years | 42 (66.7%) | 3 (10.7%) |
| 35 to 64 Years | 6 (15.8%) | 4 (3.8%) |
| 65 to 74 Years | 20 (87.0%) | 10 (38.5%) |
| 75 Years and over | 7 (77.8%) | 2 (50.0%) |
Disability Class by Sex by Age in West Stewartstown
Disability Class: Hearing Difficulty
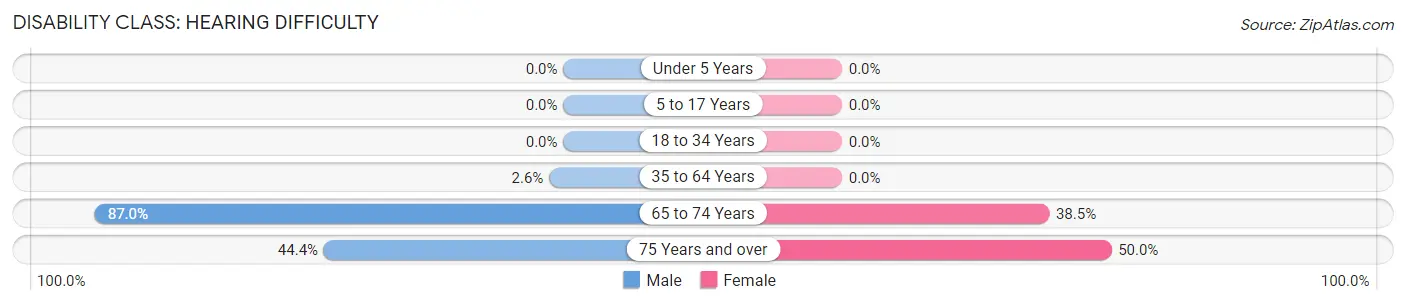
| Age Bracket | Male | Female |
| Under 5 Years | 0 (0.0%) | 0 (0.0%) |
| 5 to 17 Years | 0 (0.0%) | 0 (0.0%) |
| 18 to 34 Years | 0 (0.0%) | 0 (0.0%) |
| 35 to 64 Years | 1 (2.6%) | 0 (0.0%) |
| 65 to 74 Years | 20 (87.0%) | 10 (38.5%) |
| 75 Years and over | 4 (44.4%) | 2 (50.0%) |
Disability Class: Vision Difficulty
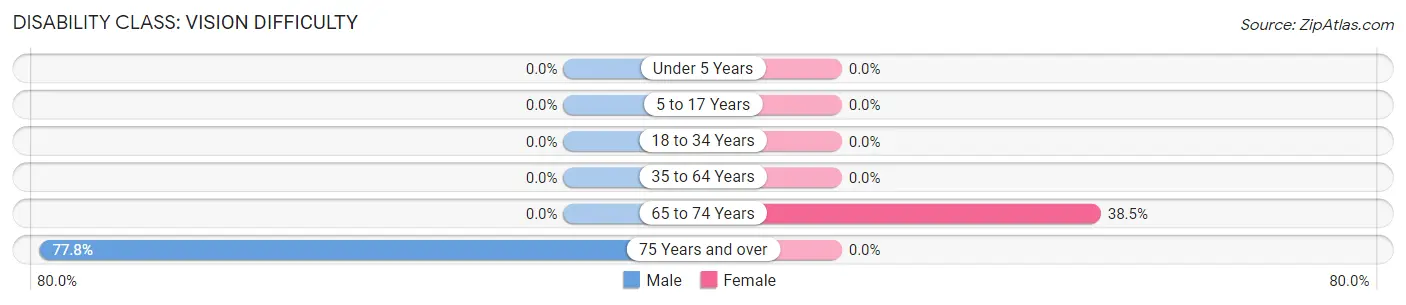
| Age Bracket | Male | Female |
| Under 5 Years | 0 (0.0%) | 0 (0.0%) |
| 5 to 17 Years | 0 (0.0%) | 0 (0.0%) |
| 18 to 34 Years | 0 (0.0%) | 0 (0.0%) |
| 35 to 64 Years | 0 (0.0%) | 0 (0.0%) |
| 65 to 74 Years | 0 (0.0%) | 10 (38.5%) |
| 75 Years and over | 7 (77.8%) | 0 (0.0%) |
Disability Class: Cognitive Difficulty
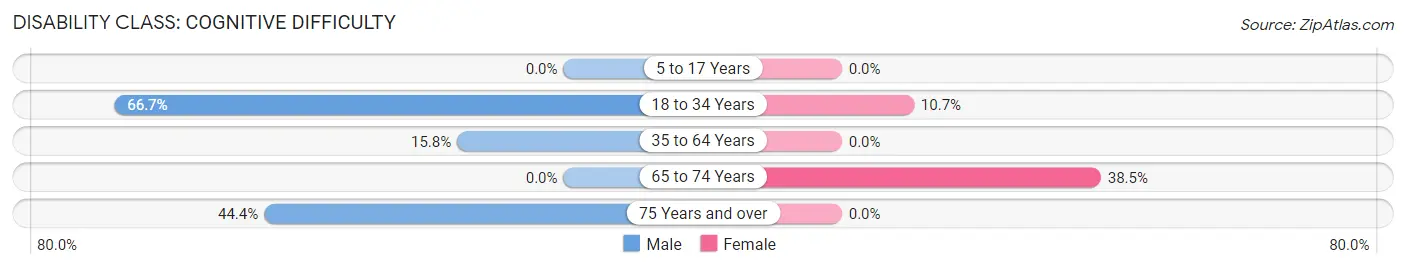
| Age Bracket | Male | Female |
| 5 to 17 Years | 0 (0.0%) | 0 (0.0%) |
| 18 to 34 Years | 42 (66.7%) | 3 (10.7%) |
| 35 to 64 Years | 6 (15.8%) | 0 (0.0%) |
| 65 to 74 Years | 0 (0.0%) | 10 (38.5%) |
| 75 Years and over | 4 (44.4%) | 0 (0.0%) |
Disability Class: Ambulatory Difficulty
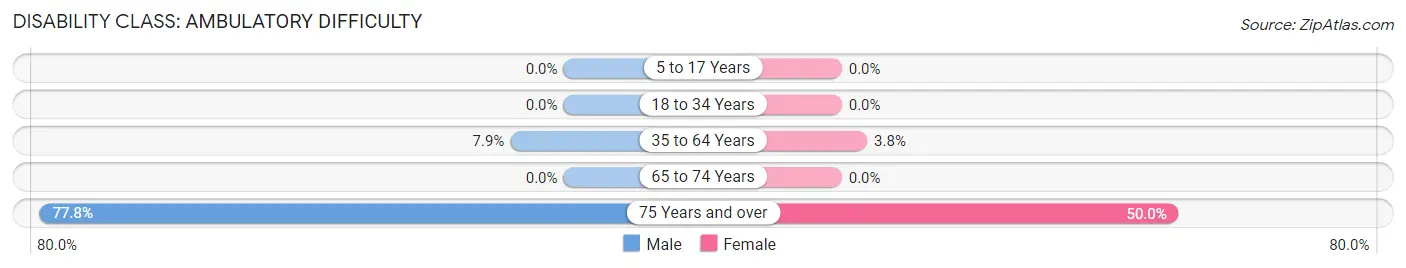
| Age Bracket | Male | Female |
| 5 to 17 Years | 0 (0.0%) | 0 (0.0%) |
| 18 to 34 Years | 0 (0.0%) | 0 (0.0%) |
| 35 to 64 Years | 3 (7.9%) | 4 (3.8%) |
| 65 to 74 Years | 0 (0.0%) | 0 (0.0%) |
| 75 Years and over | 7 (77.8%) | 2 (50.0%) |
Disability Class: Self-Care Difficulty
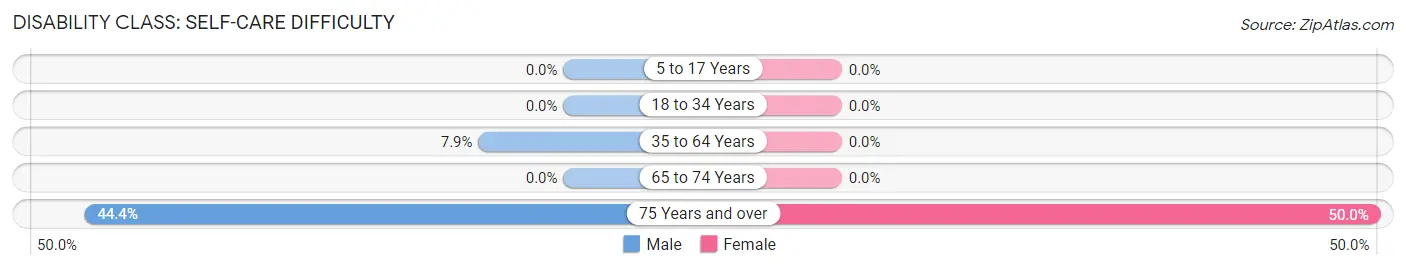
| Age Bracket | Male | Female |
| 5 to 17 Years | 0 (0.0%) | 0 (0.0%) |
| 18 to 34 Years | 0 (0.0%) | 0 (0.0%) |
| 35 to 64 Years | 3 (7.9%) | 0 (0.0%) |
| 65 to 74 Years | 0 (0.0%) | 0 (0.0%) |
| 75 Years and over | 4 (44.4%) | 2 (50.0%) |
Technology Access in West Stewartstown
Computing Device Access in West Stewartstown
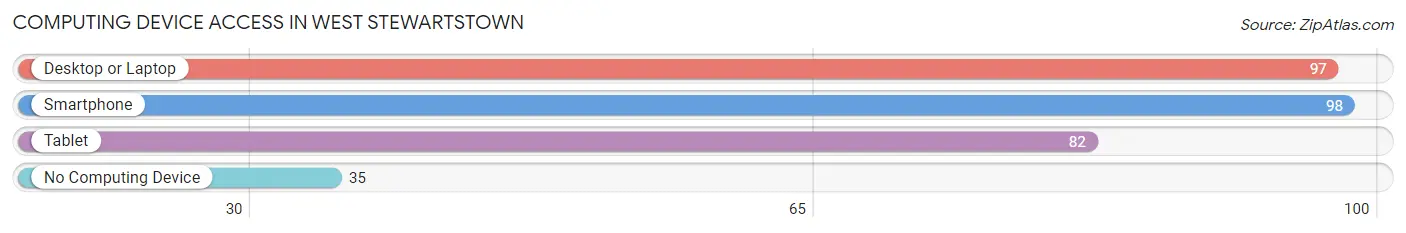
| Device Type | # Households | % Households |
| Desktop or Laptop | 97 | 66.4% |
| Smartphone | 98 | 67.1% |
| Tablet | 82 | 56.2% |
| No Computing Device | 35 | 24.0% |
| Total | 146 | 100.0% |
Internet Access in West Stewartstown
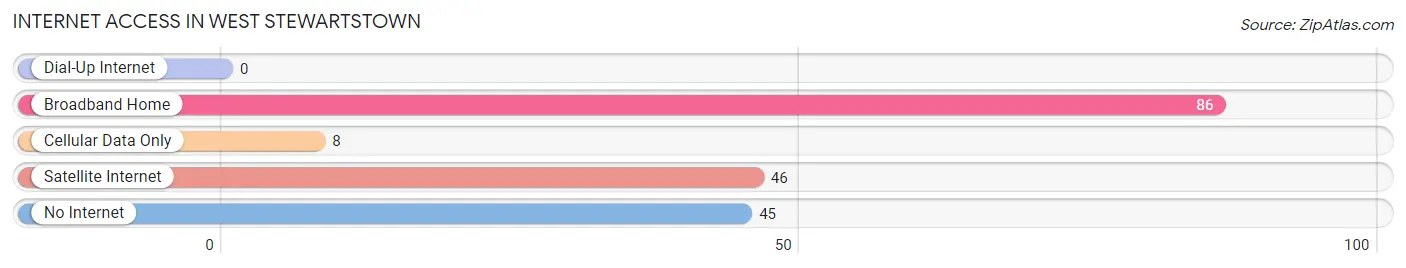
| Internet Type | # Households | % Households |
| Dial-Up Internet | 0 | 0.0% |
| Broadband Home | 86 | 58.9% |
| Cellular Data Only | 8 | 5.5% |
| Satellite Internet | 46 | 31.5% |
| No Internet | 45 | 30.8% |
| Total | 146 | 100.0% |
West Stewartstown Summary
Stewartstown, New Hampshire is a small town located in the northern part of the state, near the Canadian border. It is part of Coos County and is situated in the White Mountains region. The town was first settled in 1771 and was incorporated in 1795. The population of Stewartstown in 2000 was 545 people.
History
The first settlers of Stewartstown were from Massachusetts and Connecticut. They arrived in 1771 and were led by Captain John Stewart. The town was named after him. The settlers were attracted to the area due to its abundance of natural resources, such as timber and water.
The town was originally part of the town of Colebrook, but was incorporated as its own town in 1795. The first town meeting was held in 1796.
In the early 19th century, Stewartstown was a thriving agricultural community. The town was known for its dairy farms and orchards. The town also had several sawmills and gristmills.
In the late 19th century, the town began to decline due to the decline of the agricultural industry. The population decreased and many of the businesses closed.
In the early 20th century, the town began to experience a resurgence. The population increased and new businesses opened. The town also became a popular tourist destination due to its proximity to the White Mountains.
Geography
Stewartstown is located in the northern part of Coos County, near the Canadian border. It is situated in the White Mountains region of New Hampshire. The town is bordered by the towns of Colebrook to the north, Pittsburg to the east, Clarksville to the south, and West Stewartstown to the west.
The town is located in a mountainous region and is home to several peaks, including Mount Stewart, which is the highest peak in the town at 2,890 feet. The town is also home to several rivers and streams, including the Connecticut River, which forms the western border of the town.
Economy
The economy of Stewartstown is largely based on tourism. The town is a popular destination for outdoor activities, such as hiking, fishing, and camping. The town is also home to several ski resorts, which attract visitors from all over the region.
The town is also home to several small businesses, including restaurants, shops, and lodging. The town also has a small manufacturing sector, which produces wood products and other goods.
Demographics
The population of Stewartstown in 2000 was 545 people. The population has remained relatively stable over the past few decades. The town is predominantly white, with 95.3% of the population identifying as white. The town also has a small Hispanic population, with 2.2% of the population identifying as Hispanic or Latino.
The median household income in Stewartstown is $41,250, which is slightly lower than the state median of $50,711. The median home value in the town is $117,400, which is slightly lower than the state median of $170,400.
Conclusion
Stewartstown, New Hampshire is a small town located in the northern part of the state, near the Canadian border. It is part of Coos County and is situated in the White Mountains region. The town was first settled in 1771 and was incorporated in 1795. The population of Stewartstown in 2000 was 545 people. The economy of the town is largely based on tourism, with outdoor activities and ski resorts being popular attractions. The town is predominantly white, with 95.3% of the population identifying as white. The median household income in Stewartstown is $41,250, which is slightly lower than the state median of $50,711.
Common Questions
What is Per Capita Income in West Stewartstown?
Per Capita income in West Stewartstown is $19,105.
What is the Median Household income in West Stewartstown?
Median Household Income in West Stewartstown is $63,333.
What is Income or Wage Gap in West Stewartstown?
Income or Wage Gap in West Stewartstown is 64.0%.
Women in West Stewartstown earn 36.0 cents for every dollar earned by a man.
What is Inequality or Gini Index in West Stewartstown?
Inequality or Gini Index in West Stewartstown is 0.24.
What is the Total Population of West Stewartstown?
Total Population of West Stewartstown is 465.
What is the Total Male Population of West Stewartstown?
Total Male Population of West Stewartstown is 191.
What is the Total Female Population of West Stewartstown?
Total Female Population of West Stewartstown is 274.
What is the Ratio of Males per 100 Females in West Stewartstown?
There are 69.71 Males per 100 Females in West Stewartstown.
What is the Ratio of Females per 100 Males in West Stewartstown?
There are 143.46 Females per 100 Males in West Stewartstown.
What is the Median Population Age in West Stewartstown?
Median Population Age in West Stewartstown is 44.3 Years.
What is the Average Family Size in West Stewartstown
Average Family Size in West Stewartstown is 2.4 People.
What is the Average Household Size in West Stewartstown
Average Household Size in West Stewartstown is 2.4 People.
How Large is the Labor Force in West Stewartstown?
There are 194 People in the Labor Forcein in West Stewartstown.
What is the Percentage of People in the Labor Force in West Stewartstown?
47.7% of People are in the Labor Force in West Stewartstown.
What is the Unemployment Rate in West Stewartstown?
Unemployment Rate in West Stewartstown is 8.8%.