Zip Codes with the Highest Percentage of Population Employed in Food Preparation & Serving in Manchester, NH
RELATED REPORTS & OPTIONS
Food Preparation & Serving
Manchester
Compare Zip Codes
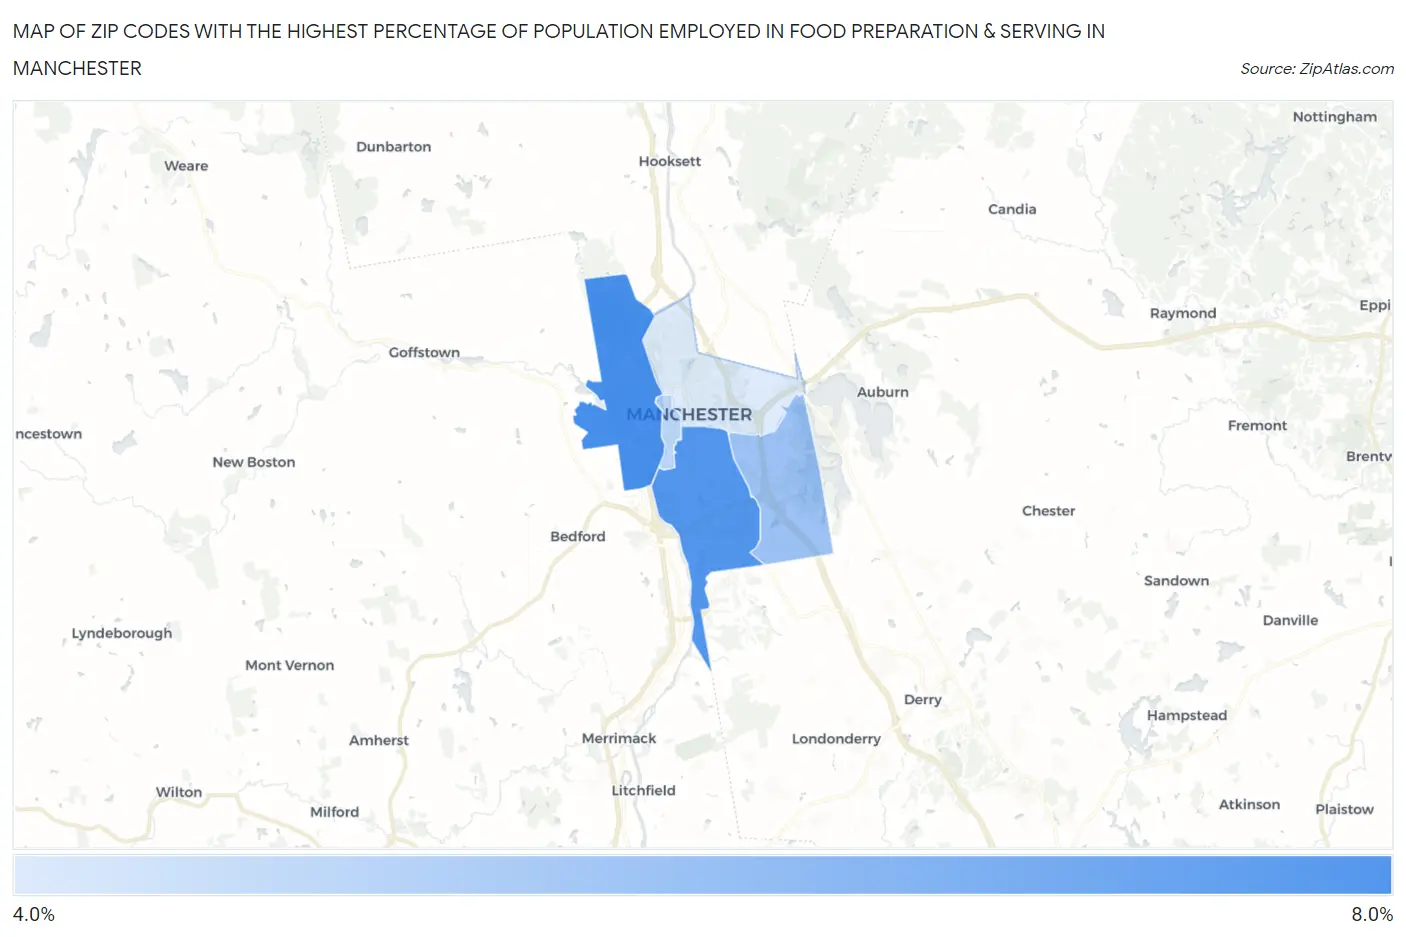
Map of Zip Codes with the Highest Percentage of Population Employed in Food Preparation & Serving in Manchester
4.3%
7.1%
Zip Codes with the Highest Percentage of Population Employed in Food Preparation & Serving in Manchester, NH
| Zip Code | % Employed | vs State | vs National | |
| 1. | 03102 | 7.1% | 5.2%(+1.95)#58 | 5.3%(+1.86)#6,236 |
| 2. | 03103 | 6.9% | 5.2%(+1.72)#66 | 5.3%(+1.63)#6,775 |
| 3. | 03109 | 5.5% | 5.2%(+0.325)#86 | 5.3%(+0.231)#11,010 |
| 4. | 03101 | 4.9% | 5.2%(-0.245)#100 | 5.3%(-0.339)#13,158 |
| 5. | 03104 | 4.3% | 5.2%(-0.902)#121 | 5.3%(-0.995)#15,923 |
1
Common Questions
What are the Top 3 Zip Codes with the Highest Percentage of Population Employed in Food Preparation & Serving in Manchester, NH?
Top 3 Zip Codes with the Highest Percentage of Population Employed in Food Preparation & Serving in Manchester, NH are:
What zip code has the Highest Percentage of Population Employed in Food Preparation & Serving in Manchester, NH?
03102 has the Highest Percentage of Population Employed in Food Preparation & Serving in Manchester, NH with 7.1%.
What is the Percentage of Population Employed in Food Preparation & Serving in Manchester, NH?
Percentage of Population Employed in Food Preparation & Serving in Manchester is 5.9%.
What is the Percentage of Population Employed in Food Preparation & Serving in New Hampshire?
Percentage of Population Employed in Food Preparation & Serving in New Hampshire is 5.2%.
What is the Percentage of Population Employed in Food Preparation & Serving in the United States?
Percentage of Population Employed in Food Preparation & Serving in the United States is 5.3%.