Suncook, NH Map & Demographics
Suncook Map
Suncook Overview
$38,855
PER CAPITA INCOME
$120,385
AVG FAMILY INCOME
$72,375
AVG HOUSEHOLD INCOME
1.6%
WAGE / INCOME GAP [ % ]
98.4¢/ $1
WAGE / INCOME GAP [ $ ]
0.42
INEQUALITY / GINI INDEX
5,235
TOTAL POPULATION
2,882
MALE POPULATION
2,353
FEMALE POPULATION
122.48
MALES / 100 FEMALES
81.64
FEMALES / 100 MALES
42.3
MEDIAN AGE
2.9
AVG FAMILY SIZE
2.3
AVG HOUSEHOLD SIZE
3,091
LABOR FORCE [ PEOPLE ]
70.9%
PERCENT IN LABOR FORCE
1.0%
UNEMPLOYMENT RATE
Suncook Zip Codes
Suncook Area Codes
Income in Suncook
Income Overview in Suncook
Per Capita Income in Suncook is $38,855, while median incomes of families and households are $120,385 and $72,375 respectively.
| Characteristic | Number | Measure |
| Per Capita Income | 5,235 | $38,855 |
| Median Family Income | 1,356 | $120,385 |
| Mean Family Income | 1,356 | $114,919 |
| Median Household Income | 2,246 | $72,375 |
| Mean Household Income | 2,246 | $90,824 |
| Income Deficit | 1,356 | $0 |
| Wage / Income Gap (%) | 5,235 | 1.64% |
| Wage / Income Gap ($) | 5,235 | 98.36¢ per $1 |
| Gini / Inequality Index | 5,235 | 0.42 |
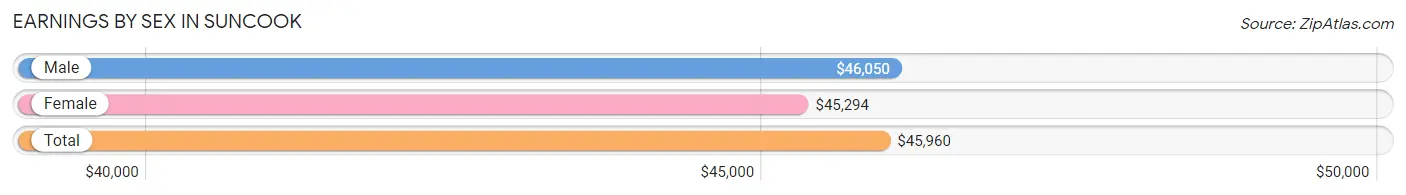
Earnings by Sex in Suncook
Average Earnings in Suncook are $45,960, $46,050 for men and $45,294 for women, a difference of 1.6%.
| Sex | Number | Average Earnings |
| Male | 1,775 (56.3%) | $46,050 |
| Female | 1,380 (43.7%) | $45,294 |
| Total | 3,155 (100.0%) | $45,960 |
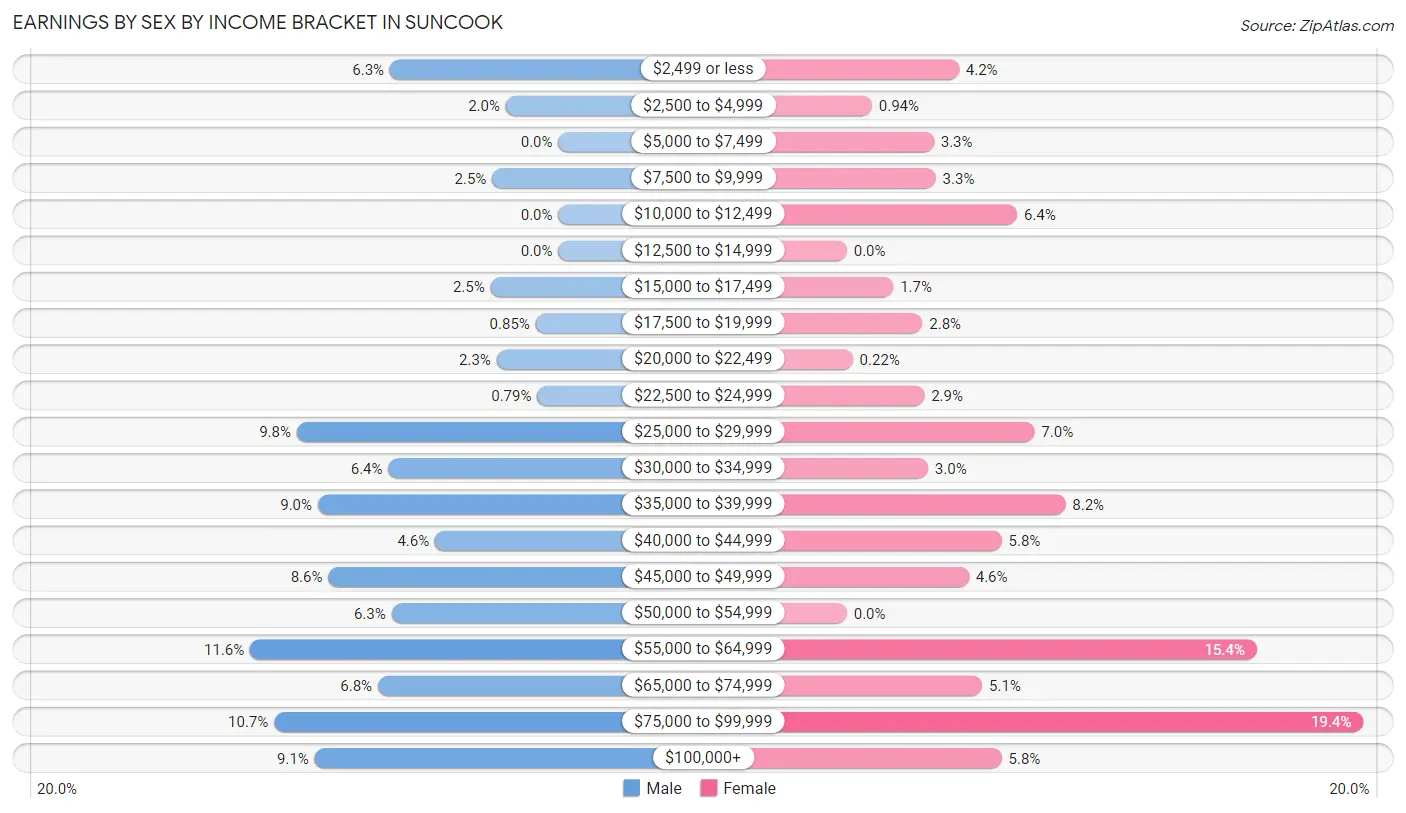
Earnings by Sex by Income Bracket in Suncook
The most common earnings brackets in Suncook are $55,000 to $64,999 for men (205 | 11.6%) and $75,000 to $99,999 for women (267 | 19.4%).
| Income | Male | Female |
| $2,499 or less | 112 (6.3%) | 58 (4.2%) |
| $2,500 to $4,999 | 35 (2.0%) | 13 (0.9%) |
| $5,000 to $7,499 | 0 (0.0%) | 45 (3.3%) |
| $7,500 to $9,999 | 44 (2.5%) | 46 (3.3%) |
| $10,000 to $12,499 | 0 (0.0%) | 88 (6.4%) |
| $12,500 to $14,999 | 0 (0.0%) | 0 (0.0%) |
| $15,000 to $17,499 | 45 (2.5%) | 24 (1.7%) |
| $17,500 to $19,999 | 15 (0.9%) | 39 (2.8%) |
| $20,000 to $22,499 | 41 (2.3%) | 3 (0.2%) |
| $22,500 to $24,999 | 14 (0.8%) | 40 (2.9%) |
| $25,000 to $29,999 | 174 (9.8%) | 97 (7.0%) |
| $30,000 to $34,999 | 113 (6.4%) | 42 (3.0%) |
| $35,000 to $39,999 | 160 (9.0%) | 113 (8.2%) |
| $40,000 to $44,999 | 82 (4.6%) | 80 (5.8%) |
| $45,000 to $49,999 | 153 (8.6%) | 63 (4.6%) |
| $50,000 to $54,999 | 111 (6.2%) | 0 (0.0%) |
| $55,000 to $64,999 | 205 (11.6%) | 212 (15.4%) |
| $65,000 to $74,999 | 120 (6.8%) | 70 (5.1%) |
| $75,000 to $99,999 | 189 (10.6%) | 267 (19.4%) |
| $100,000+ | 162 (9.1%) | 80 (5.8%) |
| Total | 1,775 (100.0%) | 1,380 (100.0%) |
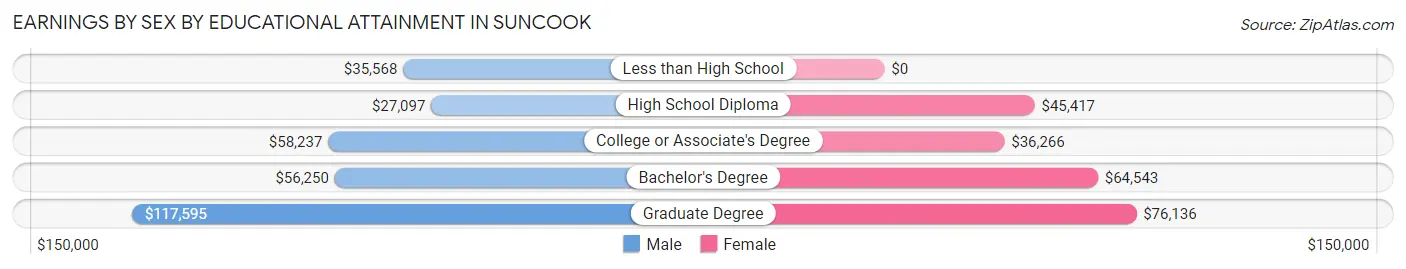
Earnings by Sex by Educational Attainment in Suncook
Average earnings in Suncook are $50,313 for men and $58,865 for women, a difference of 14.5%. Men with an educational attainment of graduate degree enjoy the highest average annual earnings of $117,595, while those with high school diploma education earn the least with $27,097. Women with an educational attainment of graduate degree earn the most with the average annual earnings of $76,136, while those with college or associate's degree education have the smallest earnings of $36,266.
| Educational Attainment | Male Income | Female Income |
| Less than High School | $35,568 | $0 |
| High School Diploma | $27,097 | $45,417 |
| College or Associate's Degree | $58,237 | $36,266 |
| Bachelor's Degree | $56,250 | $64,543 |
| Graduate Degree | $117,595 | $76,136 |
| Total | $50,313 | $58,865 |
Family Income in Suncook
Family Income Brackets in Suncook
According to the Suncook family income data, there are 382 families falling into the $100,000 to $149,999 income range, which is the most common income bracket and makes up 28.2% of all families. Conversely, the less than $10,000 income bracket is the least frequent group with only 31 families (2.3%) belonging to this category.
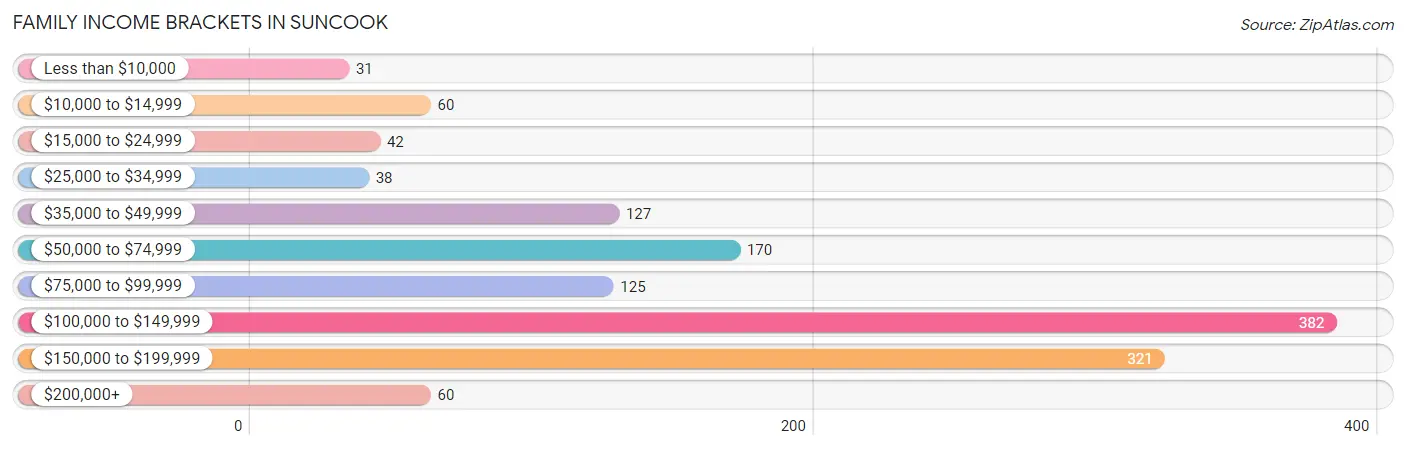
| Income Bracket | # Families | % Families |
| Less than $10,000 | 31 | 2.3% |
| $10,000 to $14,999 | 60 | 4.4% |
| $15,000 to $24,999 | 42 | 3.1% |
| $25,000 to $34,999 | 38 | 2.8% |
| $35,000 to $49,999 | 127 | 9.4% |
| $50,000 to $74,999 | 170 | 12.5% |
| $75,000 to $99,999 | 125 | 9.2% |
| $100,000 to $149,999 | 382 | 28.2% |
| $150,000 to $199,999 | 321 | 23.7% |
| $200,000+ | 60 | 4.4% |
Family Income by Famaliy Size in Suncook
5-person families (54 | 4.0%) account for the highest median family income in Suncook with $144,063 per family, while 2-person families (717 | 52.9%) have the highest median income of $51,140 per family member.
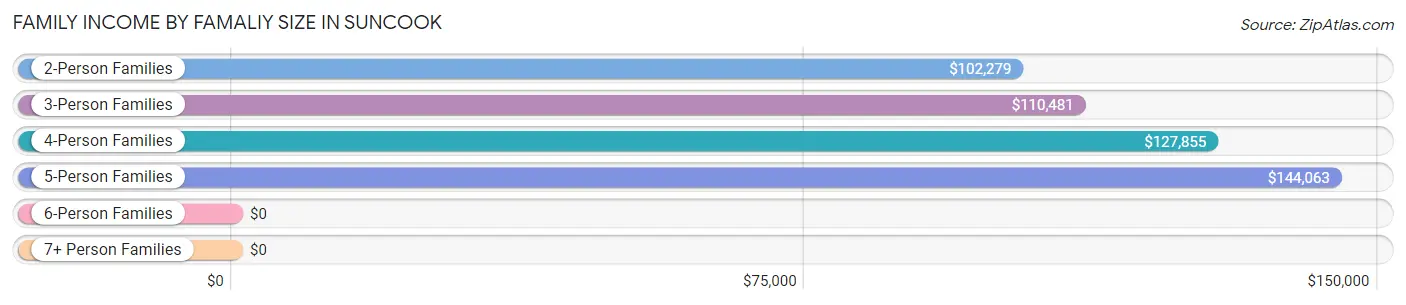
| Income Bracket | # Families | Median Income |
| 2-Person Families | 717 (52.9%) | $102,279 |
| 3-Person Families | 225 (16.6%) | $110,481 |
| 4-Person Families | 311 (22.9%) | $127,855 |
| 5-Person Families | 54 (4.0%) | $144,063 |
| 6-Person Families | 2 (0.2%) | $0 |
| 7+ Person Families | 47 (3.5%) | $0 |
| Total | 1,356 (100.0%) | $120,385 |
Family Income by Number of Earners in Suncook
The median family income in Suncook is $120,385, with families comprising 3+ earners (167) having the highest median family income of $152,750, while families with 1 earner (448) have the lowest median family income of $50,618, accounting for 12.3% and 33.0% of families, respectively.
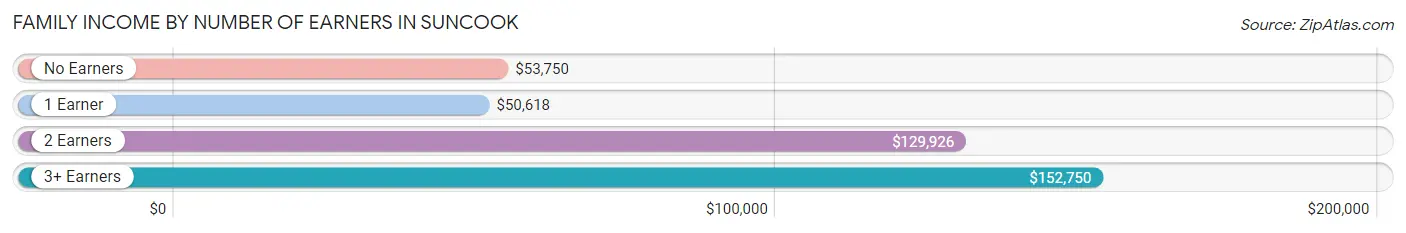
| Number of Earners | # Families | Median Income |
| No Earners | 149 (11.0%) | $53,750 |
| 1 Earner | 448 (33.0%) | $50,618 |
| 2 Earners | 592 (43.7%) | $129,926 |
| 3+ Earners | 167 (12.3%) | $152,750 |
| Total | 1,356 (100.0%) | $120,385 |
Household Income in Suncook
Household Income Brackets in Suncook
With 512 households falling in the category, the $100,000 to $149,999 income range is the most frequent in Suncook, accounting for 22.8% of all households. In contrast, only 58 households (2.6%) fall into the $200,000+ income bracket, making it the least populous group.
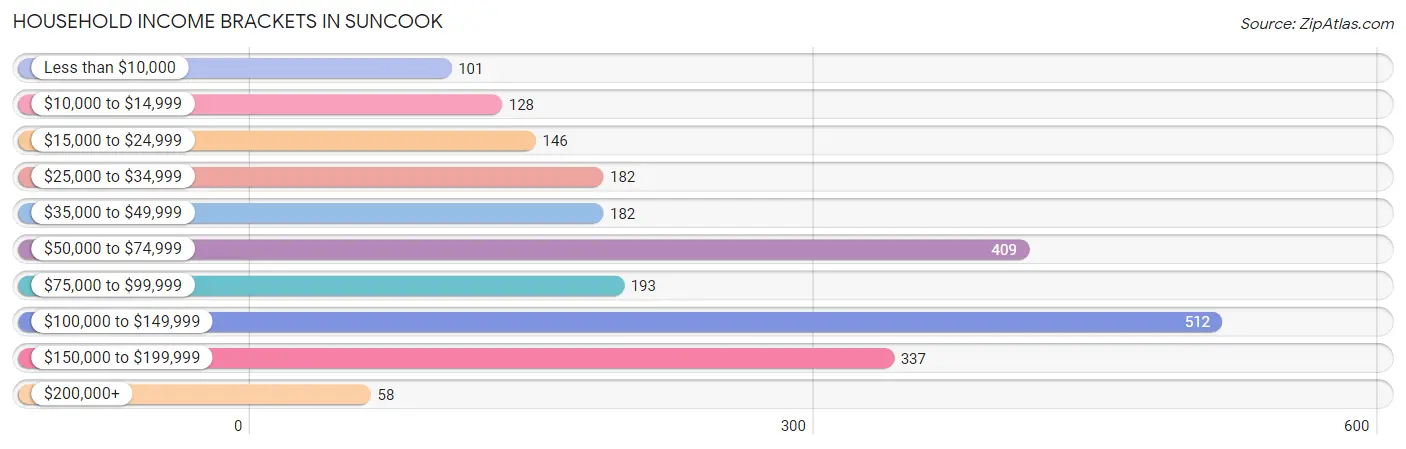
| Income Bracket | # Households | % Households |
| Less than $10,000 | 101 | 4.5% |
| $10,000 to $14,999 | 128 | 5.7% |
| $15,000 to $24,999 | 146 | 6.5% |
| $25,000 to $34,999 | 182 | 8.1% |
| $35,000 to $49,999 | 182 | 8.1% |
| $50,000 to $74,999 | 409 | 18.2% |
| $75,000 to $99,999 | 193 | 8.6% |
| $100,000 to $149,999 | 512 | 22.8% |
| $150,000 to $199,999 | 337 | 15.0% |
| $200,000+ | 58 | 2.6% |
Household Income by Householder Age in Suncook
The median household income in Suncook is $72,375, with the highest median household income of $123,333 found in the 45 to 64 years age bracket for the primary householder. A total of 862 households (38.4%) fall into this category. Meanwhile, the 15 to 24 years age bracket for the primary householder has the lowest median household income of $55,662, with 221 households (9.8%) in this group.
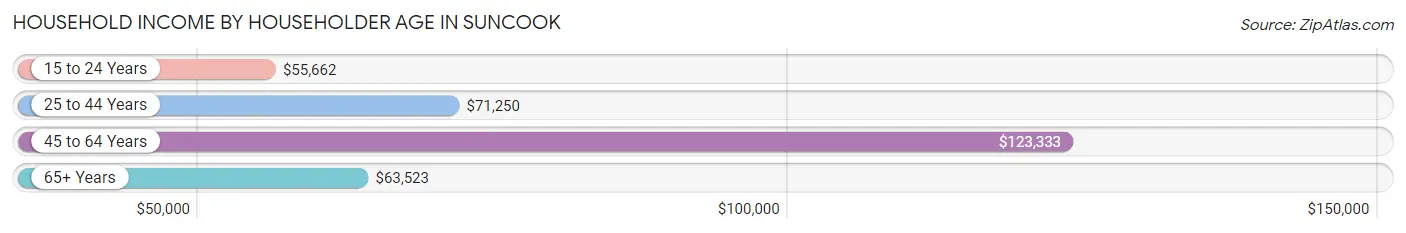
| Income Bracket | # Households | Median Income |
| 15 to 24 Years | 221 (9.8%) | $55,662 |
| 25 to 44 Years | 632 (28.1%) | $71,250 |
| 45 to 64 Years | 862 (38.4%) | $123,333 |
| 65+ Years | 531 (23.6%) | $63,523 |
| Total | 2,246 (100.0%) | $72,375 |
Poverty in Suncook
Income Below Poverty by Sex and Age in Suncook
With 10.4% poverty level for males and 18.3% for females among the residents of Suncook, 35 to 44 year old males and 12 to 14 year old females are the most vulnerable to poverty, with 167 males (39.9%) and 30 females (61.2%) in their respective age groups living below the poverty level.
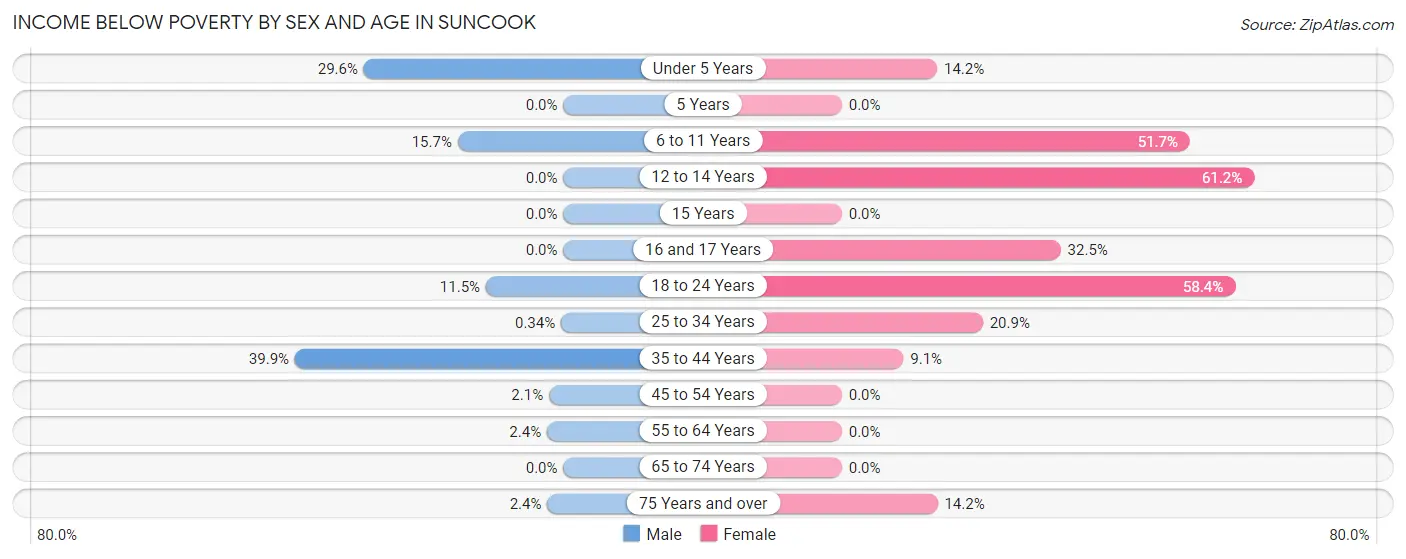
| Age Bracket | Male | Female |
| Under 5 Years | 32 (29.6%) | 15 (14.1%) |
| 5 Years | 0 (0.0%) | 0 (0.0%) |
| 6 to 11 Years | 29 (15.7%) | 93 (51.7%) |
| 12 to 14 Years | 0 (0.0%) | 30 (61.2%) |
| 15 Years | 0 (0.0%) | 0 (0.0%) |
| 16 and 17 Years | 0 (0.0%) | 13 (32.5%) |
| 18 to 24 Years | 43 (11.5%) | 146 (58.4%) |
| 25 to 34 Years | 1 (0.3%) | 72 (20.9%) |
| 35 to 44 Years | 167 (39.9%) | 31 (9.1%) |
| 45 to 54 Years | 9 (2.1%) | 0 (0.0%) |
| 55 to 64 Years | 11 (2.4%) | 0 (0.0%) |
| 65 to 74 Years | 0 (0.0%) | 0 (0.0%) |
| 75 Years and over | 2 (2.4%) | 26 (14.2%) |
| Total | 294 (10.4%) | 426 (18.3%) |
Income Above Poverty by Sex and Age in Suncook
According to the poverty statistics in Suncook, males aged 12 to 14 years and females aged 5 years are the age groups that are most secure financially, with 100.0% of males and 100.0% of females in these age groups living above the poverty line.
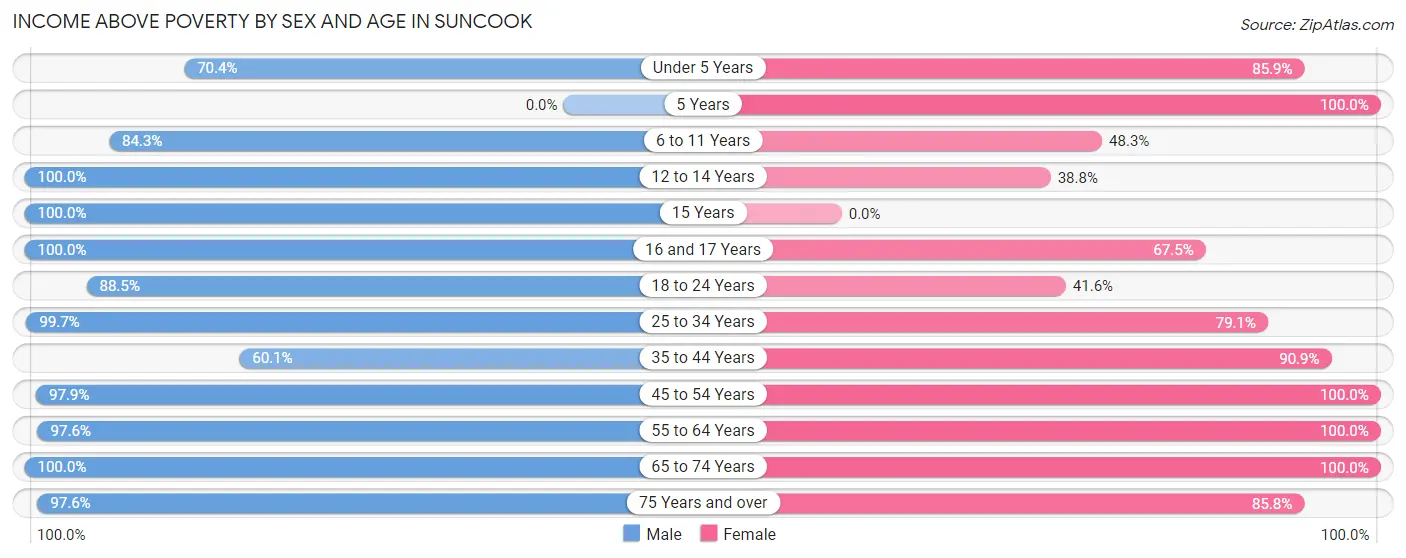
| Age Bracket | Male | Female |
| Under 5 Years | 76 (70.4%) | 91 (85.9%) |
| 5 Years | 0 (0.0%) | 38 (100.0%) |
| 6 to 11 Years | 156 (84.3%) | 87 (48.3%) |
| 12 to 14 Years | 59 (100.0%) | 19 (38.8%) |
| 15 Years | 62 (100.0%) | 0 (0.0%) |
| 16 and 17 Years | 58 (100.0%) | 27 (67.5%) |
| 18 to 24 Years | 331 (88.5%) | 104 (41.6%) |
| 25 to 34 Years | 290 (99.7%) | 272 (79.1%) |
| 35 to 44 Years | 252 (60.1%) | 308 (90.9%) |
| 45 to 54 Years | 413 (97.9%) | 314 (100.0%) |
| 55 to 64 Years | 441 (97.6%) | 264 (100.0%) |
| 65 to 74 Years | 303 (100.0%) | 222 (100.0%) |
| 75 Years and over | 82 (97.6%) | 157 (85.8%) |
| Total | 2,523 (89.6%) | 1,903 (81.7%) |
Income Below Poverty Among Married-Couple Families in Suncook
The poverty statistics for married-couple families in Suncook show that 3.3% or 31 of the total 929 families live below the poverty line. Families with no children have the highest poverty rate of 4.8%, comprising of 31 families. On the other hand, families with 1 or 2 children have the lowest poverty rate of 0.0%, which includes 0 families.
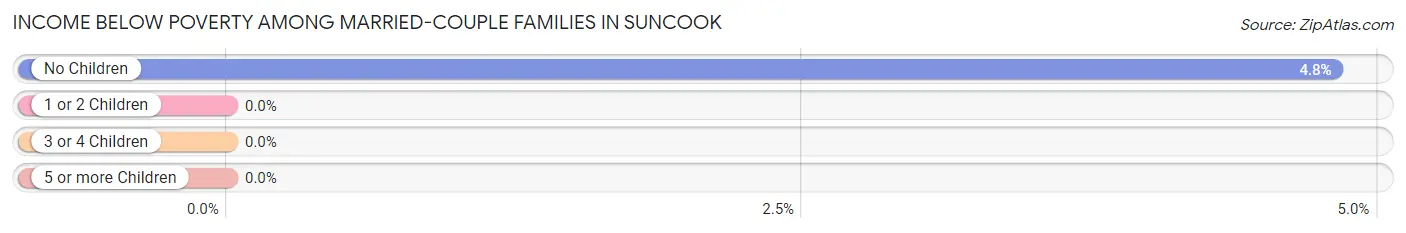
| Children | Above Poverty | Below Poverty |
| No Children | 613 (95.2%) | 31 (4.8%) |
| 1 or 2 Children | 236 (100.0%) | 0 (0.0%) |
| 3 or 4 Children | 15 (100.0%) | 0 (0.0%) |
| 5 or more Children | 34 (100.0%) | 0 (0.0%) |
| Total | 898 (96.7%) | 31 (3.3%) |
Income Below Poverty Among Single-Parent Households in Suncook
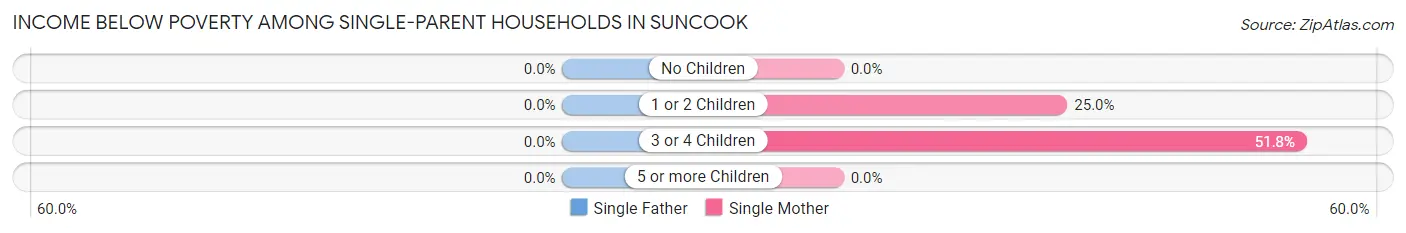
| Children | Single Father | Single Mother |
| No Children | 0 (0.0%) | 0 (0.0%) |
| 1 or 2 Children | 0 (0.0%) | 28 (25.0%) |
| 3 or 4 Children | 0 (0.0%) | 44 (51.8%) |
| 5 or more Children | 0 (0.0%) | 0 (0.0%) |
| Total | 0 (0.0%) | 72 (25.2%) |
Income Below Poverty Among Married-Couple vs Single-Parent Households in Suncook
The poverty data for Suncook shows that 31 of the married-couple family households (3.3%) and 72 of the single-parent households (16.9%) are living below the poverty level. Within the married-couple family households, those with no children have the highest poverty rate, with 31 households (4.8%) falling below the poverty line. Among the single-parent households, those with 3 or 4 children have the highest poverty rate, with 44 household (51.8%) living below poverty.
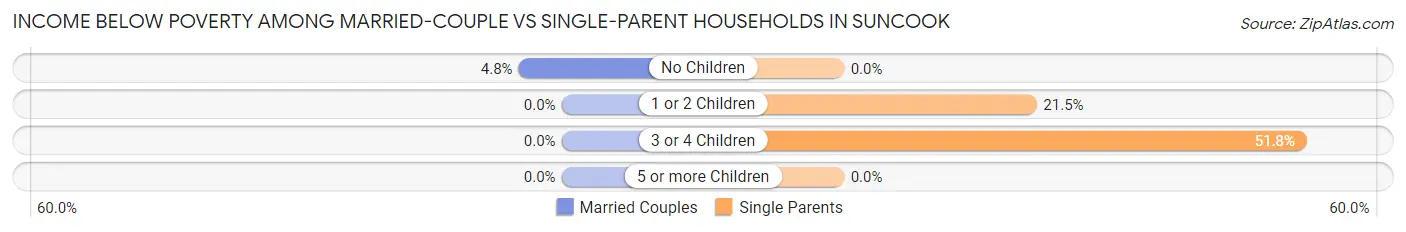
| Children | Married-Couple Families | Single-Parent Households |
| No Children | 31 (4.8%) | 0 (0.0%) |
| 1 or 2 Children | 0 (0.0%) | 28 (21.5%) |
| 3 or 4 Children | 0 (0.0%) | 44 (51.8%) |
| 5 or more Children | 0 (0.0%) | 0 (0.0%) |
| Total | 31 (3.3%) | 72 (16.9%) |
Race in Suncook
The most populous races in Suncook are White / Caucasian (4,609 | 88.0%), Two or more Races (372 | 7.1%), and Hispanic or Latino (231 | 4.4%).
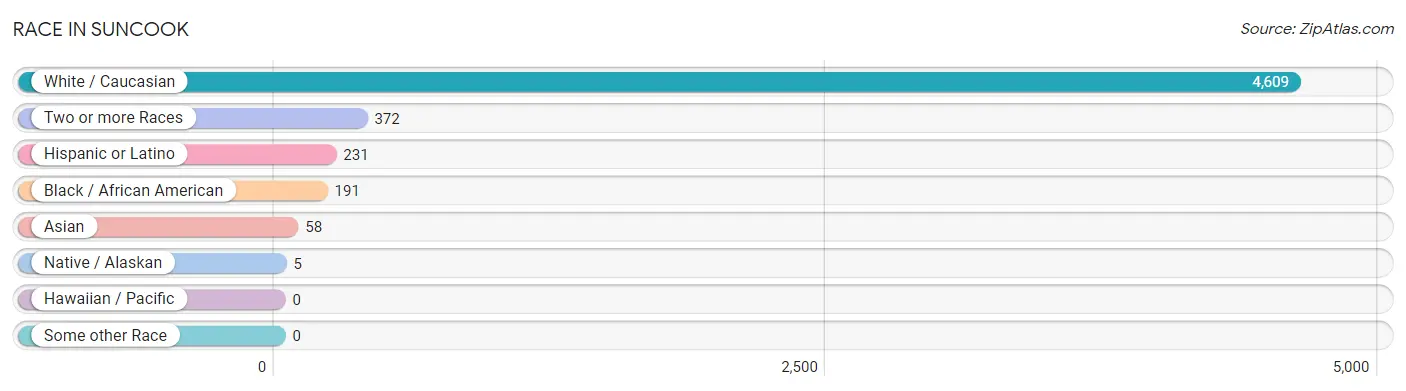
| Race | # Population | % Population |
| Asian | 58 | 1.1% |
| Black / African American | 191 | 3.6% |
| Hawaiian / Pacific | 0 | 0.0% |
| Hispanic or Latino | 231 | 4.4% |
| Native / Alaskan | 5 | 0.1% |
| White / Caucasian | 4,609 | 88.0% |
| Two or more Races | 372 | 7.1% |
| Some other Race | 0 | 0.0% |
| Total | 5,235 | 100.0% |
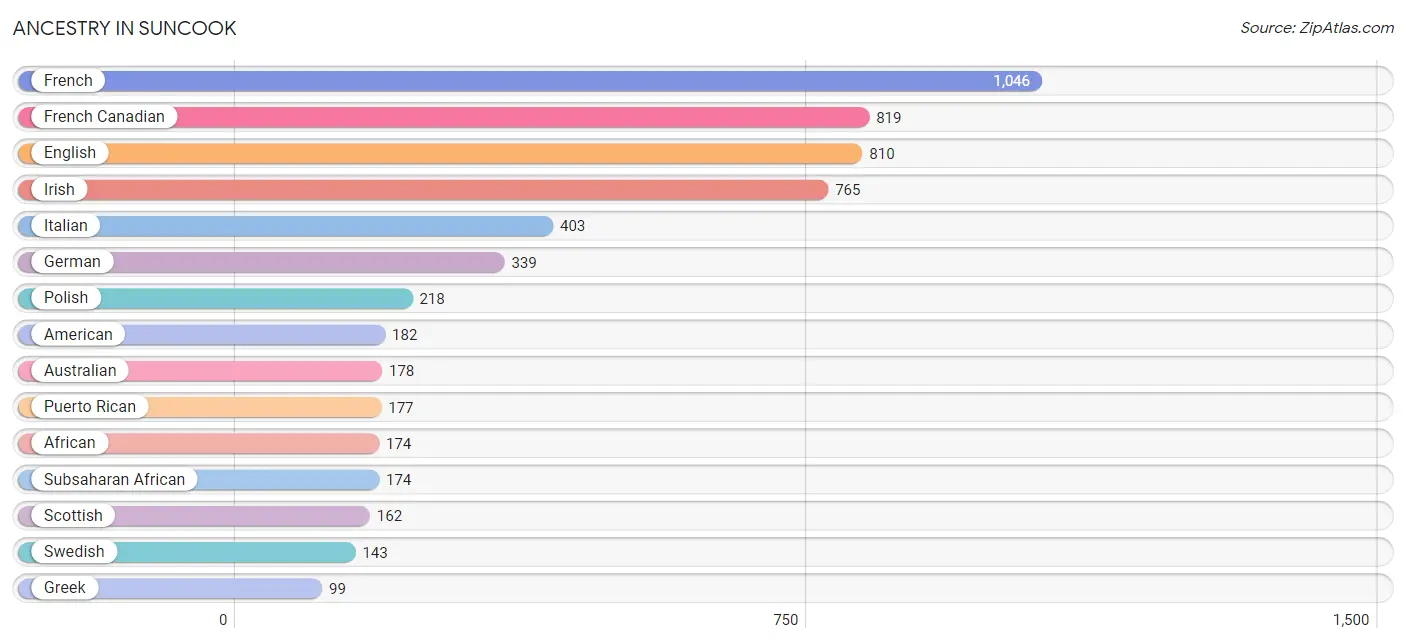
Ancestry in Suncook
The most populous ancestries reported in Suncook are French (1,046 | 20.0%), French Canadian (819 | 15.6%), English (810 | 15.5%), Irish (765 | 14.6%), and Italian (403 | 7.7%), together accounting for 73.4% of all Suncook residents.
| Ancestry | # Population | % Population |
| African | 174 | 3.3% |
| American | 182 | 3.5% |
| Australian | 178 | 3.4% |
| Barbadian | 15 | 0.3% |
| Belgian | 65 | 1.2% |
| Bhutanese | 57 | 1.1% |
| Blackfeet | 3 | 0.1% |
| British | 29 | 0.5% |
| Burmese | 57 | 1.1% |
| Canadian | 57 | 1.1% |
| Central American Indian | 27 | 0.5% |
| Danish | 31 | 0.6% |
| Dominican | 12 | 0.2% |
| Dutch | 24 | 0.5% |
| English | 810 | 15.5% |
| European | 31 | 0.6% |
| French | 1,046 | 20.0% |
| French Canadian | 819 | 15.6% |
| German | 339 | 6.5% |
| Greek | 99 | 1.9% |
| Irish | 765 | 14.6% |
| Italian | 403 | 7.7% |
| Korean | 35 | 0.7% |
| Laotian | 2 | 0.0% |
| Lithuanian | 37 | 0.7% |
| Polish | 218 | 4.2% |
| Portuguese | 61 | 1.2% |
| Puerto Rican | 177 | 3.4% |
| Romanian | 14 | 0.3% |
| Russian | 14 | 0.3% |
| Scottish | 162 | 3.1% |
| Sioux | 5 | 0.1% |
| Slovak | 3 | 0.1% |
| South American | 13 | 0.3% |
| Spanish | 29 | 0.5% |
| Subsaharan African | 174 | 3.3% |
| Swedish | 143 | 2.7% |
| Swiss | 11 | 0.2% |
| Ukrainian | 22 | 0.4% |
| Venezuelan | 13 | 0.3% |
| Welsh | 3 | 0.1% |
| Yugoslavian | 20 | 0.4% | View All 42 Rows |
Immigrants in Suncook
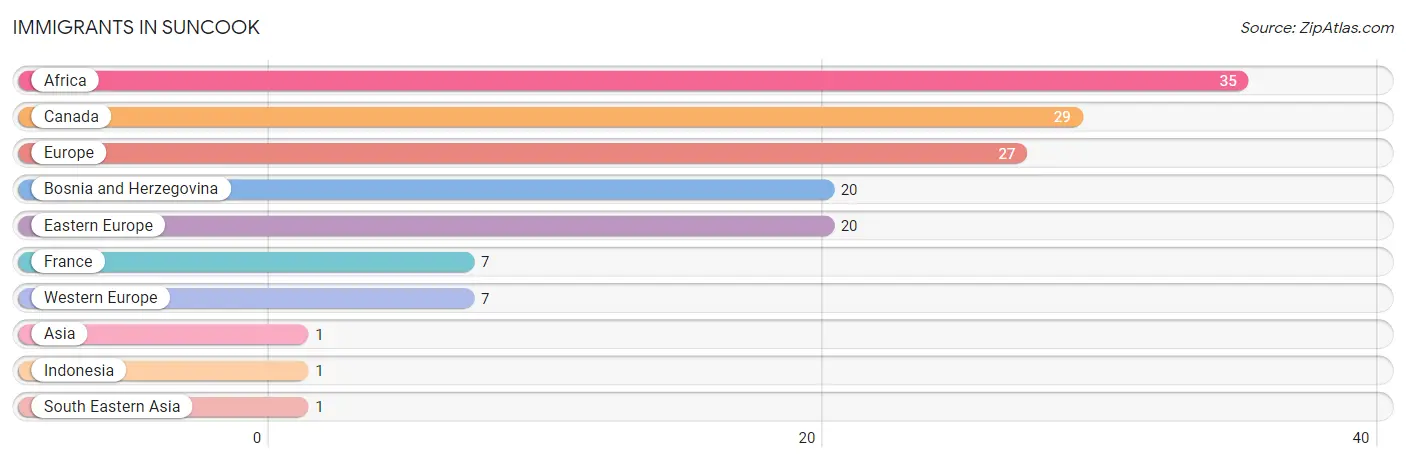
The most numerous immigrant groups reported in Suncook came from Africa (35 | 0.7%), Canada (29 | 0.5%), Europe (27 | 0.5%), Bosnia and Herzegovina (20 | 0.4%), and Eastern Europe (20 | 0.4%), together accounting for 2.5% of all Suncook residents.
| Immigration Origin | # Population | % Population |
| Africa | 35 | 0.7% |
| Asia | 1 | 0.0% |
| Bosnia and Herzegovina | 20 | 0.4% |
| Canada | 29 | 0.5% |
| Eastern Europe | 20 | 0.4% |
| Europe | 27 | 0.5% |
| France | 7 | 0.1% |
| Indonesia | 1 | 0.0% |
| South Eastern Asia | 1 | 0.0% |
| Western Europe | 7 | 0.1% | View All 10 Rows |
Sex and Age in Suncook
Sex and Age in Suncook
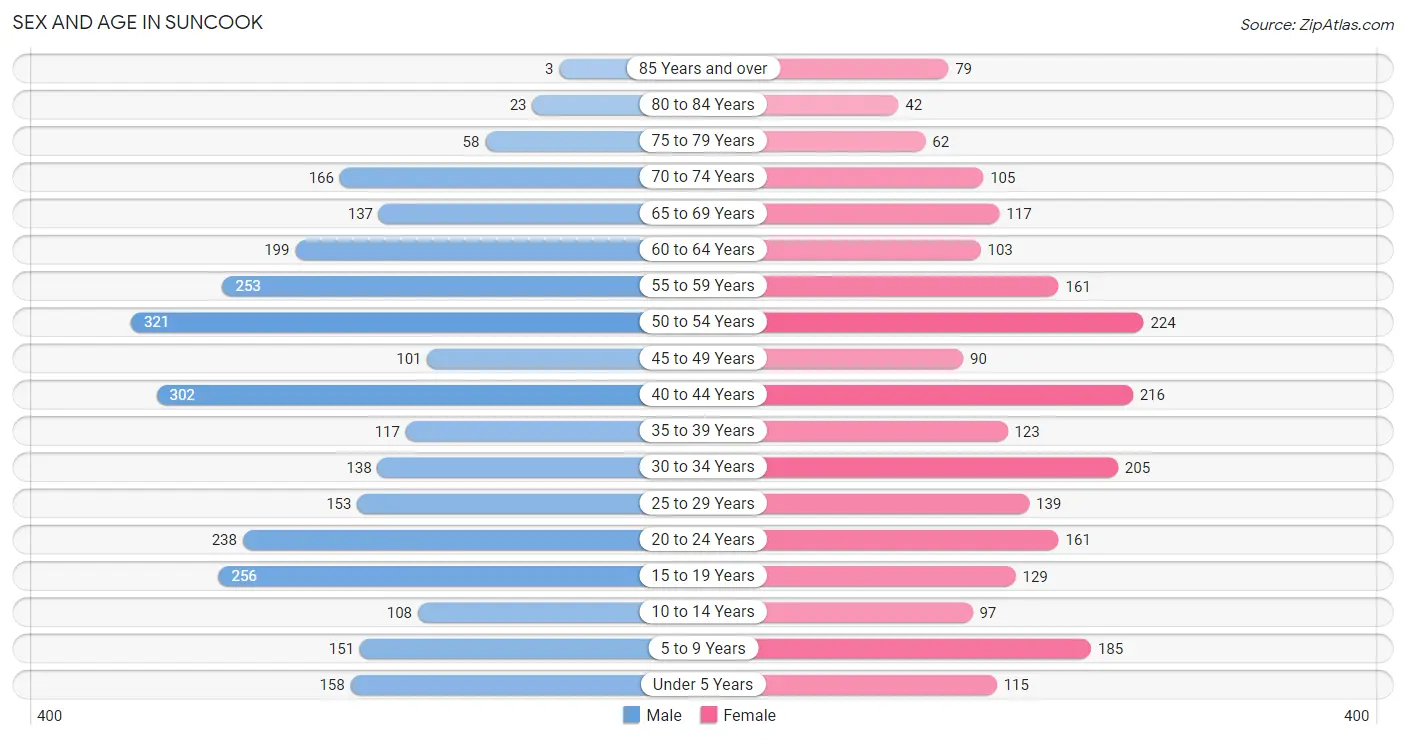
The most populous age groups in Suncook are 50 to 54 Years (321 | 11.1%) for men and 50 to 54 Years (224 | 9.5%) for women.
| Age Bracket | Male | Female |
| Under 5 Years | 158 (5.5%) | 115 (4.9%) |
| 5 to 9 Years | 151 (5.2%) | 185 (7.9%) |
| 10 to 14 Years | 108 (3.7%) | 97 (4.1%) |
| 15 to 19 Years | 256 (8.9%) | 129 (5.5%) |
| 20 to 24 Years | 238 (8.3%) | 161 (6.8%) |
| 25 to 29 Years | 153 (5.3%) | 139 (5.9%) |
| 30 to 34 Years | 138 (4.8%) | 205 (8.7%) |
| 35 to 39 Years | 117 (4.1%) | 123 (5.2%) |
| 40 to 44 Years | 302 (10.5%) | 216 (9.2%) |
| 45 to 49 Years | 101 (3.5%) | 90 (3.8%) |
| 50 to 54 Years | 321 (11.1%) | 224 (9.5%) |
| 55 to 59 Years | 253 (8.8%) | 161 (6.8%) |
| 60 to 64 Years | 199 (6.9%) | 103 (4.4%) |
| 65 to 69 Years | 137 (4.8%) | 117 (5.0%) |
| 70 to 74 Years | 166 (5.8%) | 105 (4.5%) |
| 75 to 79 Years | 58 (2.0%) | 62 (2.6%) |
| 80 to 84 Years | 23 (0.8%) | 42 (1.8%) |
| 85 Years and over | 3 (0.1%) | 79 (3.4%) |
| Total | 2,882 (100.0%) | 2,353 (100.0%) |
Families and Households in Suncook
Median Family Size in Suncook
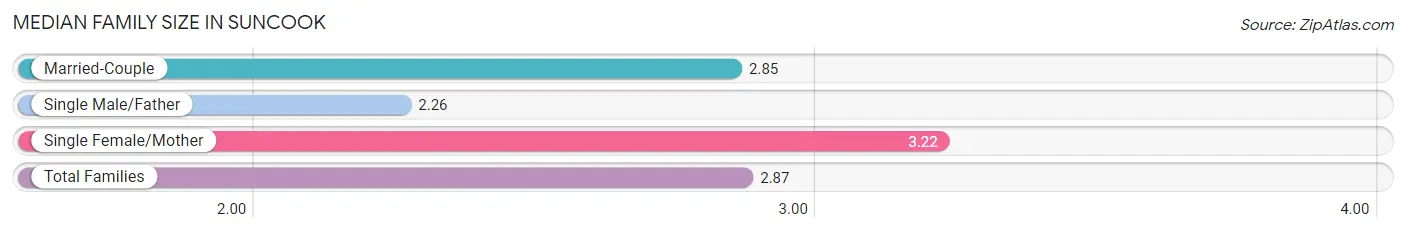
The median family size in Suncook is 2.87 persons per family, with single female/mother families (286 | 21.1%) accounting for the largest median family size of 3.22 persons per family. On the other hand, single male/father families (141 | 10.4%) represent the smallest median family size with 2.26 persons per family.
| Family Type | # Families | Family Size |
| Married-Couple | 929 (68.5%) | 2.85 |
| Single Male/Father | 141 (10.4%) | 2.26 |
| Single Female/Mother | 286 (21.1%) | 3.22 |
| Total Families | 1,356 (100.0%) | 2.87 |
Median Household Size in Suncook
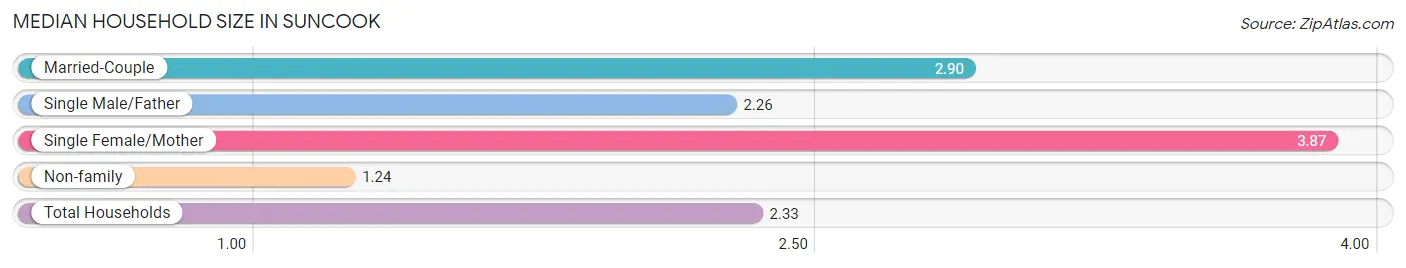
The median household size in Suncook is 2.33 persons per household, with single female/mother households (286 | 12.7%) accounting for the largest median household size of 3.87 persons per household. non-family households (890 | 39.6%) represent the smallest median household size with 1.24 persons per household.
| Household Type | # Households | Household Size |
| Married-Couple | 929 (41.4%) | 2.90 |
| Single Male/Father | 141 (6.3%) | 2.26 |
| Single Female/Mother | 286 (12.7%) | 3.87 |
| Non-family | 890 (39.6%) | 1.24 |
| Total Households | 2,246 (100.0%) | 2.33 |
Household Size by Marriage Status in Suncook
Out of a total of 2,246 households in Suncook, 1,356 (60.4%) are family households, while 890 (39.6%) are nonfamily households. The most numerous type of family households are 2-person households, comprising 658, and the most common type of nonfamily households are 1-person households, comprising 694.
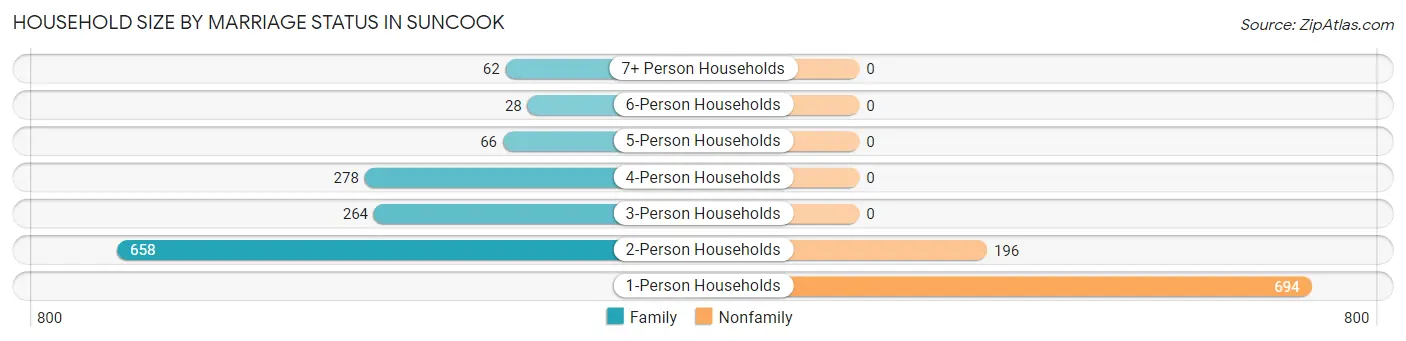
| Household Size | Family Households | Nonfamily Households |
| 1-Person Households | - | 694 (30.9%) |
| 2-Person Households | 658 (29.3%) | 196 (8.7%) |
| 3-Person Households | 264 (11.7%) | 0 (0.0%) |
| 4-Person Households | 278 (12.4%) | 0 (0.0%) |
| 5-Person Households | 66 (2.9%) | 0 (0.0%) |
| 6-Person Households | 28 (1.3%) | 0 (0.0%) |
| 7+ Person Households | 62 (2.8%) | 0 (0.0%) |
| Total | 1,356 (60.4%) | 890 (39.6%) |
Female Fertility in Suncook
Fertility by Age in Suncook
Average fertility rate in Suncook is 71.0 births per 1,000 women. Women in the age bracket of 20 to 34 years have the highest fertility rate with 154.0 births per 1,000 women. Women in the age bracket of 20 to 34 years acount for 100.0% of all women with births.
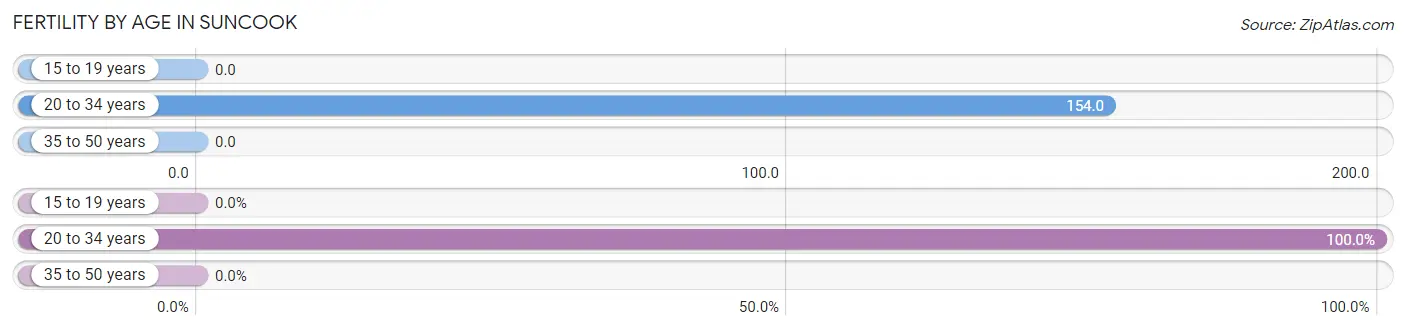
| Age Bracket | Women with Births | Births / 1,000 Women |
| 15 to 19 years | 0 (0.0%) | 0.0 |
| 20 to 34 years | 78 (100.0%) | 154.0 |
| 35 to 50 years | 0 (0.0%) | 0.0 |
| Total | 78 (100.0%) | 71.0 |
Fertility by Age by Marriage Status in Suncook
88.5% of women with births (78) in Suncook are married. The highest percentage of unmarried women with births falls into 20 to 34 years age bracket with 11.5% of them unmarried at the time of birth, while the lowest percentage of unmarried women with births belong to 20 to 34 years age bracket with 11.5% of them unmarried.
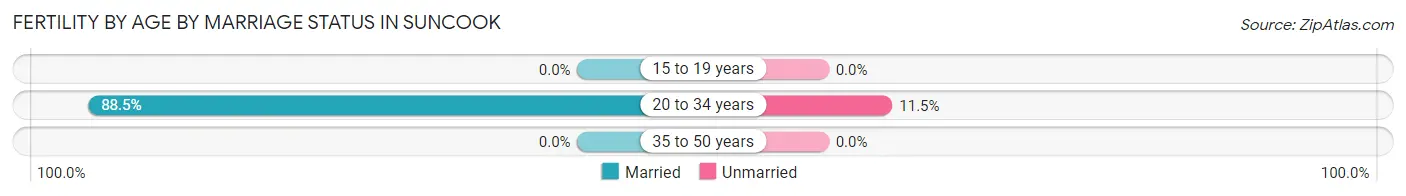
| Age Bracket | Married | Unmarried |
| 15 to 19 years | 0 (0.0%) | 0 (0.0%) |
| 20 to 34 years | 69 (88.5%) | 9 (11.5%) |
| 35 to 50 years | 0 (0.0%) | 0 (0.0%) |
| Total | 69 (88.5%) | 9 (11.5%) |
Fertility by Education in Suncook
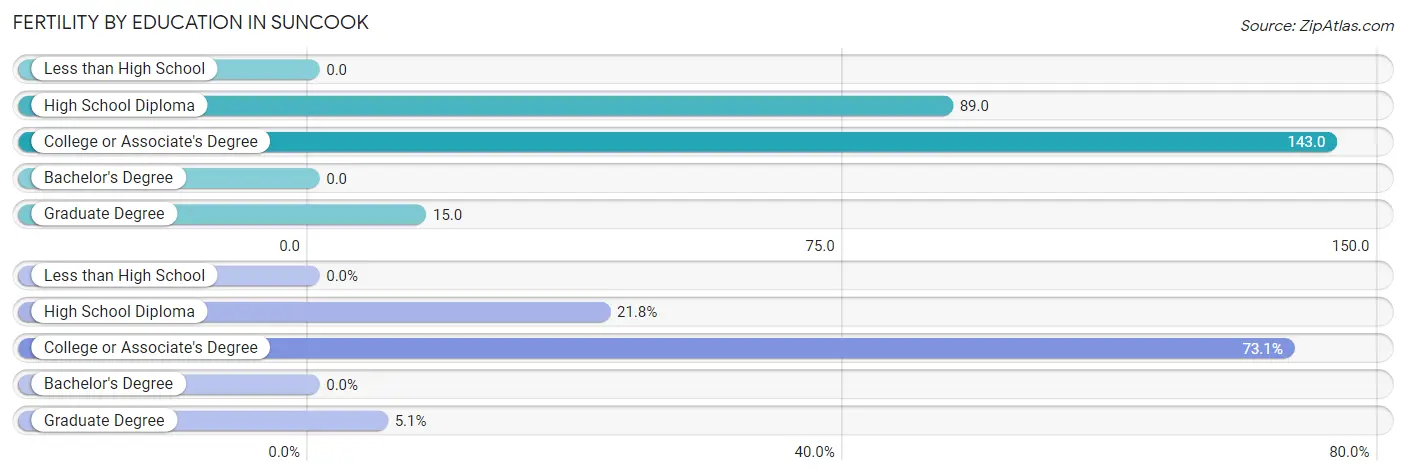
| Educational Attainment | Women with Births | Births / 1,000 Women |
| Less than High School | 0 (0.0%) | 0.0 |
| High School Diploma | 17 (21.8%) | 89.0 |
| College or Associate's Degree | 57 (73.1%) | 143.0 |
| Bachelor's Degree | 0 (0.0%) | 0.0 |
| Graduate Degree | 4 (5.1%) | 15.0 |
| Total | 78 (100.0%) | 71.0 |
Fertility by Education by Marriage Status in Suncook
11.5% of women with births in Suncook are unmarried. Women with the educational attainment of college or associate's degree are most likely to be married with 100.0% of them married at childbirth, while women with the educational attainment of high school diploma are least likely to be married with 52.9% of them unmarried at childbirth.
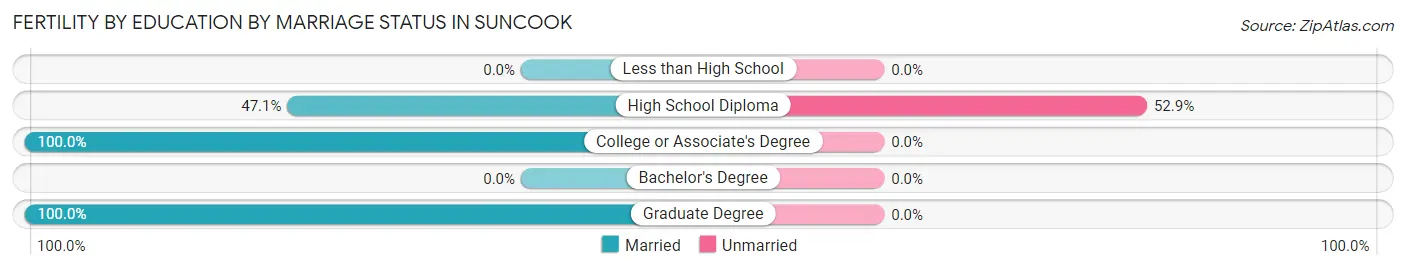
| Educational Attainment | Married | Unmarried |
| Less than High School | 0 (0.0%) | 0 (0.0%) |
| High School Diploma | 8 (47.1%) | 9 (52.9%) |
| College or Associate's Degree | 57 (100.0%) | 0 (0.0%) |
| Bachelor's Degree | 0 (0.0%) | 0 (0.0%) |
| Graduate Degree | 4 (100.0%) | 0 (0.0%) |
| Total | 69 (88.5%) | 9 (11.5%) |
Employment Characteristics in Suncook
Employment by Class of Employer in Suncook
Among the 2,977 employed individuals in Suncook, private company employees (1,745 | 58.6%), not-for-profit organizations (491 | 16.5%), and self-employed (not incorporated) (218 | 7.3%) make up the most common classes of employment.
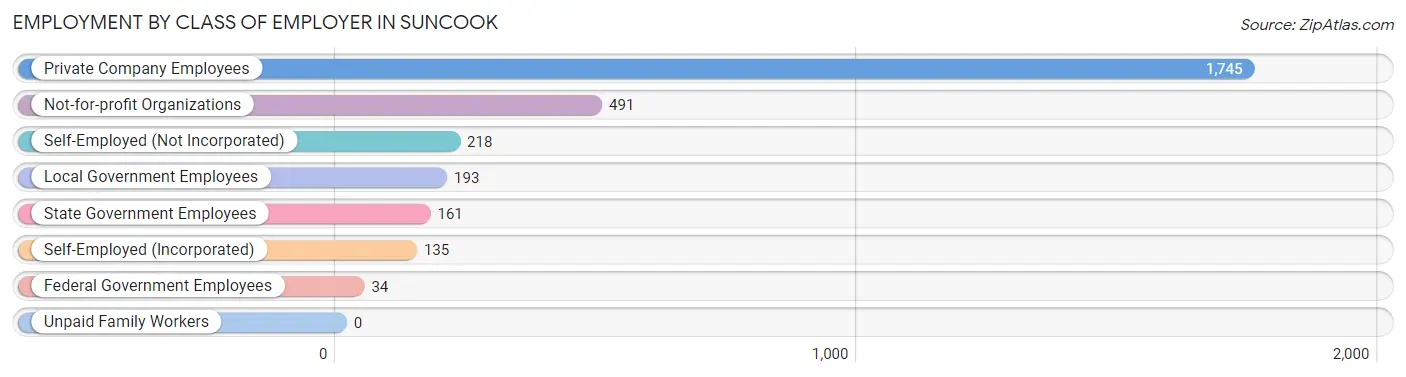
| Employer Class | # Employees | % Employees |
| Private Company Employees | 1,745 | 58.6% |
| Self-Employed (Incorporated) | 135 | 4.5% |
| Self-Employed (Not Incorporated) | 218 | 7.3% |
| Not-for-profit Organizations | 491 | 16.5% |
| Local Government Employees | 193 | 6.5% |
| State Government Employees | 161 | 5.4% |
| Federal Government Employees | 34 | 1.1% |
| Unpaid Family Workers | 0 | 0.0% |
| Total | 2,977 | 100.0% |
Employment Status by Age in Suncook
According to the labor force statistics for Suncook, out of the total population over 16 years of age (4,359), 70.9% or 3,091 individuals are in the labor force, with 1.0% or 31 of them unemployed. The age group with the highest labor force participation rate is 20 to 24 years, with 100.0% or 399 individuals in the labor force. Within the labor force, the 65 to 74 years age range has the highest percentage of unemployed individuals, with 10.3% or 14 of them being unemployed.
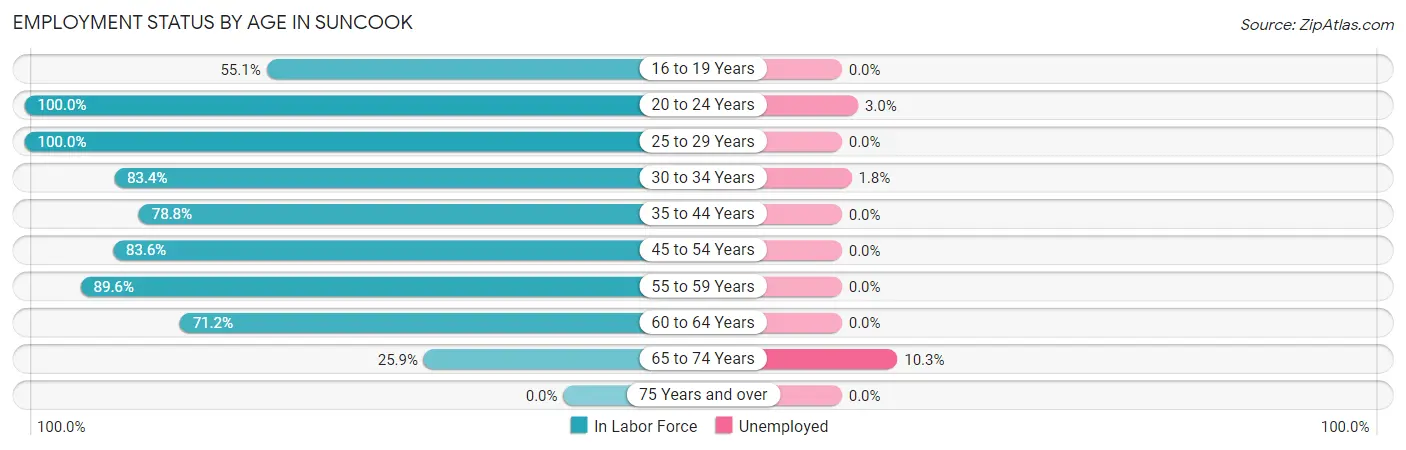
| Age Bracket | In Labor Force | Unemployed |
| 16 to 19 Years | 178 (55.1%) | 0 (0.0%) |
| 20 to 24 Years | 399 (100.0%) | 12 (3.0%) |
| 25 to 29 Years | 292 (100.0%) | 0 (0.0%) |
| 30 to 34 Years | 286 (83.4%) | 5 (1.8%) |
| 35 to 44 Years | 597 (78.8%) | 0 (0.0%) |
| 45 to 54 Years | 615 (83.6%) | 0 (0.0%) |
| 55 to 59 Years | 371 (89.6%) | 0 (0.0%) |
| 60 to 64 Years | 215 (71.2%) | 0 (0.0%) |
| 65 to 74 Years | 136 (25.9%) | 14 (10.3%) |
| 75 Years and over | 0 (0.0%) | 0 (0.0%) |
| Total | 3,091 (70.9%) | 31 (1.0%) |
Employment Status by Educational Attainment in Suncook
According to labor force statistics for Suncook, 83.5% of individuals (2,376) out of the total population between 25 and 64 years of age (2,845) are in the labor force, with 0.2% or 5 of them being unemployed. The group with the highest labor force participation rate are those with the educational attainment of bachelor's degree or higher, with 95.2% or 761 individuals in the labor force. Within the labor force, individuals with bachelor's degree or higher education have the highest percentage of unemployment, with 0.7% or 5 of them being unemployed.
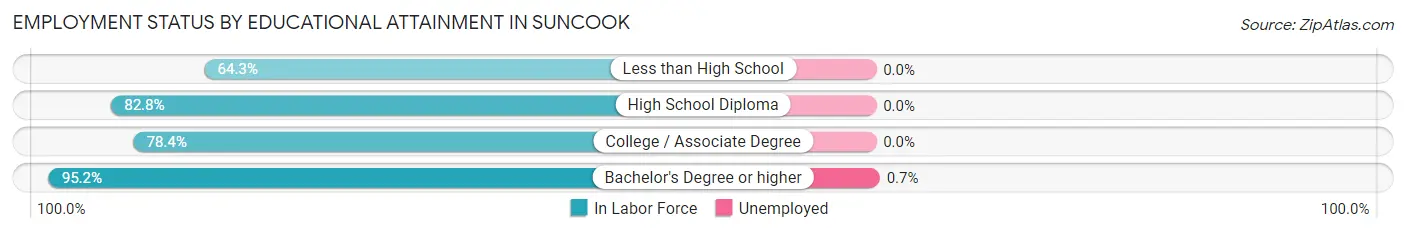
| Educational Attainment | In Labor Force | Unemployed |
| Less than High School | 110 (64.3%) | 0 (0.0%) |
| High School Diploma | 659 (82.8%) | 0 (0.0%) |
| College / Associate Degree | 846 (78.4%) | 0 (0.0%) |
| Bachelor's Degree or higher | 761 (95.2%) | 6 (0.7%) |
| Total | 2,376 (83.5%) | 6 (0.2%) |
Employment Occupations by Sex in Suncook
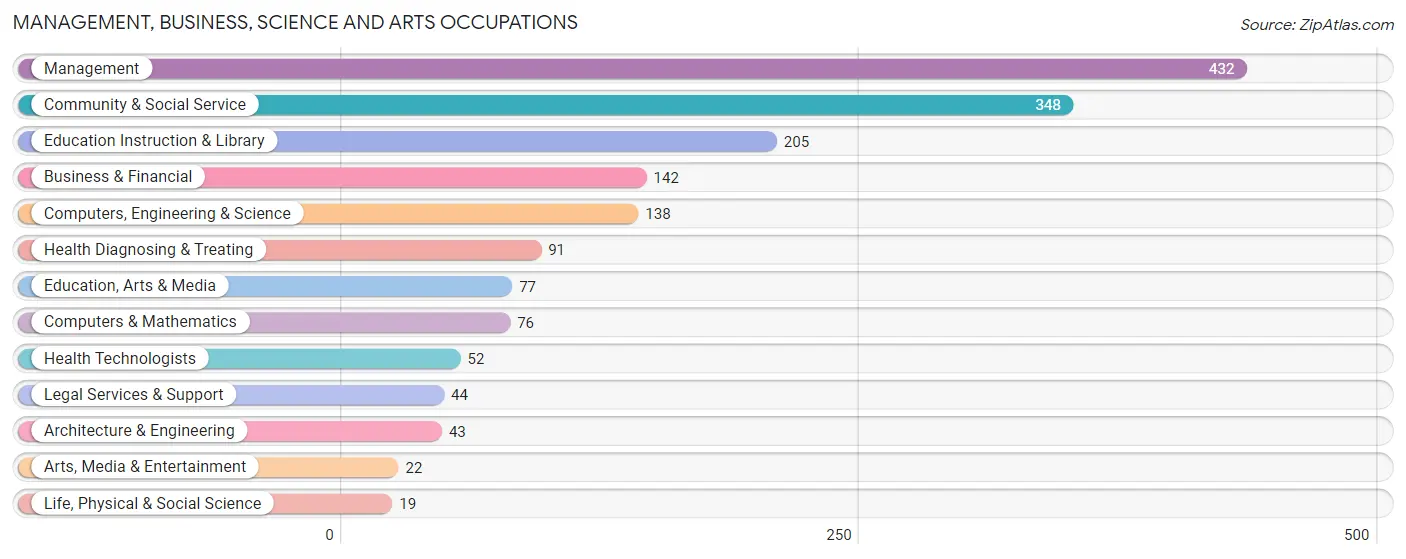
Management, Business, Science and Arts Occupations
The most common Management, Business, Science and Arts occupations in Suncook are Management (432 | 14.1%), Community & Social Service (348 | 11.4%), Education Instruction & Library (205 | 6.7%), Business & Financial (142 | 4.6%), and Computers, Engineering & Science (138 | 4.5%).
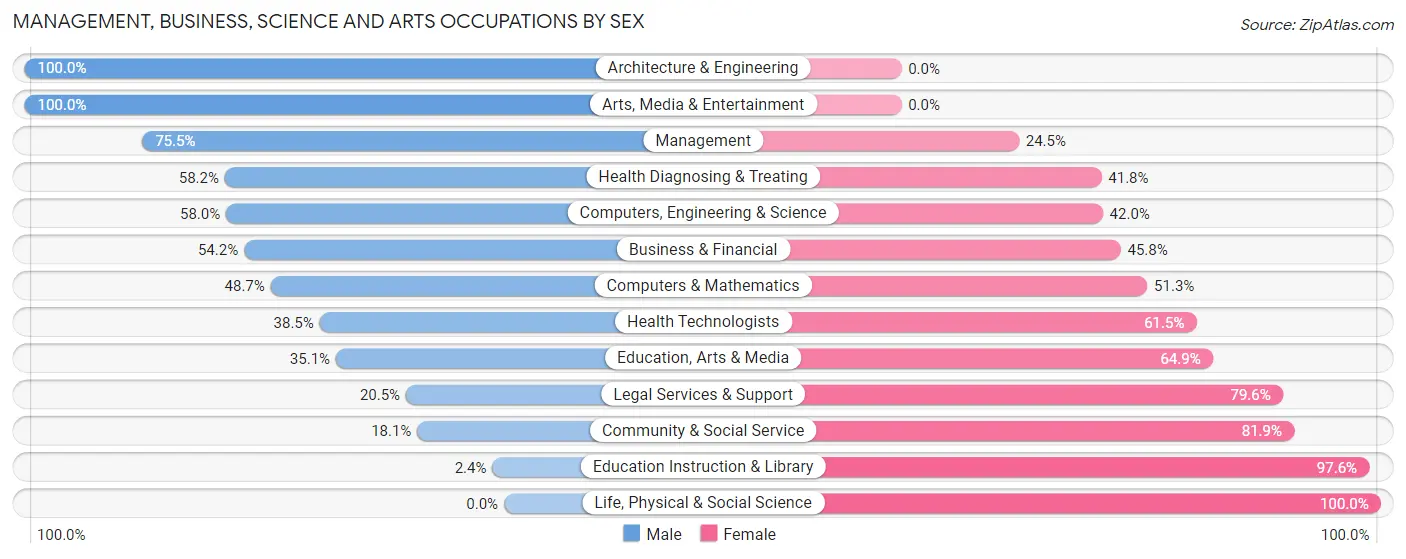
Management, Business, Science and Arts Occupations by Sex
Within the Management, Business, Science and Arts occupations in Suncook, the most male-oriented occupations are Architecture & Engineering (100.0%), Arts, Media & Entertainment (100.0%), and Management (75.5%), while the most female-oriented occupations are Life, Physical & Social Science (100.0%), Education Instruction & Library (97.6%), and Community & Social Service (81.9%).
| Occupation | Male | Female |
| Management | 326 (75.5%) | 106 (24.5%) |
| Business & Financial | 77 (54.2%) | 65 (45.8%) |
| Computers, Engineering & Science | 80 (58.0%) | 58 (42.0%) |
| Computers & Mathematics | 37 (48.7%) | 39 (51.3%) |
| Architecture & Engineering | 43 (100.0%) | 0 (0.0%) |
| Life, Physical & Social Science | 0 (0.0%) | 19 (100.0%) |
| Community & Social Service | 63 (18.1%) | 285 (81.9%) |
| Education, Arts & Media | 27 (35.1%) | 50 (64.9%) |
| Legal Services & Support | 9 (20.4%) | 35 (79.5%) |
| Education Instruction & Library | 5 (2.4%) | 200 (97.6%) |
| Arts, Media & Entertainment | 22 (100.0%) | 0 (0.0%) |
| Health Diagnosing & Treating | 53 (58.2%) | 38 (41.8%) |
| Health Technologists | 20 (38.5%) | 32 (61.5%) |
| Total (Category) | 599 (52.0%) | 552 (48.0%) |
| Total (Overall) | 1,732 (56.7%) | 1,324 (43.3%) |
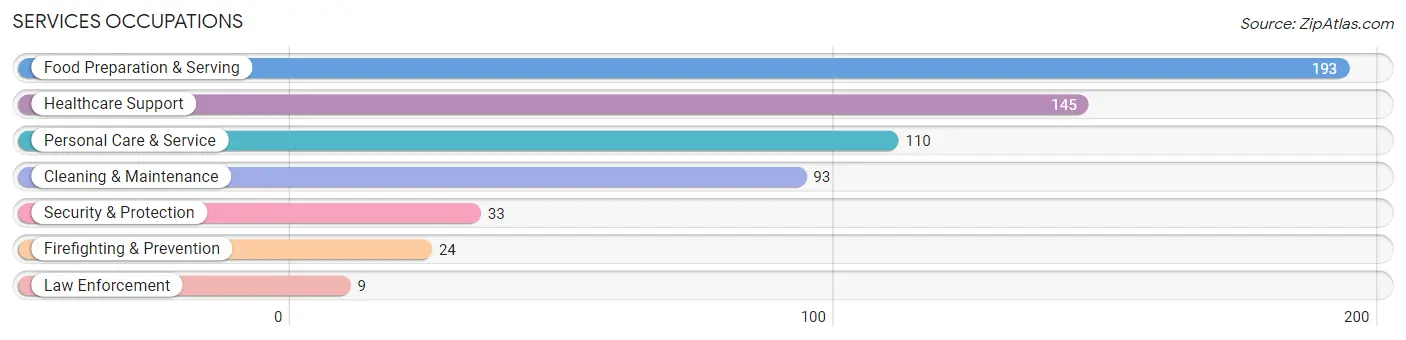
Services Occupations
The most common Services occupations in Suncook are Food Preparation & Serving (193 | 6.3%), Healthcare Support (145 | 4.7%), Personal Care & Service (110 | 3.6%), Cleaning & Maintenance (93 | 3.0%), and Security & Protection (33 | 1.1%).
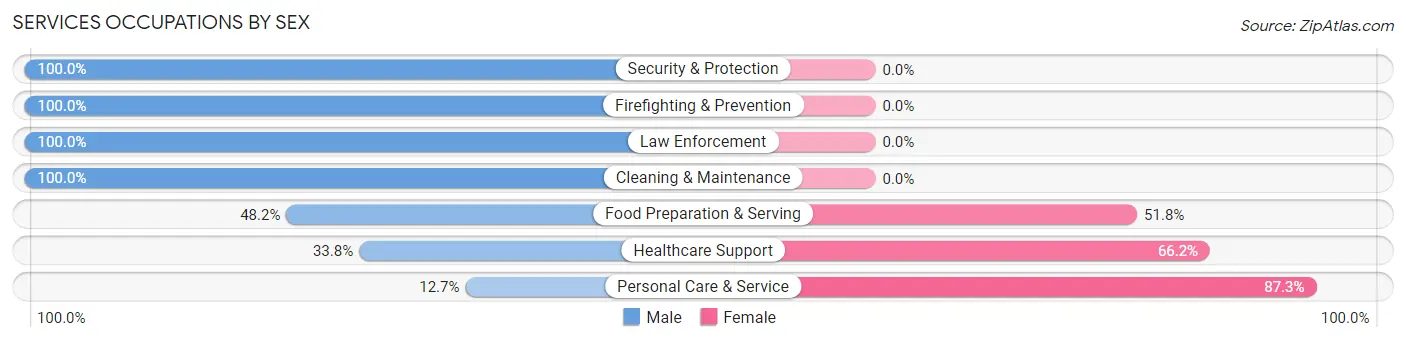
Services Occupations by Sex
Within the Services occupations in Suncook, the most male-oriented occupations are Security & Protection (100.0%), Firefighting & Prevention (100.0%), and Law Enforcement (100.0%), while the most female-oriented occupations are Personal Care & Service (87.3%), Healthcare Support (66.2%), and Food Preparation & Serving (51.8%).
| Occupation | Male | Female |
| Healthcare Support | 49 (33.8%) | 96 (66.2%) |
| Security & Protection | 33 (100.0%) | 0 (0.0%) |
| Firefighting & Prevention | 24 (100.0%) | 0 (0.0%) |
| Law Enforcement | 9 (100.0%) | 0 (0.0%) |
| Food Preparation & Serving | 93 (48.2%) | 100 (51.8%) |
| Cleaning & Maintenance | 93 (100.0%) | 0 (0.0%) |
| Personal Care & Service | 14 (12.7%) | 96 (87.3%) |
| Total (Category) | 282 (49.1%) | 292 (50.9%) |
| Total (Overall) | 1,732 (56.7%) | 1,324 (43.3%) |
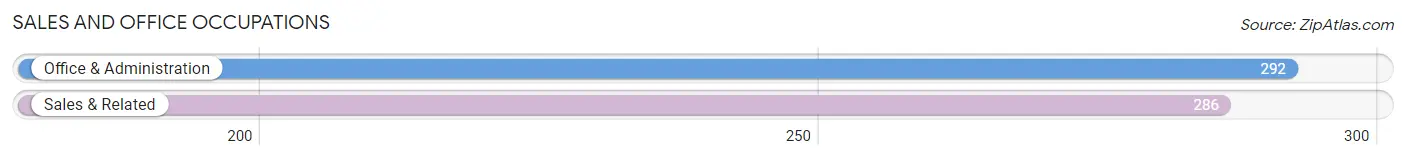
Sales and Office Occupations
The most common Sales and Office occupations in Suncook are Office & Administration (292 | 9.6%), and Sales & Related (286 | 9.4%).
Sales and Office Occupations by Sex
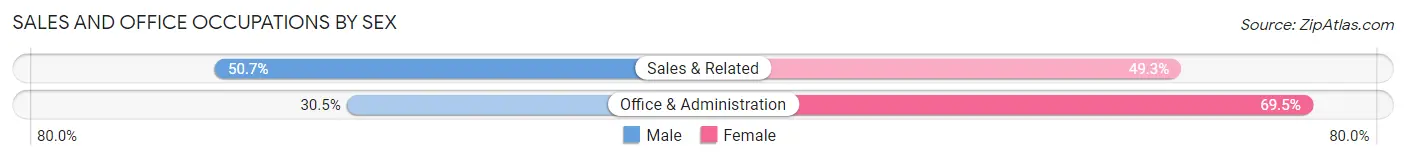
| Occupation | Male | Female |
| Sales & Related | 145 (50.7%) | 141 (49.3%) |
| Office & Administration | 89 (30.5%) | 203 (69.5%) |
| Total (Category) | 234 (40.5%) | 344 (59.5%) |
| Total (Overall) | 1,732 (56.7%) | 1,324 (43.3%) |
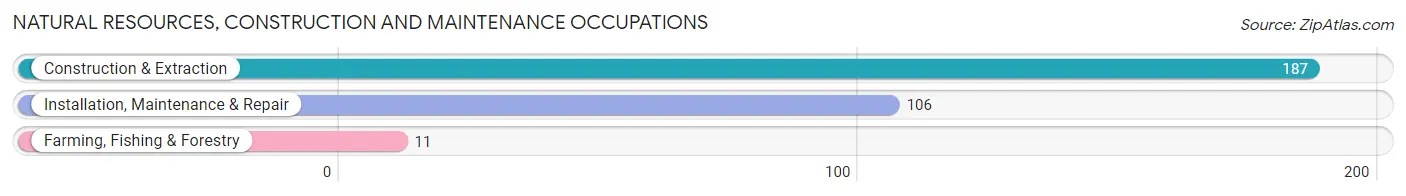
Natural Resources, Construction and Maintenance Occupations
The most common Natural Resources, Construction and Maintenance occupations in Suncook are Construction & Extraction (187 | 6.1%), Installation, Maintenance & Repair (106 | 3.5%), and Farming, Fishing & Forestry (11 | 0.4%).
Natural Resources, Construction and Maintenance Occupations by Sex
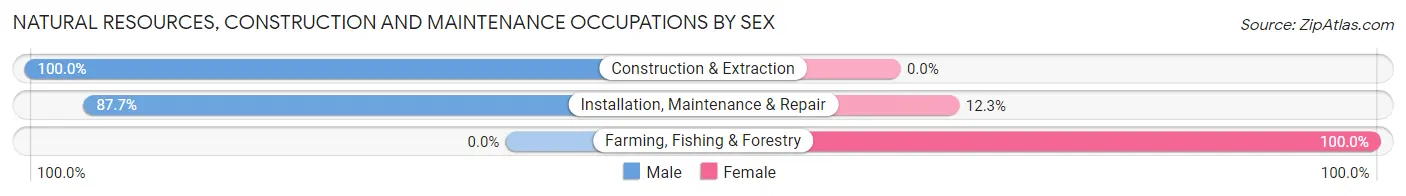
| Occupation | Male | Female |
| Farming, Fishing & Forestry | 0 (0.0%) | 11 (100.0%) |
| Construction & Extraction | 187 (100.0%) | 0 (0.0%) |
| Installation, Maintenance & Repair | 93 (87.7%) | 13 (12.3%) |
| Total (Category) | 280 (92.1%) | 24 (7.9%) |
| Total (Overall) | 1,732 (56.7%) | 1,324 (43.3%) |
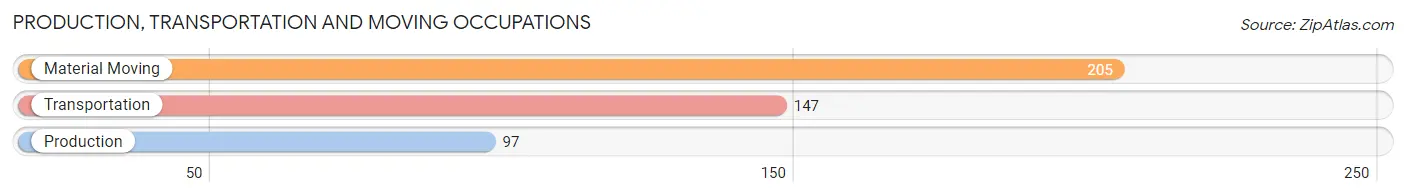
Production, Transportation and Moving Occupations
The most common Production, Transportation and Moving occupations in Suncook are Material Moving (205 | 6.7%), Transportation (147 | 4.8%), and Production (97 | 3.2%).
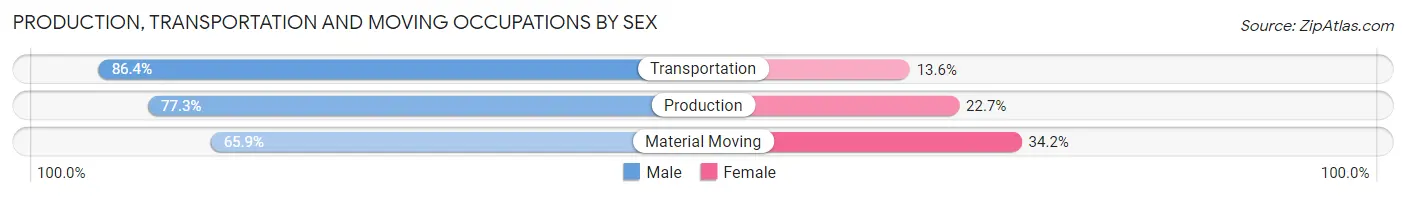
Production, Transportation and Moving Occupations by Sex
| Occupation | Male | Female |
| Production | 75 (77.3%) | 22 (22.7%) |
| Transportation | 127 (86.4%) | 20 (13.6%) |
| Material Moving | 135 (65.8%) | 70 (34.2%) |
| Total (Category) | 337 (75.1%) | 112 (24.9%) |
| Total (Overall) | 1,732 (56.7%) | 1,324 (43.3%) |
Employment Industries by Sex in Suncook
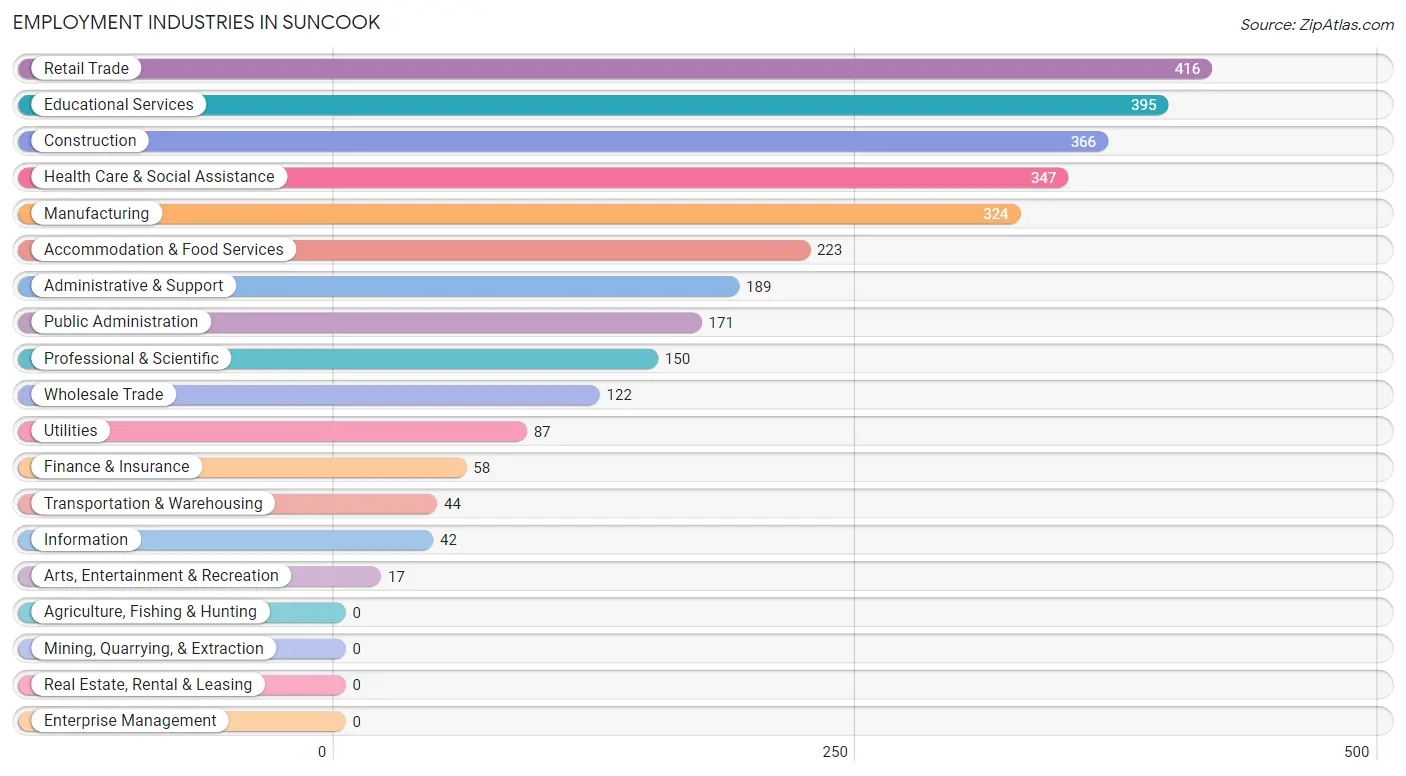
Employment Industries in Suncook
The major employment industries in Suncook include Retail Trade (416 | 13.6%), Educational Services (395 | 12.9%), Construction (366 | 12.0%), Health Care & Social Assistance (347 | 11.4%), and Manufacturing (324 | 10.6%).
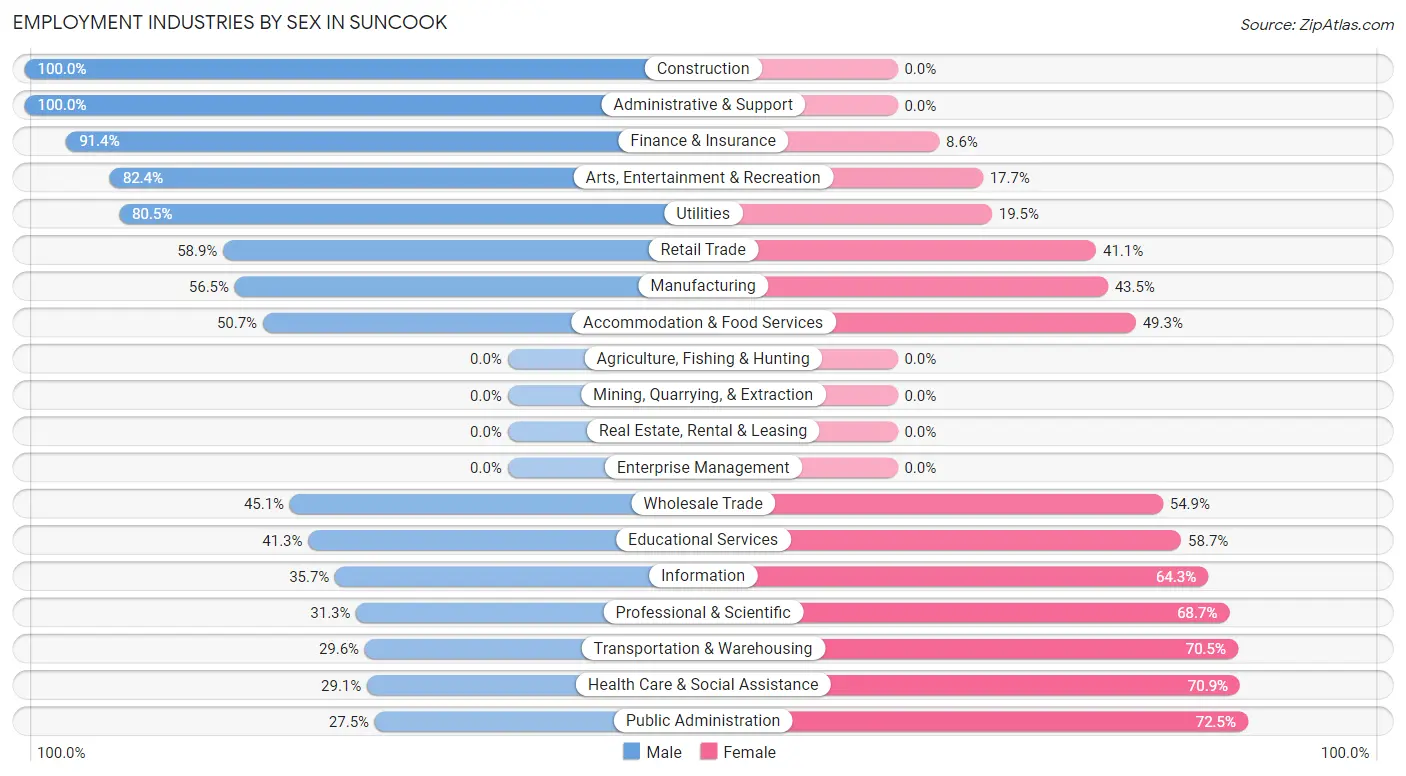
Employment Industries by Sex in Suncook
The Suncook industries that see more men than women are Construction (100.0%), Administrative & Support (100.0%), and Finance & Insurance (91.4%), whereas the industries that tend to have a higher number of women are Public Administration (72.5%), Health Care & Social Assistance (70.9%), and Transportation & Warehousing (70.5%).
| Industry | Male | Female |
| Agriculture, Fishing & Hunting | 0 (0.0%) | 0 (0.0%) |
| Mining, Quarrying, & Extraction | 0 (0.0%) | 0 (0.0%) |
| Construction | 366 (100.0%) | 0 (0.0%) |
| Manufacturing | 183 (56.5%) | 141 (43.5%) |
| Wholesale Trade | 55 (45.1%) | 67 (54.9%) |
| Retail Trade | 245 (58.9%) | 171 (41.1%) |
| Transportation & Warehousing | 13 (29.5%) | 31 (70.5%) |
| Utilities | 70 (80.5%) | 17 (19.5%) |
| Information | 15 (35.7%) | 27 (64.3%) |
| Finance & Insurance | 53 (91.4%) | 5 (8.6%) |
| Real Estate, Rental & Leasing | 0 (0.0%) | 0 (0.0%) |
| Professional & Scientific | 47 (31.3%) | 103 (68.7%) |
| Enterprise Management | 0 (0.0%) | 0 (0.0%) |
| Administrative & Support | 189 (100.0%) | 0 (0.0%) |
| Educational Services | 163 (41.3%) | 232 (58.7%) |
| Health Care & Social Assistance | 101 (29.1%) | 246 (70.9%) |
| Arts, Entertainment & Recreation | 14 (82.4%) | 3 (17.6%) |
| Accommodation & Food Services | 113 (50.7%) | 110 (49.3%) |
| Public Administration | 47 (27.5%) | 124 (72.5%) |
| Total | 1,732 (56.7%) | 1,324 (43.3%) |
Education in Suncook
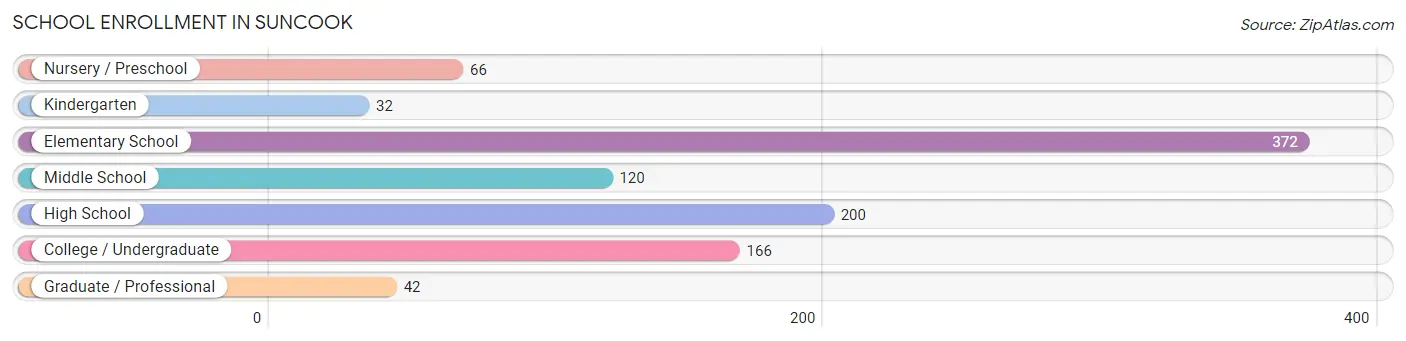
School Enrollment in Suncook
The most common levels of schooling among the 998 students in Suncook are elementary school (372 | 37.3%), high school (200 | 20.0%), and college / undergraduate (166 | 16.6%).
| School Level | # Students | % Students |
| Nursery / Preschool | 66 | 6.6% |
| Kindergarten | 32 | 3.2% |
| Elementary School | 372 | 37.3% |
| Middle School | 120 | 12.0% |
| High School | 200 | 20.0% |
| College / Undergraduate | 166 | 16.6% |
| Graduate / Professional | 42 | 4.2% |
| Total | 998 | 100.0% |
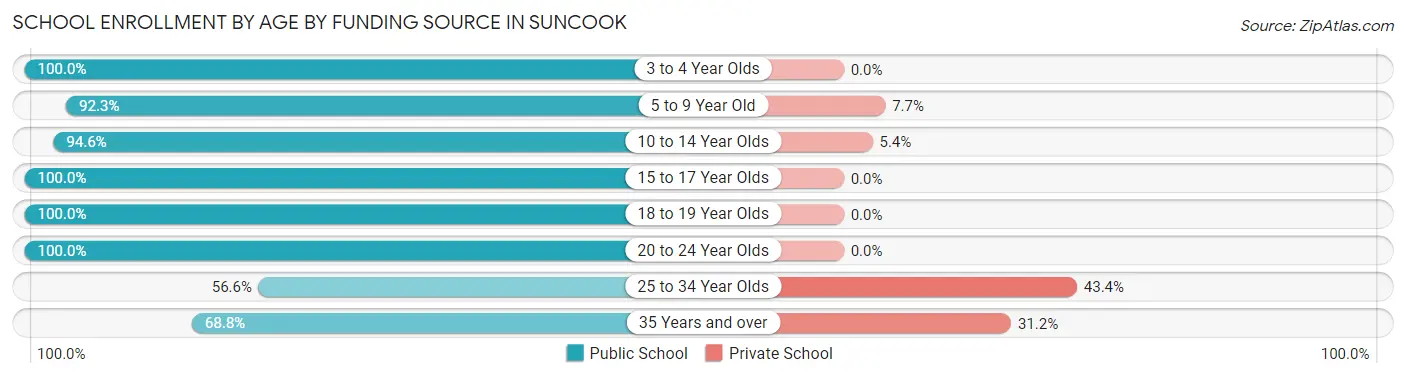
School Enrollment by Age by Funding Source in Suncook
Out of a total of 998 students who are enrolled in schools in Suncook, 104 (10.4%) attend a private institution, while the remaining 894 (89.6%) are enrolled in public schools. The age group of 25 to 34 year olds has the highest likelihood of being enrolled in private schools, with 43 (43.4% in the age bracket) enrolled. Conversely, the age group of 3 to 4 year olds has the lowest likelihood of being enrolled in a private school, with 50 (100.0% in the age bracket) attending a public institution.
| Age Bracket | Public School | Private School |
| 3 to 4 Year Olds | 50 (100.0%) | 0 (0.0%) |
| 5 to 9 Year Old | 310 (92.3%) | 26 (7.7%) |
| 10 to 14 Year Olds | 194 (94.6%) | 11 (5.4%) |
| 15 to 17 Year Olds | 160 (100.0%) | 0 (0.0%) |
| 18 to 19 Year Olds | 39 (100.0%) | 0 (0.0%) |
| 20 to 24 Year Olds | 32 (100.0%) | 0 (0.0%) |
| 25 to 34 Year Olds | 56 (56.6%) | 43 (43.4%) |
| 35 Years and over | 53 (68.8%) | 24 (31.2%) |
| Total | 894 (89.6%) | 104 (10.4%) |
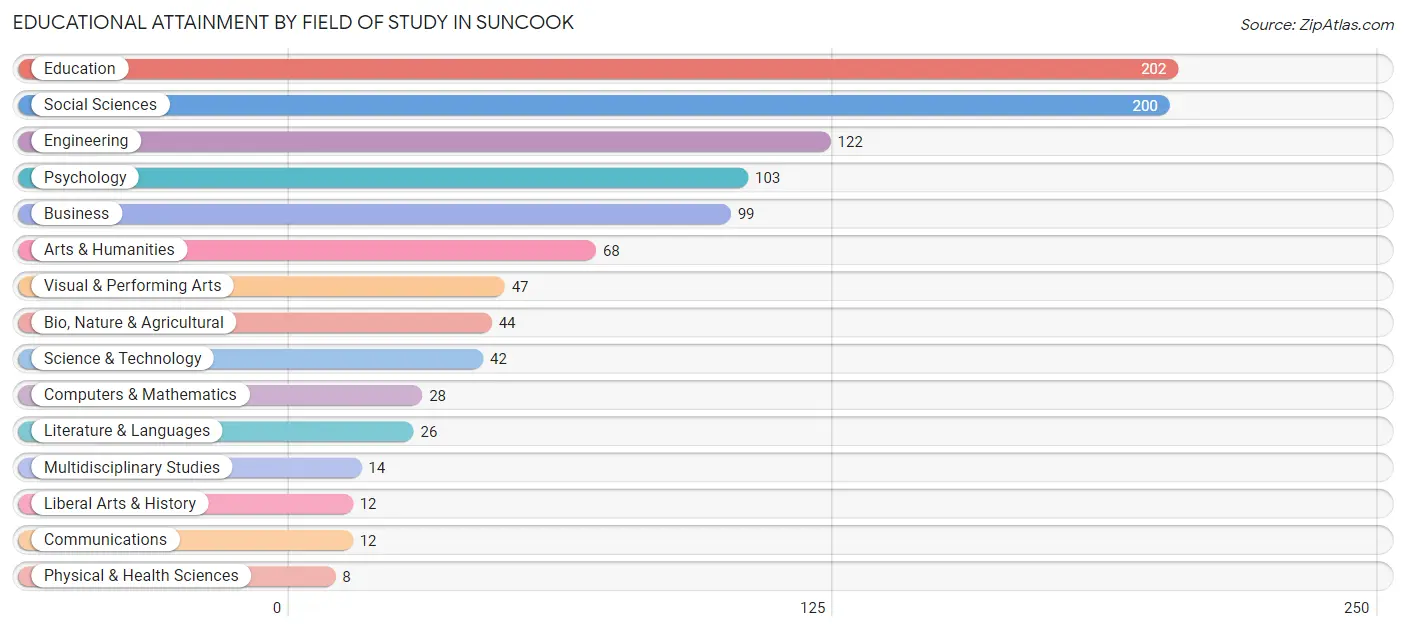
Educational Attainment by Field of Study in Suncook
Education (202 | 19.7%), social sciences (200 | 19.5%), engineering (122 | 11.9%), psychology (103 | 10.0%), and business (99 | 9.6%) are the most common fields of study among 1,027 individuals in Suncook who have obtained a bachelor's degree or higher.
| Field of Study | # Graduates | % Graduates |
| Computers & Mathematics | 28 | 2.7% |
| Bio, Nature & Agricultural | 44 | 4.3% |
| Physical & Health Sciences | 8 | 0.8% |
| Psychology | 103 | 10.0% |
| Social Sciences | 200 | 19.5% |
| Engineering | 122 | 11.9% |
| Multidisciplinary Studies | 14 | 1.4% |
| Science & Technology | 42 | 4.1% |
| Business | 99 | 9.6% |
| Education | 202 | 19.7% |
| Literature & Languages | 26 | 2.5% |
| Liberal Arts & History | 12 | 1.2% |
| Visual & Performing Arts | 47 | 4.6% |
| Communications | 12 | 1.2% |
| Arts & Humanities | 68 | 6.6% |
| Total | 1,027 | 100.0% |
Transportation & Commute in Suncook
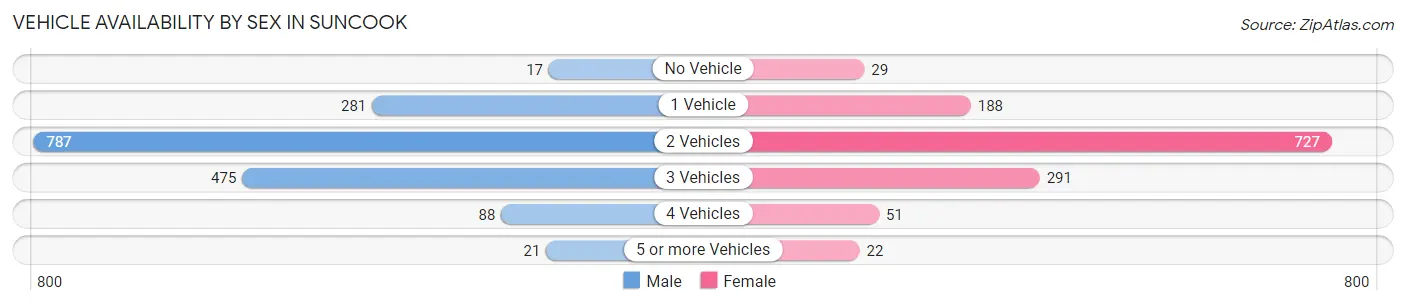
Vehicle Availability by Sex in Suncook
The most prevalent vehicle ownership categories in Suncook are males with 2 vehicles (787, accounting for 47.1%) and females with 2 vehicles (727, making up 60.2%).
| Vehicles Available | Male | Female |
| No Vehicle | 17 (1.0%) | 29 (2.2%) |
| 1 Vehicle | 281 (16.8%) | 188 (14.4%) |
| 2 Vehicles | 787 (47.1%) | 727 (55.6%) |
| 3 Vehicles | 475 (28.5%) | 291 (22.3%) |
| 4 Vehicles | 88 (5.3%) | 51 (3.9%) |
| 5 or more Vehicles | 21 (1.3%) | 22 (1.7%) |
| Total | 1,669 (100.0%) | 1,308 (100.0%) |
Commute Time in Suncook
The most frequently occuring commute durations in Suncook are 20 to 24 minutes (614 commuters, 24.0%), 10 to 14 minutes (403 commuters, 15.8%), and 15 to 19 minutes (345 commuters, 13.5%).
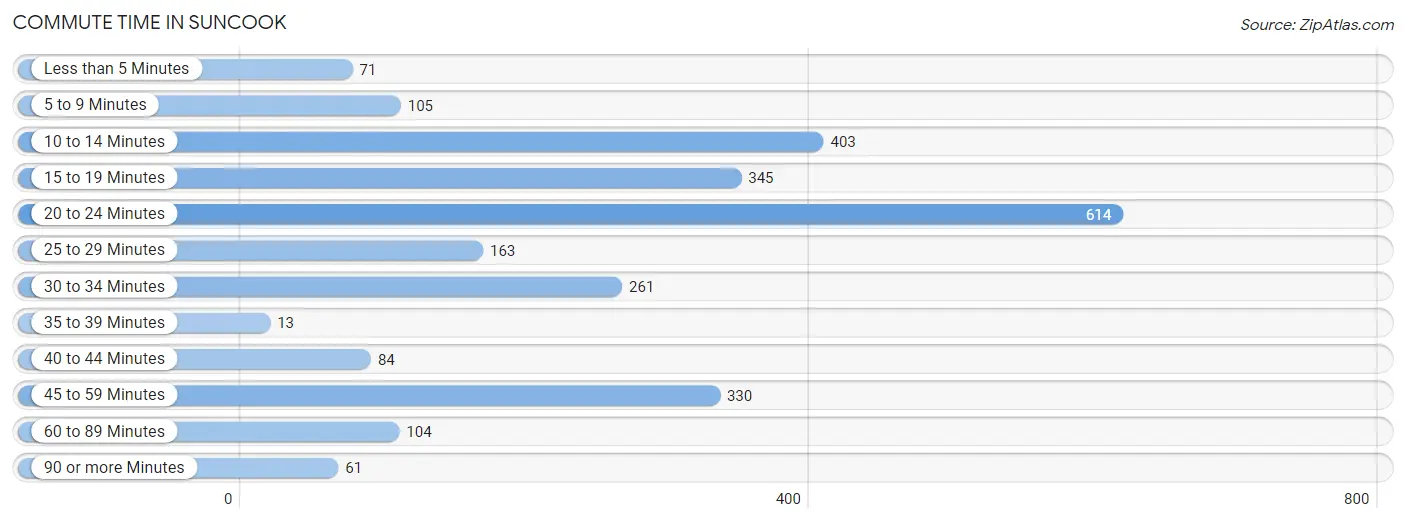
| Commute Time | # Commuters | % Commuters |
| Less than 5 Minutes | 71 | 2.8% |
| 5 to 9 Minutes | 105 | 4.1% |
| 10 to 14 Minutes | 403 | 15.8% |
| 15 to 19 Minutes | 345 | 13.5% |
| 20 to 24 Minutes | 614 | 24.0% |
| 25 to 29 Minutes | 163 | 6.4% |
| 30 to 34 Minutes | 261 | 10.2% |
| 35 to 39 Minutes | 13 | 0.5% |
| 40 to 44 Minutes | 84 | 3.3% |
| 45 to 59 Minutes | 330 | 12.9% |
| 60 to 89 Minutes | 104 | 4.1% |
| 90 or more Minutes | 61 | 2.4% |
Commute Time by Sex in Suncook
The most common commute times in Suncook are 20 to 24 minutes (363 commuters, 24.5%) for males and 20 to 24 minutes (251 commuters, 23.4%) for females.
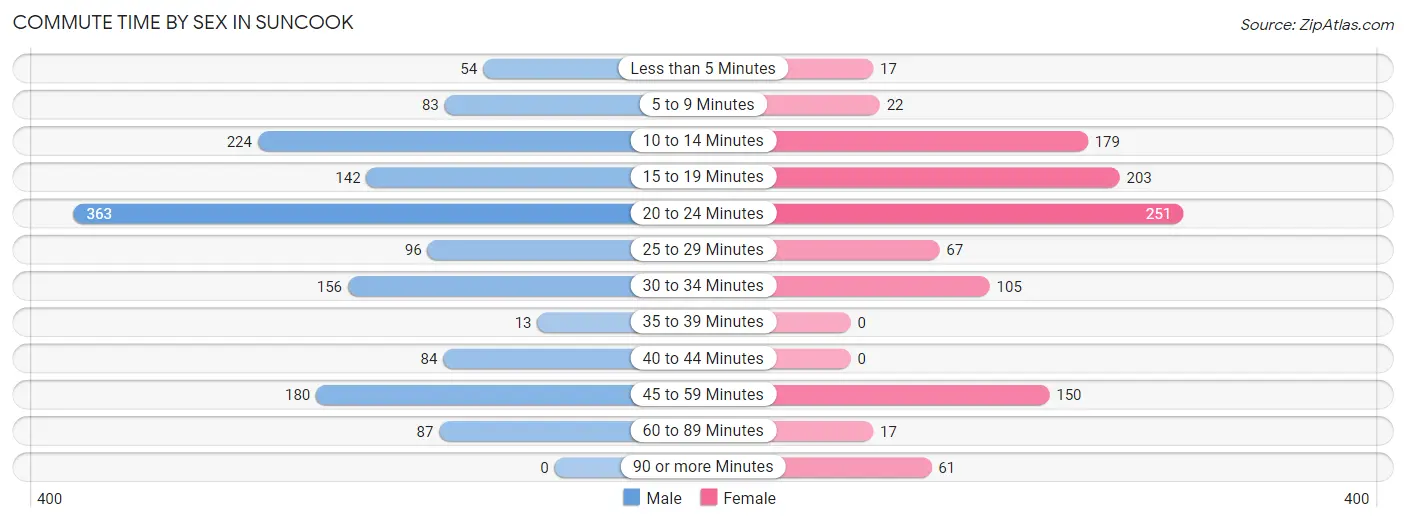
| Commute Time | Male | Female |
| Less than 5 Minutes | 54 (3.6%) | 17 (1.6%) |
| 5 to 9 Minutes | 83 (5.6%) | 22 (2.1%) |
| 10 to 14 Minutes | 224 (15.1%) | 179 (16.7%) |
| 15 to 19 Minutes | 142 (9.6%) | 203 (18.9%) |
| 20 to 24 Minutes | 363 (24.5%) | 251 (23.4%) |
| 25 to 29 Minutes | 96 (6.5%) | 67 (6.2%) |
| 30 to 34 Minutes | 156 (10.5%) | 105 (9.8%) |
| 35 to 39 Minutes | 13 (0.9%) | 0 (0.0%) |
| 40 to 44 Minutes | 84 (5.7%) | 0 (0.0%) |
| 45 to 59 Minutes | 180 (12.1%) | 150 (14.0%) |
| 60 to 89 Minutes | 87 (5.9%) | 17 (1.6%) |
| 90 or more Minutes | 0 (0.0%) | 61 (5.7%) |
Time of Departure to Work by Sex in Suncook
The most frequent times of departure to work in Suncook are 7:00 AM to 7:29 AM (311, 21.0%) for males and 7:00 AM to 7:29 AM (325, 30.3%) for females.
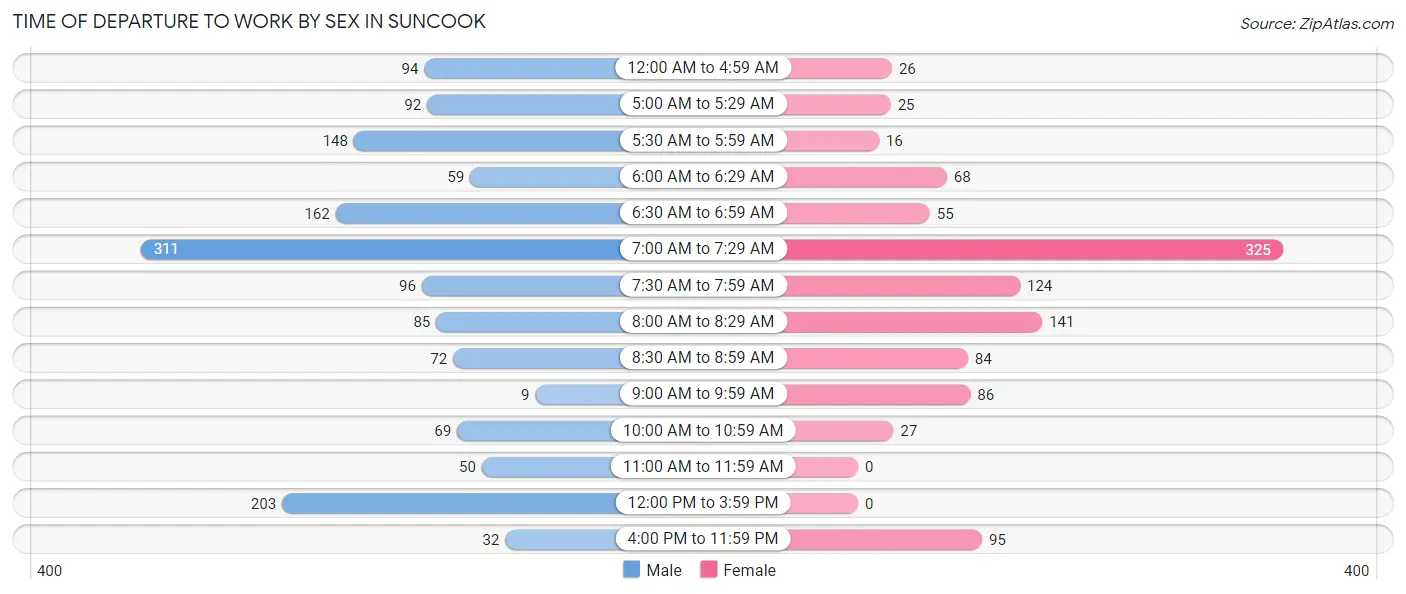
| Time of Departure | Male | Female |
| 12:00 AM to 4:59 AM | 94 (6.3%) | 26 (2.4%) |
| 5:00 AM to 5:29 AM | 92 (6.2%) | 25 (2.3%) |
| 5:30 AM to 5:59 AM | 148 (10.0%) | 16 (1.5%) |
| 6:00 AM to 6:29 AM | 59 (4.0%) | 68 (6.3%) |
| 6:30 AM to 6:59 AM | 162 (10.9%) | 55 (5.1%) |
| 7:00 AM to 7:29 AM | 311 (21.0%) | 325 (30.3%) |
| 7:30 AM to 7:59 AM | 96 (6.5%) | 124 (11.6%) |
| 8:00 AM to 8:29 AM | 85 (5.7%) | 141 (13.2%) |
| 8:30 AM to 8:59 AM | 72 (4.9%) | 84 (7.8%) |
| 9:00 AM to 9:59 AM | 9 (0.6%) | 86 (8.0%) |
| 10:00 AM to 10:59 AM | 69 (4.7%) | 27 (2.5%) |
| 11:00 AM to 11:59 AM | 50 (3.4%) | 0 (0.0%) |
| 12:00 PM to 3:59 PM | 203 (13.7%) | 0 (0.0%) |
| 4:00 PM to 11:59 PM | 32 (2.2%) | 95 (8.9%) |
| Total | 1,482 (100.0%) | 1,072 (100.0%) |
Housing Occupancy in Suncook
Occupancy by Ownership in Suncook
Of the total 2,246 dwellings in Suncook, owner-occupied units account for 1,442 (64.2%), while renter-occupied units make up 804 (35.8%).
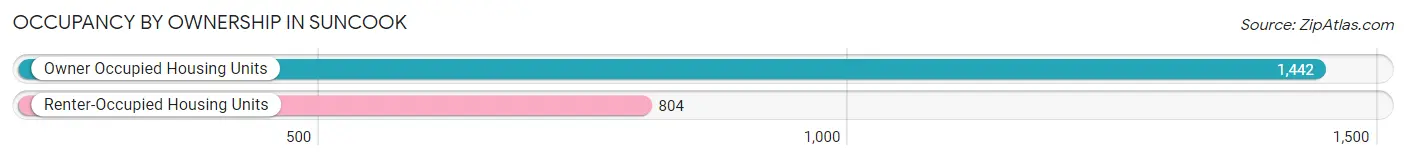
| Occupancy | # Housing Units | % Housing Units |
| Owner Occupied Housing Units | 1,442 | 64.2% |
| Renter-Occupied Housing Units | 804 | 35.8% |
| Total Occupied Housing Units | 2,246 | 100.0% |
Occupancy by Household Size in Suncook
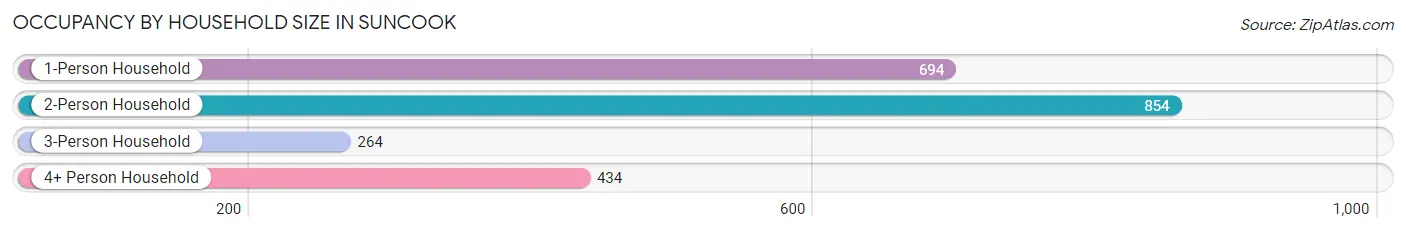
| Household Size | # Housing Units | % Housing Units |
| 1-Person Household | 694 | 30.9% |
| 2-Person Household | 854 | 38.0% |
| 3-Person Household | 264 | 11.7% |
| 4+ Person Household | 434 | 19.3% |
| Total Housing Units | 2,246 | 100.0% |
Occupancy by Ownership by Household Size in Suncook
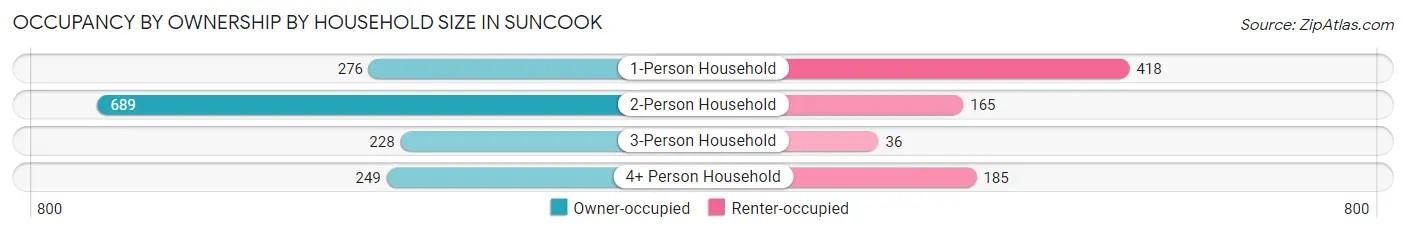
| Household Size | Owner-occupied | Renter-occupied |
| 1-Person Household | 276 (39.8%) | 418 (60.2%) |
| 2-Person Household | 689 (80.7%) | 165 (19.3%) |
| 3-Person Household | 228 (86.4%) | 36 (13.6%) |
| 4+ Person Household | 249 (57.4%) | 185 (42.6%) |
| Total Housing Units | 1,442 (64.2%) | 804 (35.8%) |
Occupancy by Educational Attainment in Suncook
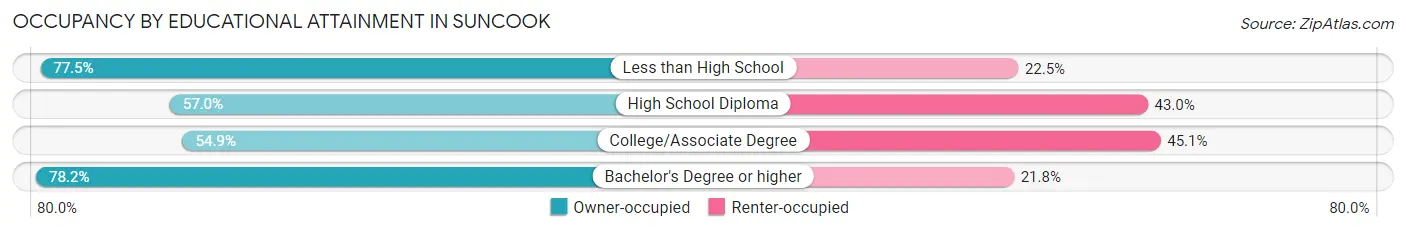
| Household Size | Owner-occupied | Renter-occupied |
| Less than High School | 131 (77.5%) | 38 (22.5%) |
| High School Diploma | 315 (57.0%) | 238 (43.0%) |
| College/Associate Degree | 462 (54.9%) | 379 (45.1%) |
| Bachelor's Degree or higher | 534 (78.2%) | 149 (21.8%) |
Occupancy by Age of Householder in Suncook
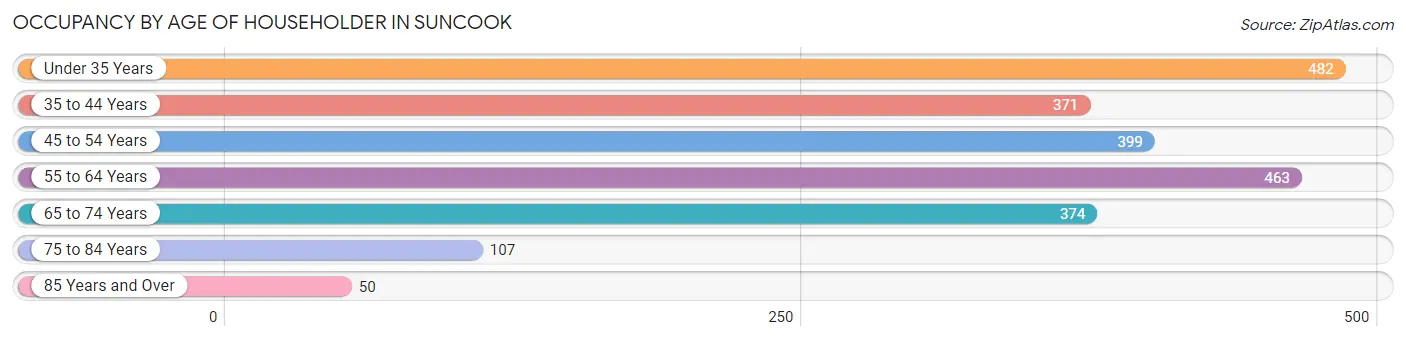
| Age Bracket | # Households | % Households |
| Under 35 Years | 482 | 21.5% |
| 35 to 44 Years | 371 | 16.5% |
| 45 to 54 Years | 399 | 17.8% |
| 55 to 64 Years | 463 | 20.6% |
| 65 to 74 Years | 374 | 16.7% |
| 75 to 84 Years | 107 | 4.8% |
| 85 Years and Over | 50 | 2.2% |
| Total | 2,246 | 100.0% |
Housing Finances in Suncook
Median Income by Occupancy in Suncook
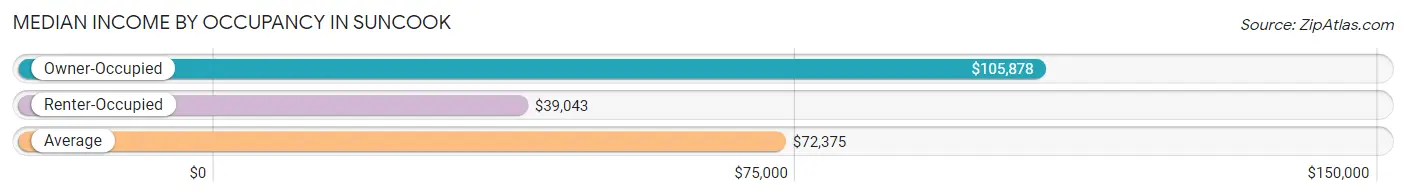
| Occupancy Type | # Households | Median Income |
| Owner-Occupied | 1,442 (64.2%) | $105,878 |
| Renter-Occupied | 804 (35.8%) | $39,043 |
| Average | 2,246 (100.0%) | $72,375 |
Occupancy by Householder Income Bracket in Suncook
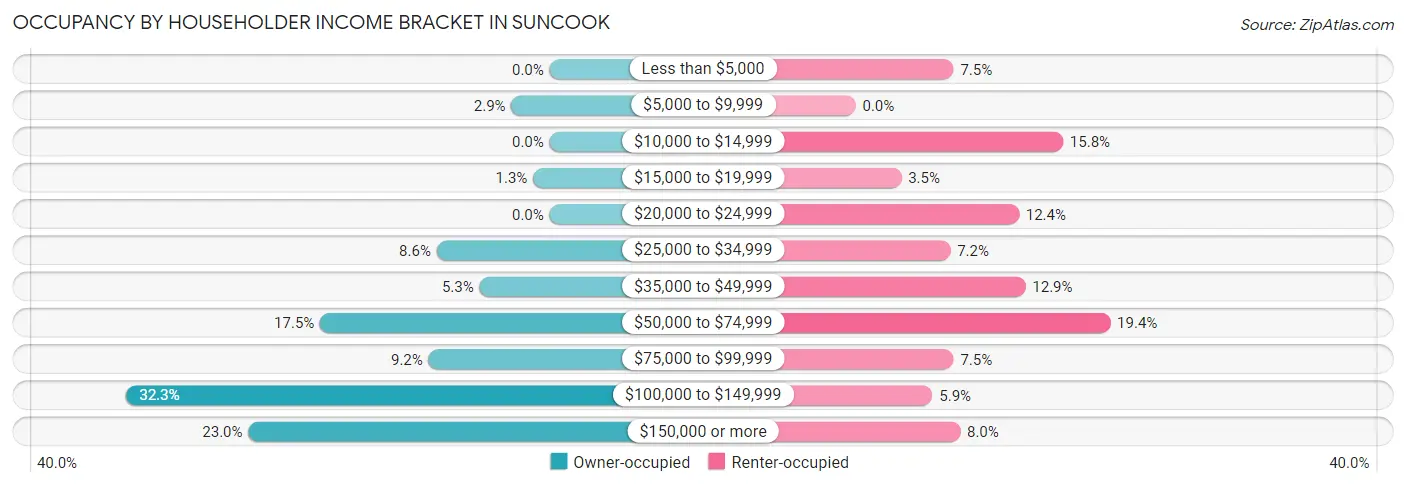
| Income Bracket | Owner-occupied | Renter-occupied |
| Less than $5,000 | 0 (0.0%) | 60 (7.5%) |
| $5,000 to $9,999 | 42 (2.9%) | 0 (0.0%) |
| $10,000 to $14,999 | 0 (0.0%) | 127 (15.8%) |
| $15,000 to $19,999 | 18 (1.3%) | 28 (3.5%) |
| $20,000 to $24,999 | 0 (0.0%) | 100 (12.4%) |
| $25,000 to $34,999 | 124 (8.6%) | 58 (7.2%) |
| $35,000 to $49,999 | 77 (5.3%) | 104 (12.9%) |
| $50,000 to $74,999 | 252 (17.5%) | 156 (19.4%) |
| $75,000 to $99,999 | 133 (9.2%) | 60 (7.5%) |
| $100,000 to $149,999 | 465 (32.3%) | 47 (5.9%) |
| $150,000 or more | 331 (23.0%) | 64 (8.0%) |
| Total | 1,442 (100.0%) | 804 (100.0%) |
Monthly Housing Cost Tiers in Suncook
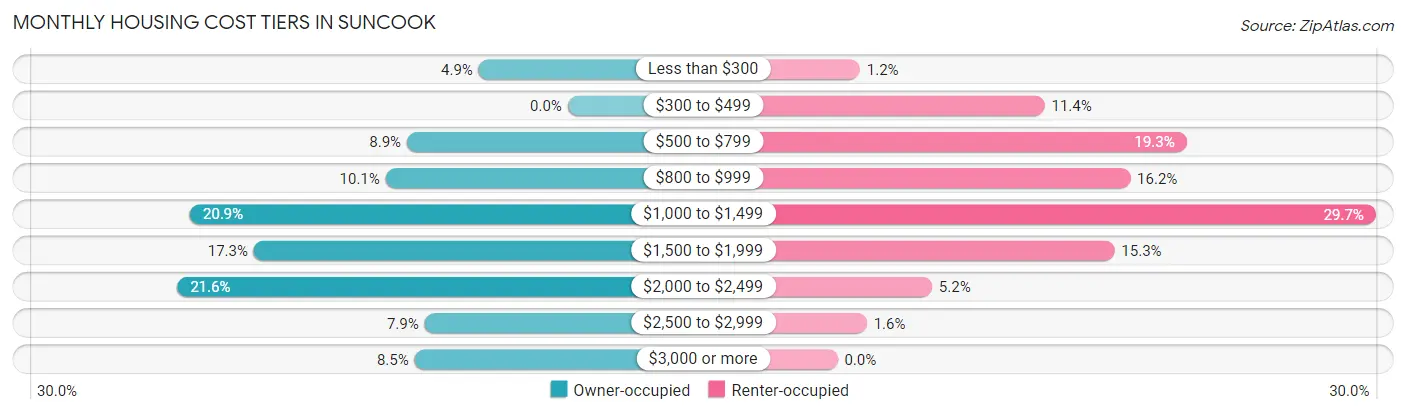
| Monthly Cost | Owner-occupied | Renter-occupied |
| Less than $300 | 71 (4.9%) | 10 (1.2%) |
| $300 to $499 | 0 (0.0%) | 92 (11.4%) |
| $500 to $799 | 128 (8.9%) | 155 (19.3%) |
| $800 to $999 | 145 (10.1%) | 130 (16.2%) |
| $1,000 to $1,499 | 301 (20.9%) | 239 (29.7%) |
| $1,500 to $1,999 | 250 (17.3%) | 123 (15.3%) |
| $2,000 to $2,499 | 311 (21.6%) | 42 (5.2%) |
| $2,500 to $2,999 | 114 (7.9%) | 13 (1.6%) |
| $3,000 or more | 122 (8.5%) | 0 (0.0%) |
| Total | 1,442 (100.0%) | 804 (100.0%) |
Physical Housing Characteristics in Suncook
Housing Structures in Suncook
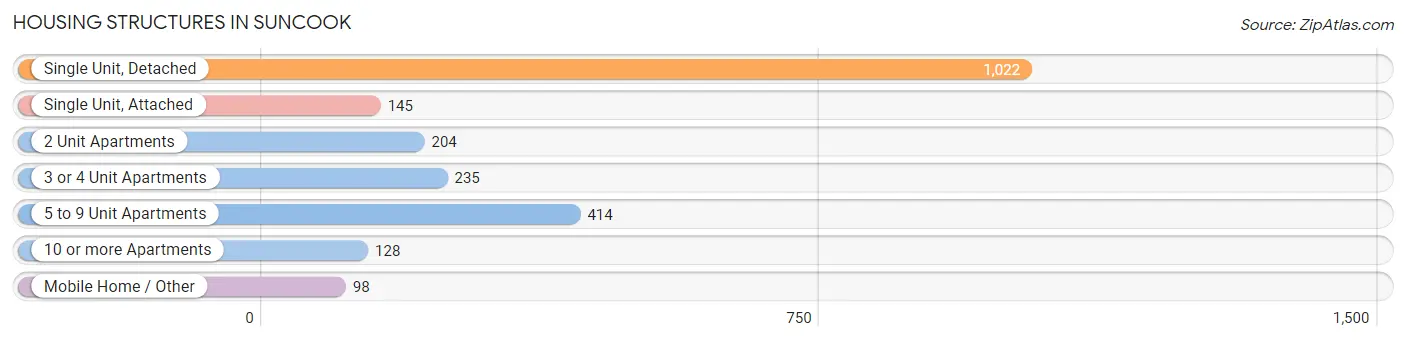
| Structure Type | # Housing Units | % Housing Units |
| Single Unit, Detached | 1,022 | 45.5% |
| Single Unit, Attached | 145 | 6.5% |
| 2 Unit Apartments | 204 | 9.1% |
| 3 or 4 Unit Apartments | 235 | 10.5% |
| 5 to 9 Unit Apartments | 414 | 18.4% |
| 10 or more Apartments | 128 | 5.7% |
| Mobile Home / Other | 98 | 4.4% |
| Total | 2,246 | 100.0% |
Housing Structures by Occupancy in Suncook
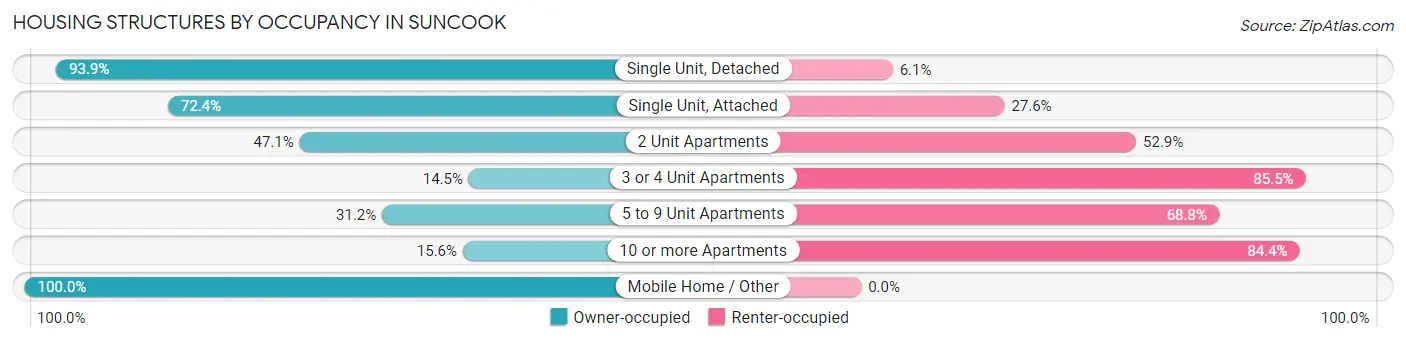
| Structure Type | Owner-occupied | Renter-occupied |
| Single Unit, Detached | 960 (93.9%) | 62 (6.1%) |
| Single Unit, Attached | 105 (72.4%) | 40 (27.6%) |
| 2 Unit Apartments | 96 (47.1%) | 108 (52.9%) |
| 3 or 4 Unit Apartments | 34 (14.5%) | 201 (85.5%) |
| 5 to 9 Unit Apartments | 129 (31.2%) | 285 (68.8%) |
| 10 or more Apartments | 20 (15.6%) | 108 (84.4%) |
| Mobile Home / Other | 98 (100.0%) | 0 (0.0%) |
| Total | 1,442 (64.2%) | 804 (35.8%) |
Housing Structures by Number of Rooms in Suncook
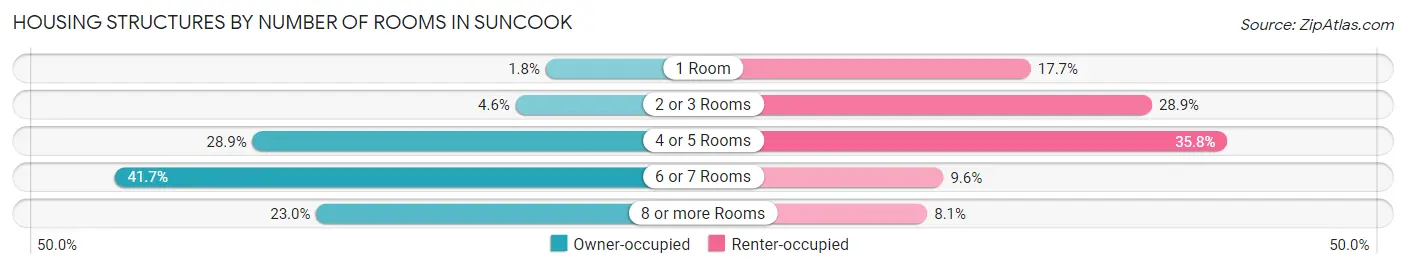
| Number of Rooms | Owner-occupied | Renter-occupied |
| 1 Room | 26 (1.8%) | 142 (17.7%) |
| 2 or 3 Rooms | 66 (4.6%) | 232 (28.9%) |
| 4 or 5 Rooms | 417 (28.9%) | 288 (35.8%) |
| 6 or 7 Rooms | 601 (41.7%) | 77 (9.6%) |
| 8 or more Rooms | 332 (23.0%) | 65 (8.1%) |
| Total | 1,442 (100.0%) | 804 (100.0%) |
Housing Structure by Heating Type in Suncook
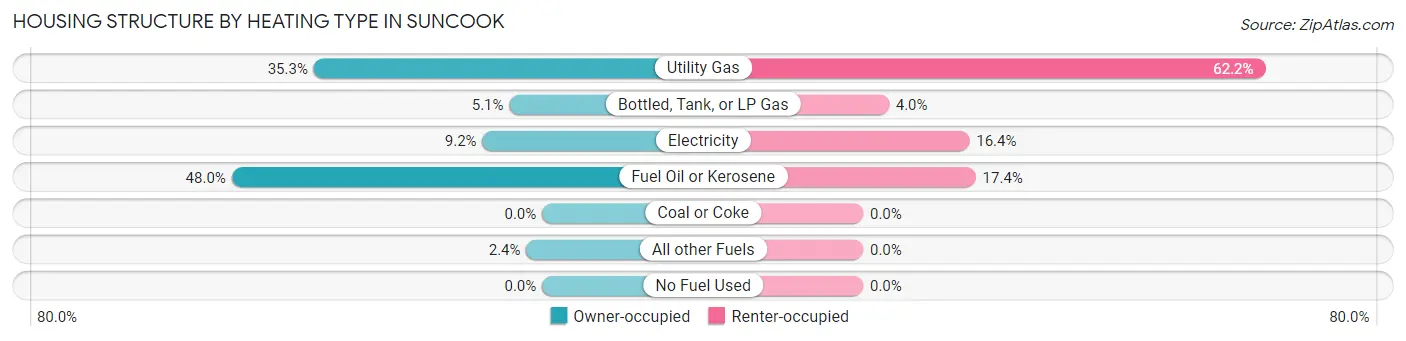
| Heating Type | Owner-occupied | Renter-occupied |
| Utility Gas | 509 (35.3%) | 500 (62.2%) |
| Bottled, Tank, or LP Gas | 73 (5.1%) | 32 (4.0%) |
| Electricity | 133 (9.2%) | 132 (16.4%) |
| Fuel Oil or Kerosene | 692 (48.0%) | 140 (17.4%) |
| Coal or Coke | 0 (0.0%) | 0 (0.0%) |
| All other Fuels | 35 (2.4%) | 0 (0.0%) |
| No Fuel Used | 0 (0.0%) | 0 (0.0%) |
| Total | 1,442 (100.0%) | 804 (100.0%) |
Household Vehicle Usage in Suncook
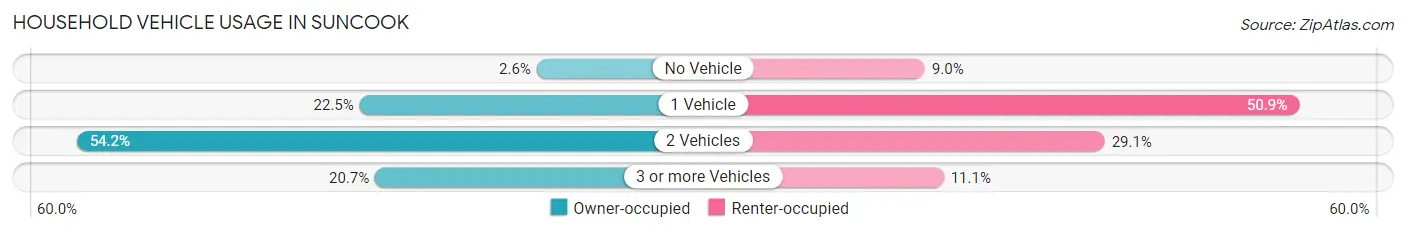
| Vehicles per Household | Owner-occupied | Renter-occupied |
| No Vehicle | 38 (2.6%) | 72 (9.0%) |
| 1 Vehicle | 324 (22.5%) | 409 (50.9%) |
| 2 Vehicles | 781 (54.2%) | 234 (29.1%) |
| 3 or more Vehicles | 299 (20.7%) | 89 (11.1%) |
| Total | 1,442 (100.0%) | 804 (100.0%) |
Real Estate & Mortgages in Suncook
Real Estate and Mortgage Overview in Suncook
| Characteristic | Without Mortgage | With Mortgage |
| Housing Units | 507 | 935 |
| Median Property Value | $263,100 | $281,800 |
| Median Household Income | $51,750 | $285 |
| Monthly Housing Costs | $909 | $122 |
| Real Estate Taxes | $6,024 | $22 |
Property Value by Mortgage Status in Suncook
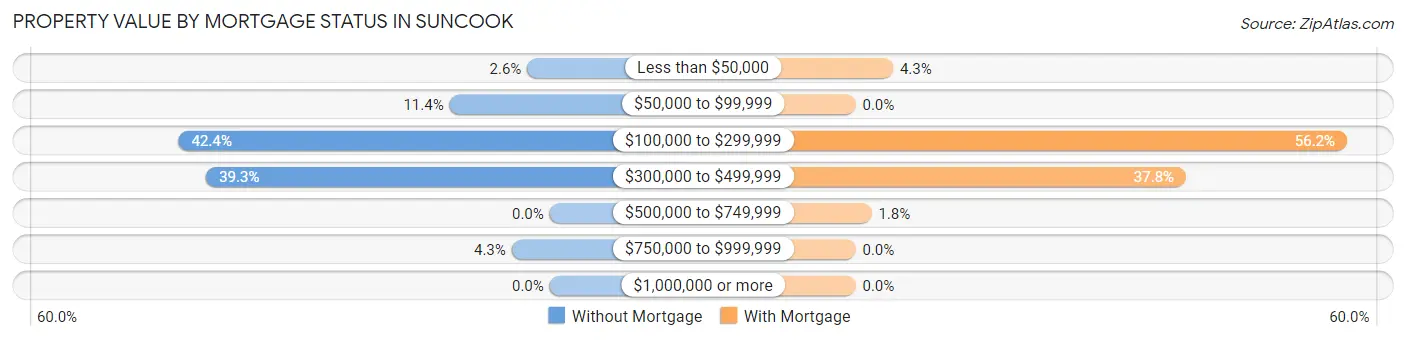
| Property Value | Without Mortgage | With Mortgage |
| Less than $50,000 | 13 (2.6%) | 40 (4.3%) |
| $50,000 to $99,999 | 58 (11.4%) | 0 (0.0%) |
| $100,000 to $299,999 | 215 (42.4%) | 525 (56.1%) |
| $300,000 to $499,999 | 199 (39.3%) | 353 (37.8%) |
| $500,000 to $749,999 | 0 (0.0%) | 17 (1.8%) |
| $750,000 to $999,999 | 22 (4.3%) | 0 (0.0%) |
| $1,000,000 or more | 0 (0.0%) | 0 (0.0%) |
| Total | 507 (100.0%) | 935 (100.0%) |
Household Income by Mortgage Status in Suncook
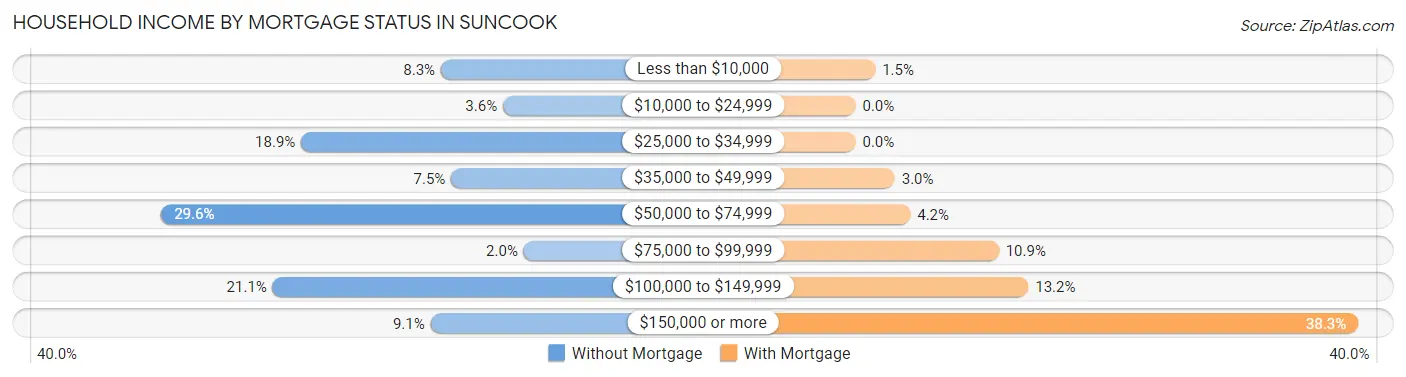
| Household Income | Without Mortgage | With Mortgage |
| Less than $10,000 | 42 (8.3%) | 14 (1.5%) |
| $10,000 to $24,999 | 18 (3.5%) | 0 (0.0%) |
| $25,000 to $34,999 | 96 (18.9%) | 0 (0.0%) |
| $35,000 to $49,999 | 38 (7.5%) | 28 (3.0%) |
| $50,000 to $74,999 | 150 (29.6%) | 39 (4.2%) |
| $75,000 to $99,999 | 10 (2.0%) | 102 (10.9%) |
| $100,000 to $149,999 | 107 (21.1%) | 123 (13.2%) |
| $150,000 or more | 46 (9.1%) | 358 (38.3%) |
| Total | 507 (100.0%) | 935 (100.0%) |
Property Value to Household Income Ratio in Suncook
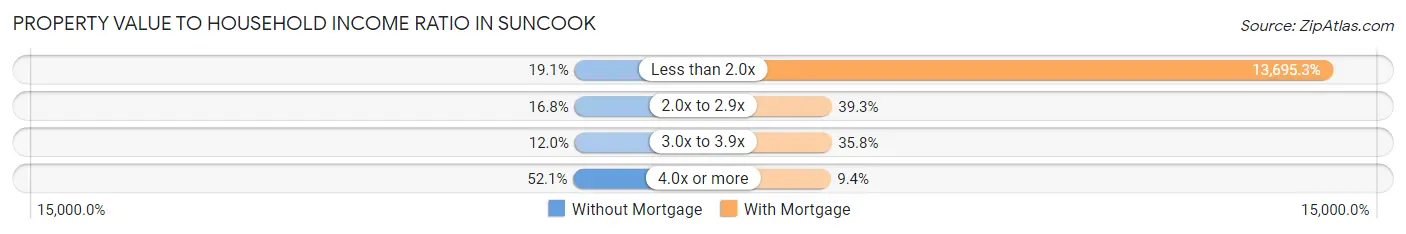
| Value-to-Income Ratio | Without Mortgage | With Mortgage |
| Less than 2.0x | 97 (19.1%) | 128,051 (13,695.3%) |
| 2.0x to 2.9x | 85 (16.8%) | 367 (39.3%) |
| 3.0x to 3.9x | 61 (12.0%) | 335 (35.8%) |
| 4.0x or more | 264 (52.1%) | 88 (9.4%) |
| Total | 507 (100.0%) | 935 (100.0%) |
Real Estate Taxes by Mortgage Status in Suncook
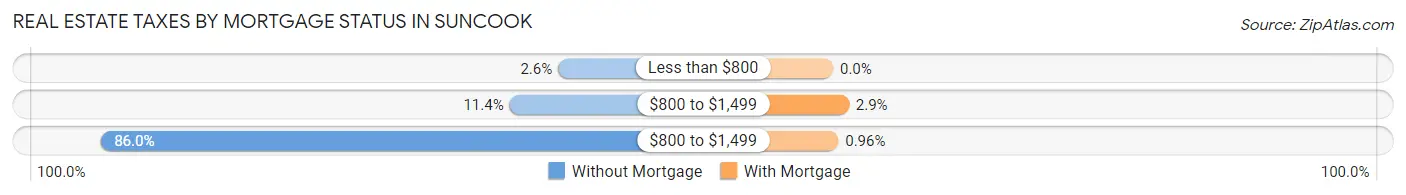
| Property Taxes | Without Mortgage | With Mortgage |
| Less than $800 | 13 (2.6%) | 0 (0.0%) |
| $800 to $1,499 | 58 (11.4%) | 27 (2.9%) |
| $800 to $1,499 | 436 (86.0%) | 9 (1.0%) |
| Total | 507 (100.0%) | 935 (100.0%) |
Health & Disability in Suncook
Health Insurance Coverage by Age in Suncook
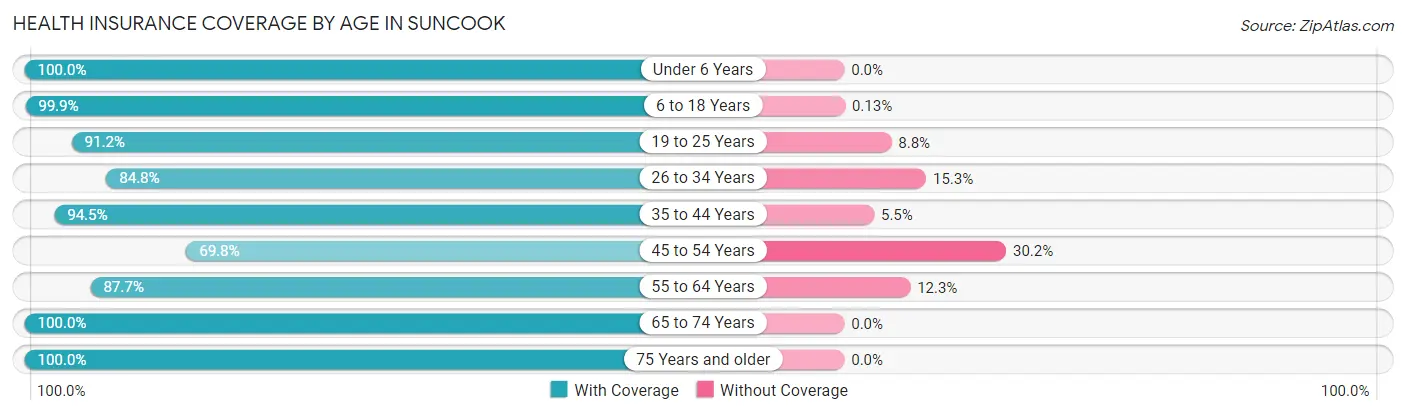
| Age Bracket | With Coverage | Without Coverage |
| Under 6 Years | 311 (100.0%) | 0 (0.0%) |
| 6 to 18 Years | 795 (99.9%) | 1 (0.1%) |
| 19 to 25 Years | 499 (91.2%) | 48 (8.8%) |
| 26 to 34 Years | 489 (84.8%) | 88 (15.2%) |
| 35 to 44 Years | 716 (94.5%) | 42 (5.5%) |
| 45 to 54 Years | 514 (69.8%) | 222 (30.2%) |
| 55 to 64 Years | 628 (87.7%) | 88 (12.3%) |
| 65 to 74 Years | 525 (100.0%) | 0 (0.0%) |
| 75 Years and older | 267 (100.0%) | 0 (0.0%) |
| Total | 4,744 (90.7%) | 489 (9.3%) |
Health Insurance Coverage by Citizenship Status in Suncook
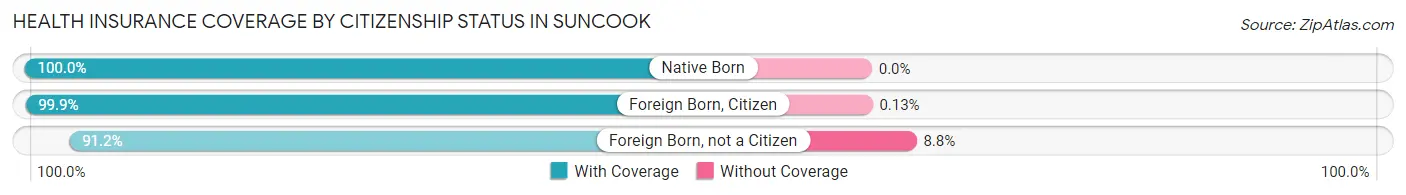
| Citizenship Status | With Coverage | Without Coverage |
| Native Born | 311 (100.0%) | 0 (0.0%) |
| Foreign Born, Citizen | 795 (99.9%) | 1 (0.1%) |
| Foreign Born, not a Citizen | 499 (91.2%) | 48 (8.8%) |
Health Insurance Coverage by Household Income in Suncook
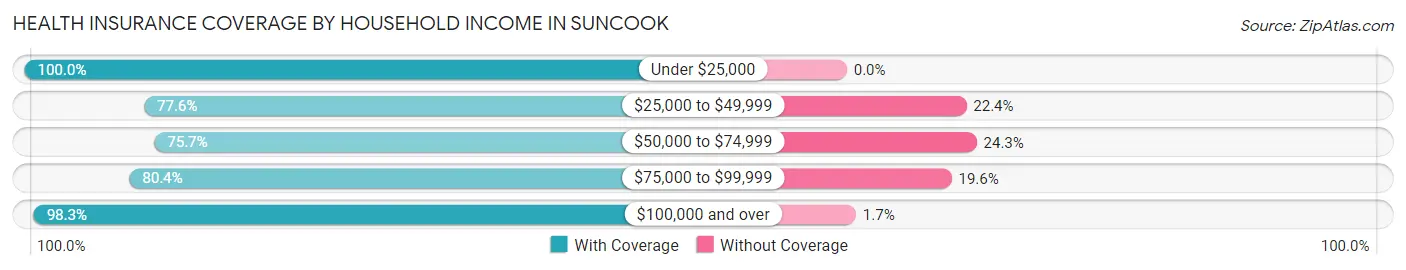
| Household Income | With Coverage | Without Coverage |
| Under $25,000 | 733 (100.0%) | 0 (0.0%) |
| $25,000 to $49,999 | 433 (77.6%) | 125 (22.4%) |
| $50,000 to $74,999 | 669 (75.7%) | 215 (24.3%) |
| $75,000 to $99,999 | 430 (80.4%) | 105 (19.6%) |
| $100,000 and over | 2,475 (98.3%) | 43 (1.7%) |
Public vs Private Health Insurance Coverage by Age in Suncook
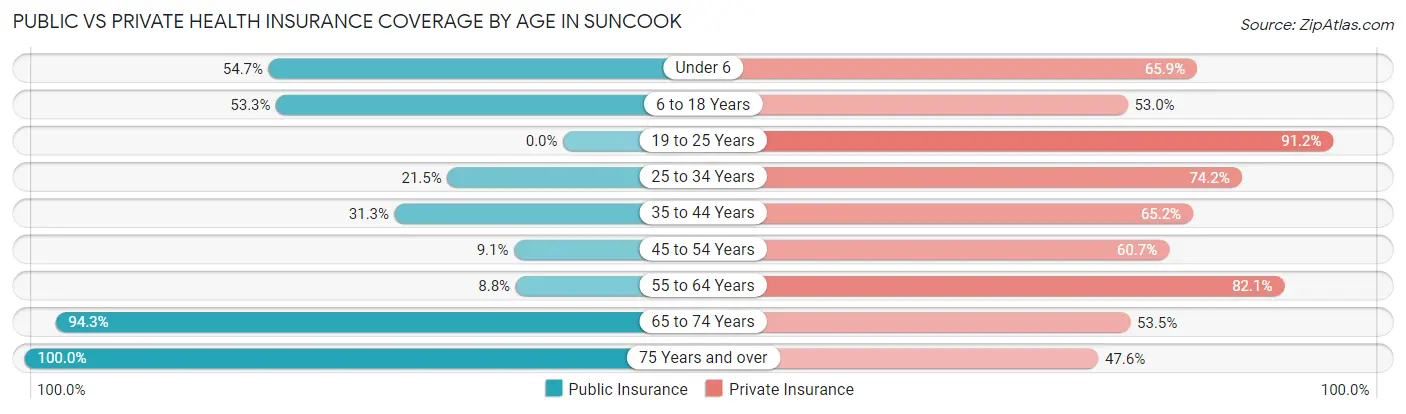
| Age Bracket | Public Insurance | Private Insurance |
| Under 6 | 170 (54.7%) | 205 (65.9%) |
| 6 to 18 Years | 424 (53.3%) | 422 (53.0%) |
| 19 to 25 Years | 0 (0.0%) | 499 (91.2%) |
| 25 to 34 Years | 124 (21.5%) | 428 (74.2%) |
| 35 to 44 Years | 237 (31.3%) | 494 (65.2%) |
| 45 to 54 Years | 67 (9.1%) | 447 (60.7%) |
| 55 to 64 Years | 63 (8.8%) | 588 (82.1%) |
| 65 to 74 Years | 495 (94.3%) | 281 (53.5%) |
| 75 Years and over | 267 (100.0%) | 127 (47.6%) |
| Total | 1,847 (35.3%) | 3,491 (66.7%) |
Disability Status by Sex by Age in Suncook
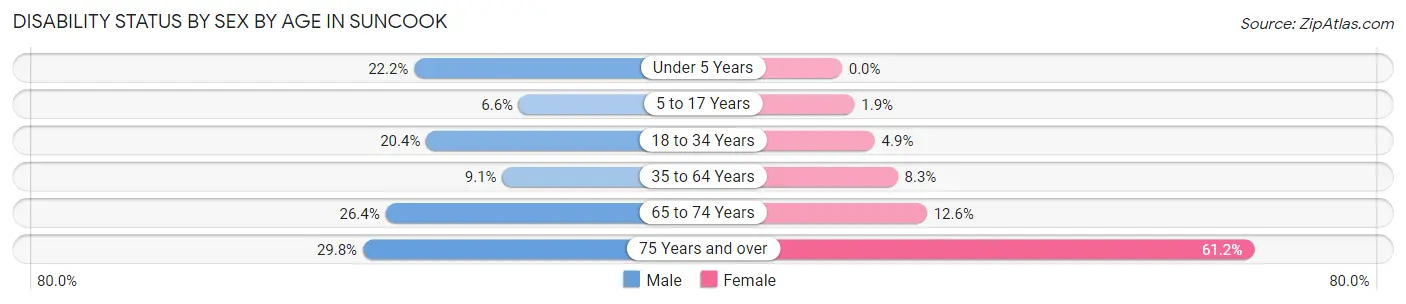
| Age Bracket | Male | Female |
| Under 5 Years | 35 (22.2%) | 0 (0.0%) |
| 5 to 17 Years | 25 (6.6%) | 6 (1.9%) |
| 18 to 34 Years | 135 (20.4%) | 29 (4.9%) |
| 35 to 64 Years | 117 (9.0%) | 76 (8.3%) |
| 65 to 74 Years | 80 (26.4%) | 28 (12.6%) |
| 75 Years and over | 25 (29.8%) | 112 (61.2%) |
Disability Class by Sex by Age in Suncook
Disability Class: Hearing Difficulty
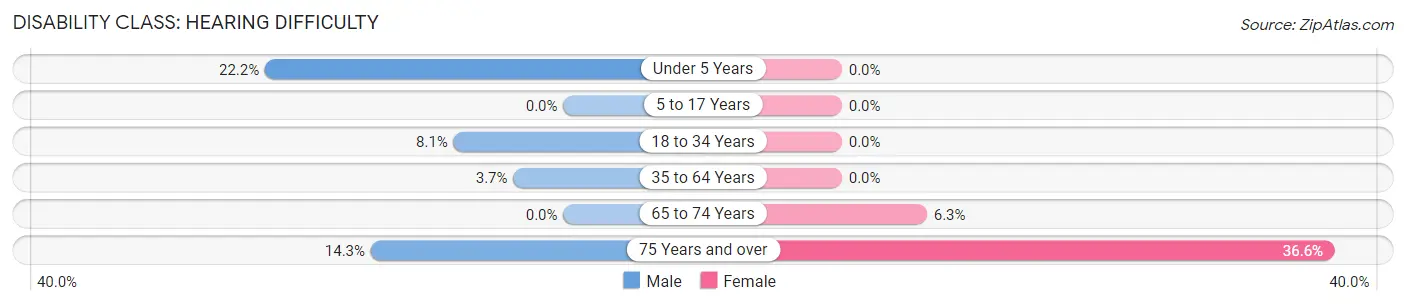
| Age Bracket | Male | Female |
| Under 5 Years | 35 (22.2%) | 0 (0.0%) |
| 5 to 17 Years | 0 (0.0%) | 0 (0.0%) |
| 18 to 34 Years | 54 (8.1%) | 0 (0.0%) |
| 35 to 64 Years | 48 (3.7%) | 0 (0.0%) |
| 65 to 74 Years | 0 (0.0%) | 14 (6.3%) |
| 75 Years and over | 12 (14.3%) | 67 (36.6%) |
Disability Class: Vision Difficulty
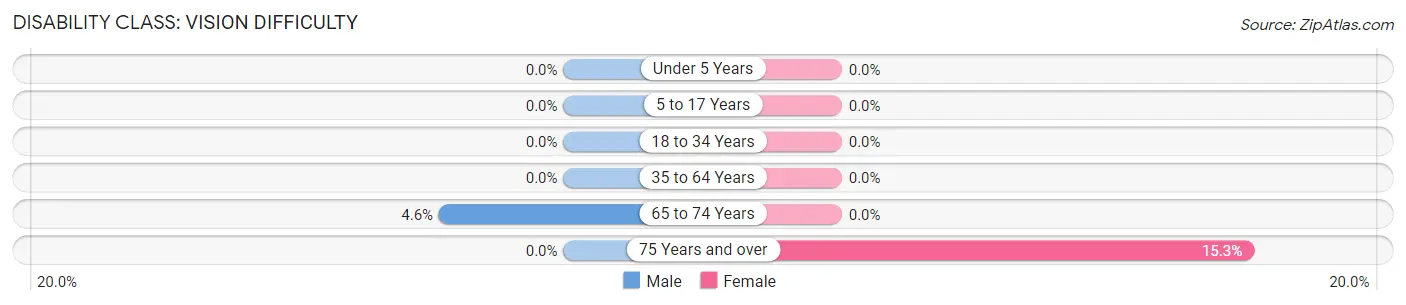
| Age Bracket | Male | Female |
| Under 5 Years | 0 (0.0%) | 0 (0.0%) |
| 5 to 17 Years | 0 (0.0%) | 0 (0.0%) |
| 18 to 34 Years | 0 (0.0%) | 0 (0.0%) |
| 35 to 64 Years | 0 (0.0%) | 0 (0.0%) |
| 65 to 74 Years | 14 (4.6%) | 0 (0.0%) |
| 75 Years and over | 0 (0.0%) | 28 (15.3%) |
Disability Class: Cognitive Difficulty
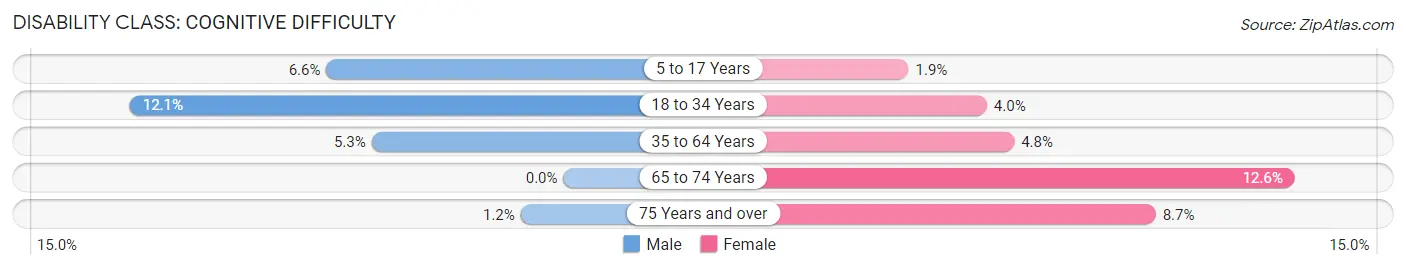
| Age Bracket | Male | Female |
| 5 to 17 Years | 25 (6.6%) | 6 (1.9%) |
| 18 to 34 Years | 80 (12.1%) | 24 (4.0%) |
| 35 to 64 Years | 69 (5.3%) | 44 (4.8%) |
| 65 to 74 Years | 0 (0.0%) | 28 (12.6%) |
| 75 Years and over | 1 (1.2%) | 16 (8.7%) |
Disability Class: Ambulatory Difficulty
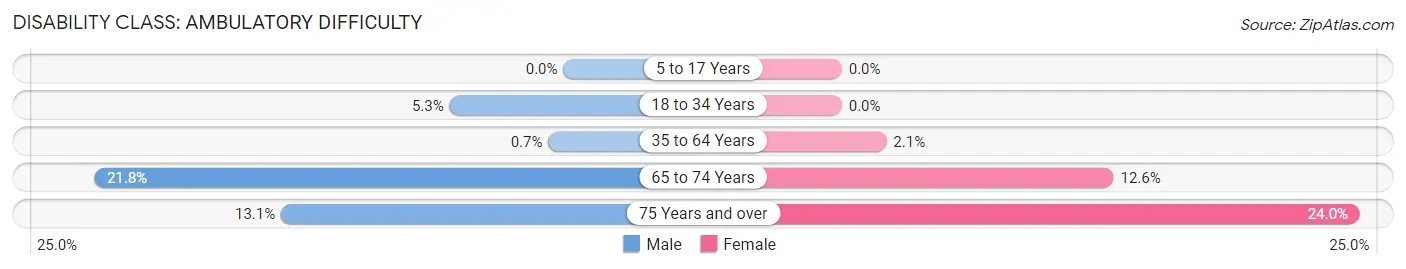
| Age Bracket | Male | Female |
| 5 to 17 Years | 0 (0.0%) | 0 (0.0%) |
| 18 to 34 Years | 35 (5.3%) | 0 (0.0%) |
| 35 to 64 Years | 9 (0.7%) | 19 (2.1%) |
| 65 to 74 Years | 66 (21.8%) | 28 (12.6%) |
| 75 Years and over | 11 (13.1%) | 44 (24.0%) |
Disability Class: Self-Care Difficulty
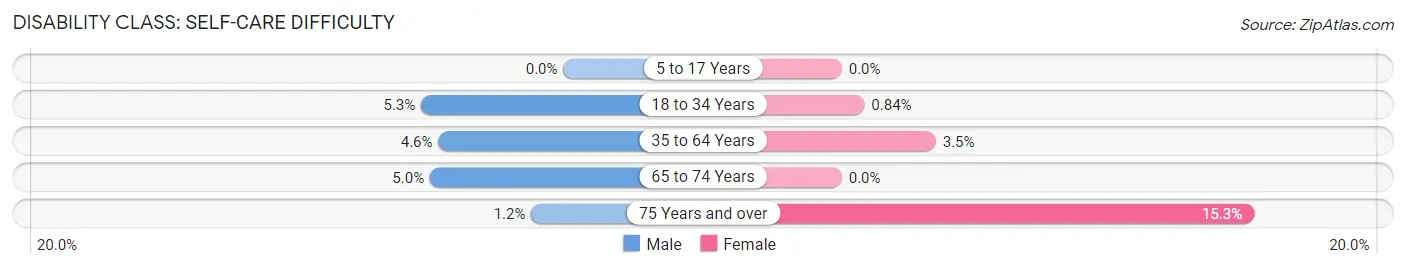
| Age Bracket | Male | Female |
| 5 to 17 Years | 0 (0.0%) | 0 (0.0%) |
| 18 to 34 Years | 35 (5.3%) | 5 (0.8%) |
| 35 to 64 Years | 60 (4.6%) | 32 (3.5%) |
| 65 to 74 Years | 15 (5.0%) | 0 (0.0%) |
| 75 Years and over | 1 (1.2%) | 28 (15.3%) |
Technology Access in Suncook
Computing Device Access in Suncook
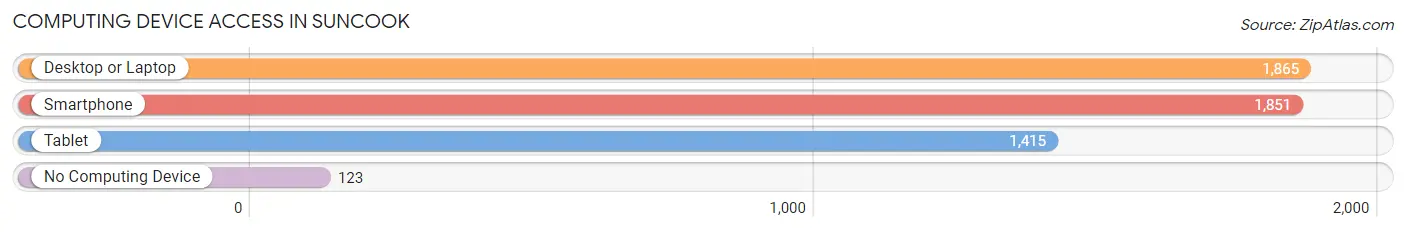
| Device Type | # Households | % Households |
| Desktop or Laptop | 1,865 | 83.0% |
| Smartphone | 1,851 | 82.4% |
| Tablet | 1,415 | 63.0% |
| No Computing Device | 123 | 5.5% |
| Total | 2,246 | 100.0% |
Internet Access in Suncook
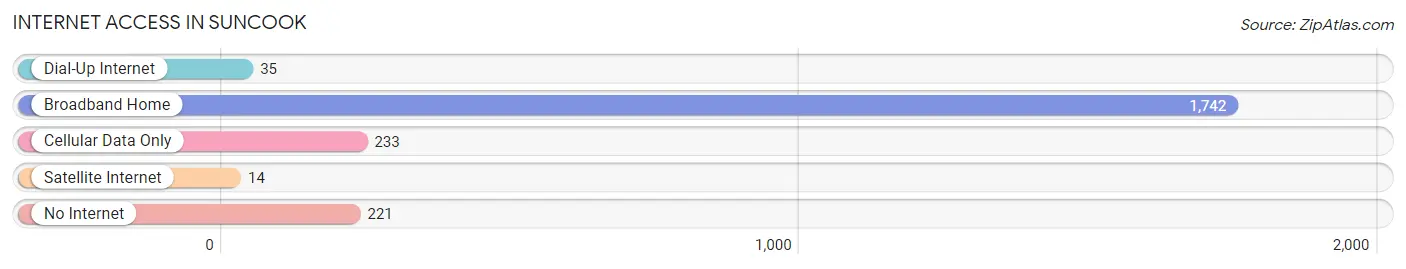
| Internet Type | # Households | % Households |
| Dial-Up Internet | 35 | 1.6% |
| Broadband Home | 1,742 | 77.6% |
| Cellular Data Only | 233 | 10.4% |
| Satellite Internet | 14 | 0.6% |
| No Internet | 221 | 9.8% |
| Total | 2,246 | 100.0% |
Suncook Summary
History
Suncook is a small town located in Merrimack County, New Hampshire. It was first settled in 1727 by a group of settlers from Massachusetts. The town was originally known as "Suncook Village" and was part of the larger town of Pembroke. In 1822, Suncook was incorporated as its own town.
The town was named after the Suncook River, which runs through the town. The river was named by the Abenaki Indians, who called it "Sokokis", meaning "stony river". The river was an important source of power for the early settlers, who used it to power mills and factories.
The town of Suncook has a long history of industry and manufacturing. In the 19th century, the town was home to several mills, including a paper mill, a grist mill, and a saw mill. The town also had a tannery, a shoe factory, and a woolen mill.
In the 20th century, Suncook became a popular summer resort destination. The town was home to several large hotels, including the Suncook Hotel, which was built in 1891. The hotel was a popular destination for wealthy families from Boston and New York.
Geography
Suncook is located in southeastern New Hampshire, in Merrimack County. The town is bordered by the towns of Pembroke to the north, Epsom to the east, Allenstown to the south, and Chichester to the west.
The town is situated on the Suncook River, which runs through the center of town. The river is a tributary of the Merrimack River, which flows to the Atlantic Ocean.
The town is mostly rural, with a few small villages scattered throughout. The largest village is Suncook Village, which is located in the center of town. Other villages include Suncook Mills, Suncook Corner, and Suncook Heights.
The town is located in the White Mountains region of New Hampshire. The highest point in town is Mount Suncook, which has an elevation of 1,845 feet.
Economy
The economy of Suncook is largely based on tourism and manufacturing. The town is home to several small businesses, including restaurants, retail stores, and a few small manufacturing companies.
The town is also home to several large employers, including the Suncook Valley Hospital, which is the largest employer in town. Other major employers include the Suncook Valley School District, the Suncook Valley Country Club, and the Suncook Valley Golf Course.
The town is also home to several small farms, which produce a variety of crops, including apples, potatoes, and hay.
Demographics
As of the 2010 census, the town of Suncook had a population of 5,379. The population has remained relatively stable over the past few decades.
The town has a diverse population, with a mix of races and ethnicities. The largest racial group is White (93.3%), followed by Hispanic or Latino (2.7%), Asian (1.3%), and African American (1.2%).
The median household income in Suncook is $60,945, which is higher than the state average of $60,945. The median home value is $219,400, which is also higher than the state average of $219,400.
The town has a high rate of homeownership, with 81.3% of residents owning their own homes. The town also has a low crime rate, with only 0.7 violent crimes per 1,000 residents.
Common Questions
What is Per Capita Income in Suncook?
Per Capita income in Suncook is $38,855.
What is the Median Family Income in Suncook?
Median Family Income in Suncook is $120,385.
What is the Median Household income in Suncook?
Median Household Income in Suncook is $72,375.
What is Income or Wage Gap in Suncook?
Income or Wage Gap in Suncook is 1.6%.
Women in Suncook earn 98.4 cents for every dollar earned by a man.
What is Inequality or Gini Index in Suncook?
Inequality or Gini Index in Suncook is 0.42.
What is the Total Population of Suncook?
Total Population of Suncook is 5,235.
What is the Total Male Population of Suncook?
Total Male Population of Suncook is 2,882.
What is the Total Female Population of Suncook?
Total Female Population of Suncook is 2,353.
What is the Ratio of Males per 100 Females in Suncook?
There are 122.48 Males per 100 Females in Suncook.
What is the Ratio of Females per 100 Males in Suncook?
There are 81.64 Females per 100 Males in Suncook.
What is the Median Population Age in Suncook?
Median Population Age in Suncook is 42.3 Years.
What is the Average Family Size in Suncook
Average Family Size in Suncook is 2.9 People.
What is the Average Household Size in Suncook
Average Household Size in Suncook is 2.3 People.
How Large is the Labor Force in Suncook?
There are 3,091 People in the Labor Forcein in Suncook.
What is the Percentage of People in the Labor Force in Suncook?
70.9% of People are in the Labor Force in Suncook.
What is the Unemployment Rate in Suncook?
Unemployment Rate in Suncook is 1.0%.