Littleton, NH Map & Demographics
Littleton Map
Littleton Overview
$44,749
PER CAPITA INCOME
$49,395
AVG FAMILY INCOME
$40,873
AVG HOUSEHOLD INCOME
21.1%
WAGE / INCOME GAP [ % ]
78.9¢/ $1
WAGE / INCOME GAP [ $ ]
$8,736
FAMILY INCOME DEFICIT
0.66
INEQUALITY / GINI INDEX
4,587
TOTAL POPULATION
2,096
MALE POPULATION
2,491
FEMALE POPULATION
84.14
MALES / 100 FEMALES
118.85
FEMALES / 100 MALES
34.2
MEDIAN AGE
2.8
AVG FAMILY SIZE
2.1
AVG HOUSEHOLD SIZE
2,352
LABOR FORCE [ PEOPLE ]
59.7%
PERCENT IN LABOR FORCE
5.1%
UNEMPLOYMENT RATE
Littleton Zip Codes
Littleton Area Codes
Income in Littleton
Income Overview in Littleton
Per Capita Income in Littleton is $44,749, while median incomes of families and households are $49,395 and $40,873 respectively.
| Characteristic | Number | Measure |
| Per Capita Income | 4,587 | $44,749 |
| Median Family Income | 1,019 | $49,395 |
| Mean Family Income | 1,019 | $145,807 |
| Median Household Income | 2,109 | $40,873 |
| Mean Household Income | 2,109 | $91,226 |
| Income Deficit | 1,019 | $8,736 |
| Wage / Income Gap (%) | 4,587 | 21.07% |
| Wage / Income Gap ($) | 4,587 | 78.93¢ per $1 |
| Gini / Inequality Index | 4,587 | 0.66 |
Earnings by Sex in Littleton
Average Earnings in Littleton are $40,141, $46,959 for men and $37,066 for women, a difference of 21.1%.
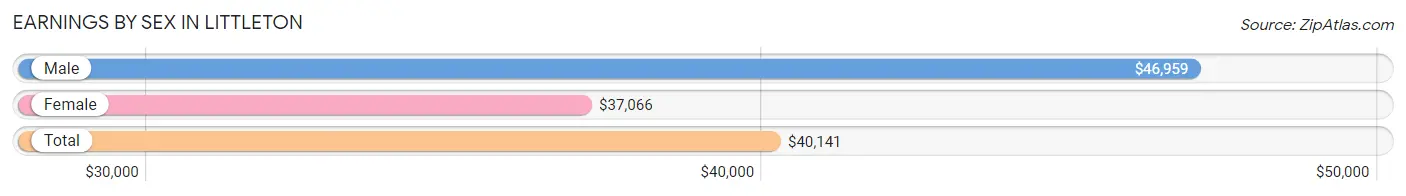
| Sex | Number | Average Earnings |
| Male | 1,212 (52.1%) | $46,959 |
| Female | 1,115 (47.9%) | $37,066 |
| Total | 2,327 (100.0%) | $40,141 |
Earnings by Sex by Income Bracket in Littleton
The most common earnings brackets in Littleton are $50,000 to $54,999 for men (241 | 19.9%) and $40,000 to $44,999 for women (149 | 13.4%).
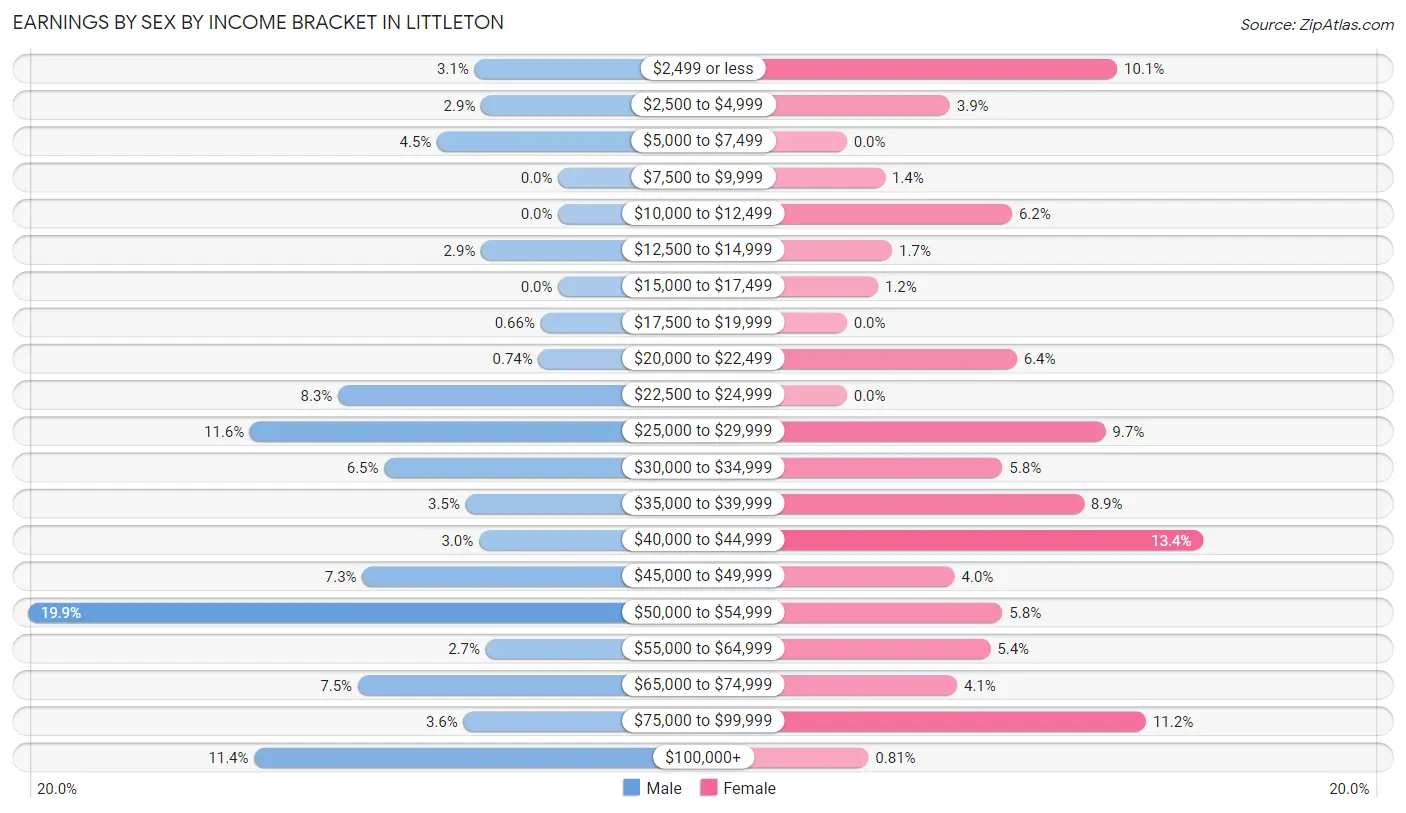
| Income | Male | Female |
| $2,499 or less | 38 (3.1%) | 113 (10.1%) |
| $2,500 to $4,999 | 35 (2.9%) | 43 (3.9%) |
| $5,000 to $7,499 | 55 (4.5%) | 0 (0.0%) |
| $7,500 to $9,999 | 0 (0.0%) | 16 (1.4%) |
| $10,000 to $12,499 | 0 (0.0%) | 69 (6.2%) |
| $12,500 to $14,999 | 35 (2.9%) | 19 (1.7%) |
| $15,000 to $17,499 | 0 (0.0%) | 13 (1.2%) |
| $17,500 to $19,999 | 8 (0.7%) | 0 (0.0%) |
| $20,000 to $22,499 | 9 (0.7%) | 71 (6.4%) |
| $22,500 to $24,999 | 100 (8.3%) | 0 (0.0%) |
| $25,000 to $29,999 | 140 (11.6%) | 108 (9.7%) |
| $30,000 to $34,999 | 79 (6.5%) | 65 (5.8%) |
| $35,000 to $39,999 | 42 (3.5%) | 99 (8.9%) |
| $40,000 to $44,999 | 36 (3.0%) | 149 (13.4%) |
| $45,000 to $49,999 | 89 (7.3%) | 45 (4.0%) |
| $50,000 to $54,999 | 241 (19.9%) | 65 (5.8%) |
| $55,000 to $64,999 | 33 (2.7%) | 60 (5.4%) |
| $65,000 to $74,999 | 91 (7.5%) | 46 (4.1%) |
| $75,000 to $99,999 | 43 (3.5%) | 125 (11.2%) |
| $100,000+ | 138 (11.4%) | 9 (0.8%) |
| Total | 1,212 (100.0%) | 1,115 (100.0%) |
Earnings by Sex by Educational Attainment in Littleton
Average earnings in Littleton are $45,878 for men and $40,463 for women, a difference of 11.8%. Men with an educational attainment of graduate degree enjoy the highest average annual earnings of $165,243, while those with high school diploma education earn the least with $28,062. Women with an educational attainment of graduate degree earn the most with the average annual earnings of $66,875, while those with bachelor's degree education have the smallest earnings of $35,326.
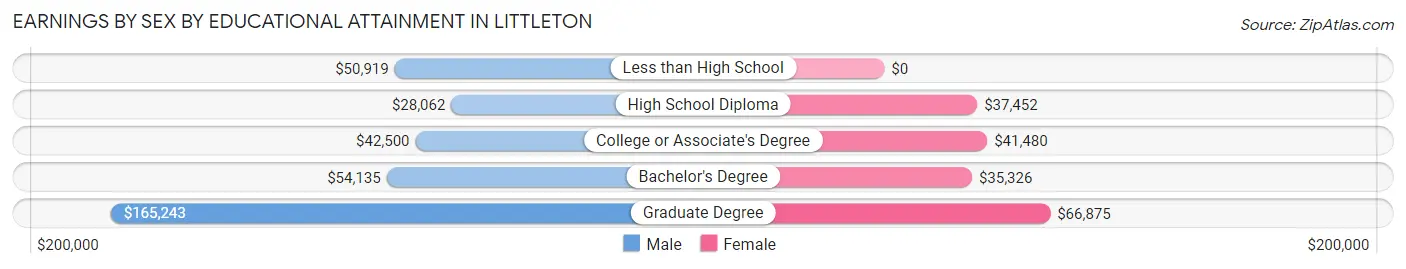
| Educational Attainment | Male Income | Female Income |
| Less than High School | $50,919 | $0 |
| High School Diploma | $28,062 | $37,452 |
| College or Associate's Degree | $42,500 | $41,480 |
| Bachelor's Degree | $54,135 | $35,326 |
| Graduate Degree | $165,243 | $66,875 |
| Total | $45,878 | $40,463 |
Family Income in Littleton
Family Income Brackets in Littleton
According to the Littleton family income data, there are 189 families falling into the $25,000 to $34,999 income range, which is the most common income bracket and makes up 18.5% of all families. Conversely, the less than $10,000 income bracket is the least frequent group with only 30 families (2.9%) belonging to this category.
| Income Bracket | # Families | % Families |
| Less than $10,000 | 30 | 2.9% |
| $10,000 to $14,999 | 83 | 8.1% |
| $15,000 to $24,999 | 56 | 5.5% |
| $25,000 to $34,999 | 189 | 18.5% |
| $35,000 to $49,999 | 159 | 15.6% |
| $50,000 to $74,999 | 155 | 15.2% |
| $75,000 to $99,999 | 82 | 8.0% |
| $100,000 to $149,999 | 141 | 13.8% |
| $150,000 to $199,999 | 38 | 3.7% |
| $200,000+ | 86 | 8.4% |
Family Income by Famaliy Size in Littleton
4-person families (119 | 11.7%) account for the highest median family income in Littleton with $85,350 per family, while 2-person families (635 | 62.3%) have the highest median income of $23,383 per family member.
| Income Bracket | # Families | Median Income |
| 2-Person Families | 635 (62.3%) | $46,766 |
| 3-Person Families | 238 (23.4%) | $0 |
| 4-Person Families | 119 (11.7%) | $85,350 |
| 5-Person Families | 13 (1.3%) | $0 |
| 6-Person Families | 14 (1.4%) | $0 |
| 7+ Person Families | 0 (0.0%) | $0 |
| Total | 1,019 (100.0%) | $49,395 |
Family Income by Number of Earners in Littleton
The median family income in Littleton is $49,395, with families comprising 3+ earners (110) having the highest median family income of $142,083, while families with no earners (238) have the lowest median family income of $25,673, accounting for 10.8% and 23.4% of families, respectively.
| Number of Earners | # Families | Median Income |
| No Earners | 238 (23.4%) | $25,673 |
| 1 Earner | 434 (42.6%) | $40,833 |
| 2 Earners | 237 (23.3%) | $112,305 |
| 3+ Earners | 110 (10.8%) | $142,083 |
| Total | 1,019 (100.0%) | $49,395 |
Household Income in Littleton
Household Income Brackets in Littleton
With 437 households falling in the category, the $50,000 to $74,999 income range is the most frequent in Littleton, accounting for 20.7% of all households. In contrast, only 46 households (2.2%) fall into the $150,000 to $199,999 income bracket, making it the least populous group.
| Income Bracket | # Households | % Households |
| Less than $10,000 | 219 | 10.4% |
| $10,000 to $14,999 | 110 | 5.2% |
| $15,000 to $24,999 | 291 | 13.8% |
| $25,000 to $34,999 | 378 | 17.9% |
| $35,000 to $49,999 | 232 | 11.0% |
| $50,000 to $74,999 | 437 | 20.7% |
| $75,000 to $99,999 | 133 | 6.3% |
| $100,000 to $149,999 | 169 | 8.0% |
| $150,000 to $199,999 | 46 | 2.2% |
| $200,000+ | 95 | 4.5% |
Household Income by Householder Age in Littleton
The median household income in Littleton is $40,873, with the highest median household income of $68,726 found in the 15 to 24 years age bracket for the primary householder. A total of 159 households (7.5%) fall into this category. Meanwhile, the 65+ years age bracket for the primary householder has the lowest median household income of $24,092, with 633 households (30.0%) in this group.
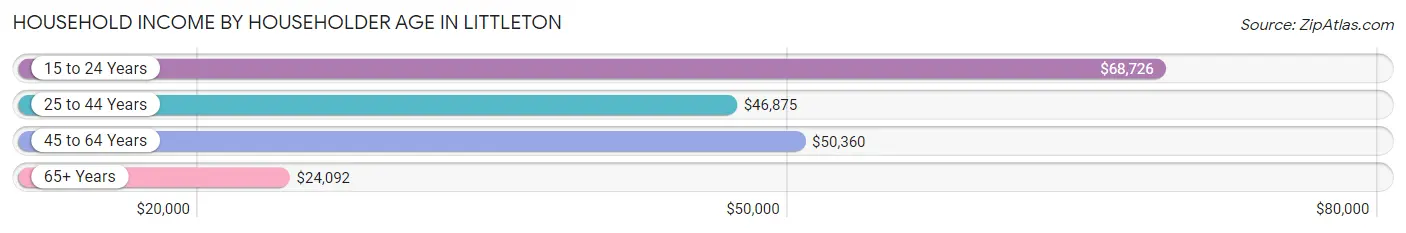
| Income Bracket | # Households | Median Income |
| 15 to 24 Years | 159 (7.5%) | $68,726 |
| 25 to 44 Years | 638 (30.2%) | $46,875 |
| 45 to 64 Years | 679 (32.2%) | $50,360 |
| 65+ Years | 633 (30.0%) | $24,092 |
| Total | 2,109 (100.0%) | $40,873 |
Poverty in Littleton
Income Below Poverty by Sex and Age in Littleton
With 15.6% poverty level for males and 27.8% for females among the residents of Littleton, 15 year old males and 25 to 34 year old females are the most vulnerable to poverty, with 32 males (68.1%) and 234 females (56.5%) in their respective age groups living below the poverty level.
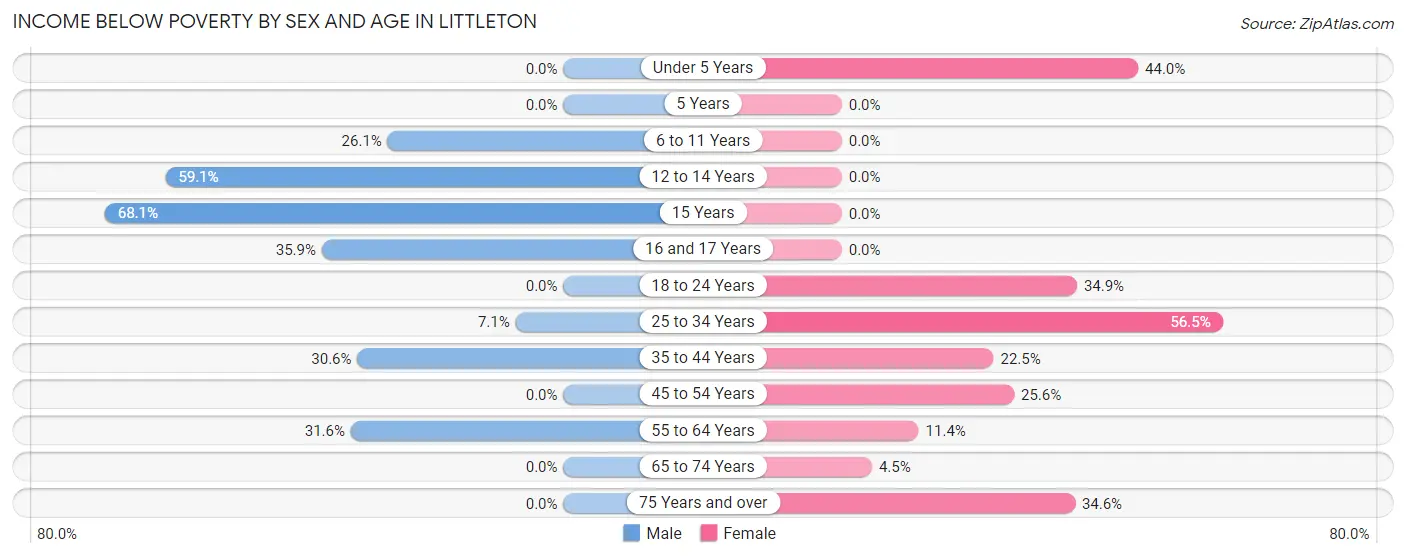
| Age Bracket | Male | Female |
| Under 5 Years | 0 (0.0%) | 99 (44.0%) |
| 5 Years | 0 (0.0%) | 0 (0.0%) |
| 6 to 11 Years | 24 (26.1%) | 0 (0.0%) |
| 12 to 14 Years | 52 (59.1%) | 0 (0.0%) |
| 15 Years | 32 (68.1%) | 0 (0.0%) |
| 16 and 17 Years | 33 (35.9%) | 0 (0.0%) |
| 18 to 24 Years | 0 (0.0%) | 103 (34.9%) |
| 25 to 34 Years | 47 (7.1%) | 234 (56.5%) |
| 35 to 44 Years | 26 (30.6%) | 39 (22.5%) |
| 45 to 54 Years | 0 (0.0%) | 44 (25.6%) |
| 55 to 64 Years | 113 (31.6%) | 46 (11.4%) |
| 65 to 74 Years | 0 (0.0%) | 10 (4.5%) |
| 75 Years and over | 0 (0.0%) | 117 (34.6%) |
| Total | 327 (15.6%) | 692 (27.8%) |
Income Above Poverty by Sex and Age in Littleton
According to the poverty statistics in Littleton, males aged 18 to 24 years and females aged 6 to 11 years are the age groups that are most secure financially, with 100.0% of males and 100.0% of females in these age groups living above the poverty line.
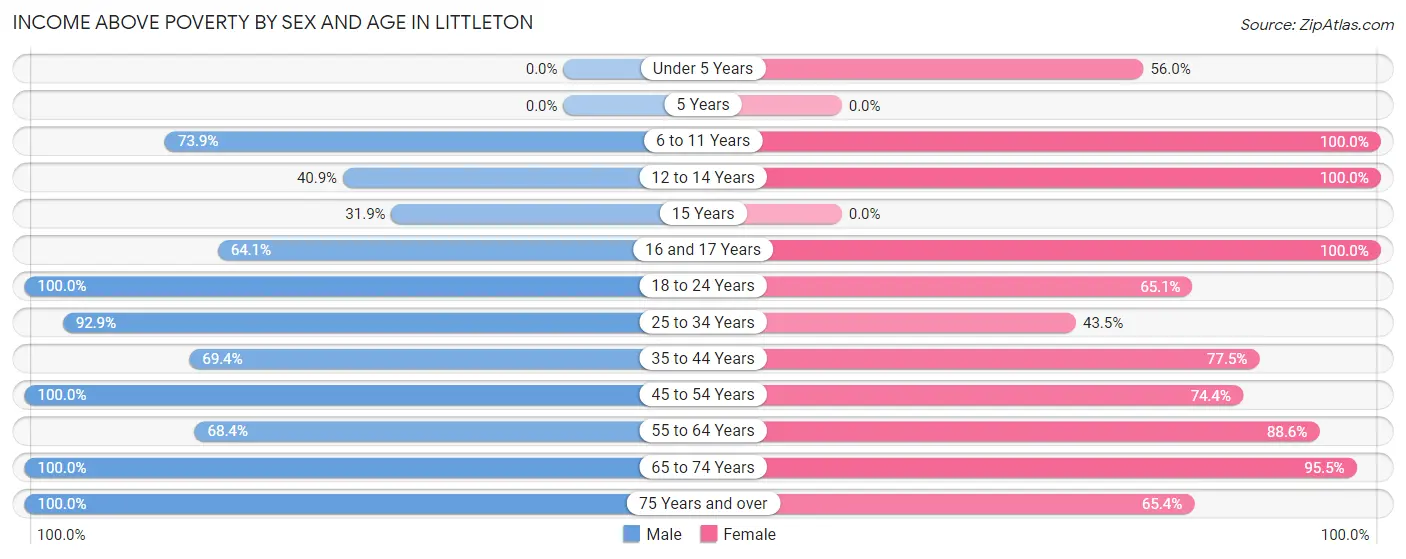
| Age Bracket | Male | Female |
| Under 5 Years | 0 (0.0%) | 126 (56.0%) |
| 5 Years | 0 (0.0%) | 0 (0.0%) |
| 6 to 11 Years | 68 (73.9%) | 115 (100.0%) |
| 12 to 14 Years | 36 (40.9%) | 80 (100.0%) |
| 15 Years | 15 (31.9%) | 0 (0.0%) |
| 16 and 17 Years | 59 (64.1%) | 53 (100.0%) |
| 18 to 24 Years | 169 (100.0%) | 192 (65.1%) |
| 25 to 34 Years | 615 (92.9%) | 180 (43.5%) |
| 35 to 44 Years | 59 (69.4%) | 134 (77.5%) |
| 45 to 54 Years | 230 (100.0%) | 128 (74.4%) |
| 55 to 64 Years | 245 (68.4%) | 357 (88.6%) |
| 65 to 74 Years | 164 (100.0%) | 213 (95.5%) |
| 75 Years and over | 109 (100.0%) | 221 (65.4%) |
| Total | 1,769 (84.4%) | 1,799 (72.2%) |
Income Below Poverty Among Married-Couple Families in Littleton
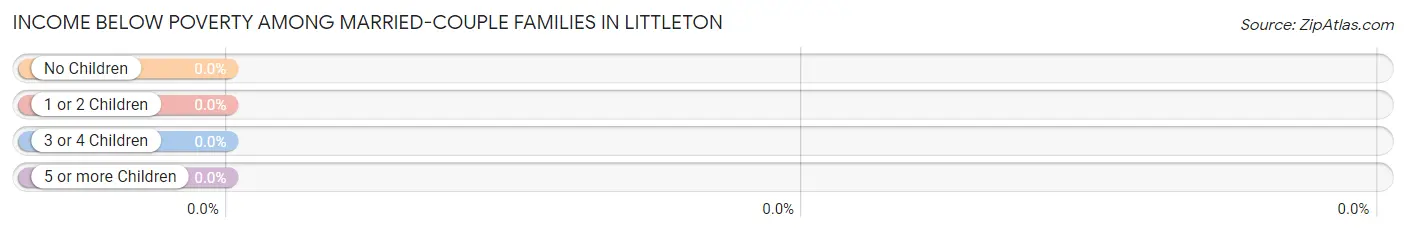
| Children | Above Poverty | Below Poverty |
| No Children | 390 (100.0%) | 0 (0.0%) |
| 1 or 2 Children | 113 (100.0%) | 0 (0.0%) |
| 3 or 4 Children | 14 (100.0%) | 0 (0.0%) |
| 5 or more Children | 0 (0.0%) | 0 (0.0%) |
| Total | 517 (100.0%) | 0 (0.0%) |
Income Below Poverty Among Single-Parent Households in Littleton
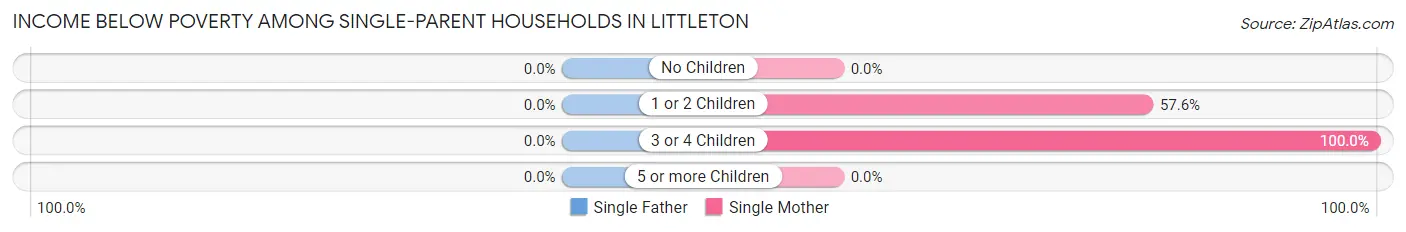
| Children | Single Father | Single Mother |
| No Children | 0 (0.0%) | 0 (0.0%) |
| 1 or 2 Children | 0 (0.0%) | 140 (57.6%) |
| 3 or 4 Children | 0 (0.0%) | 25 (100.0%) |
| 5 or more Children | 0 (0.0%) | 0 (0.0%) |
| Total | 0 (0.0%) | 165 (41.8%) |
Income Below Poverty Among Married-Couple vs Single-Parent Households in Littleton
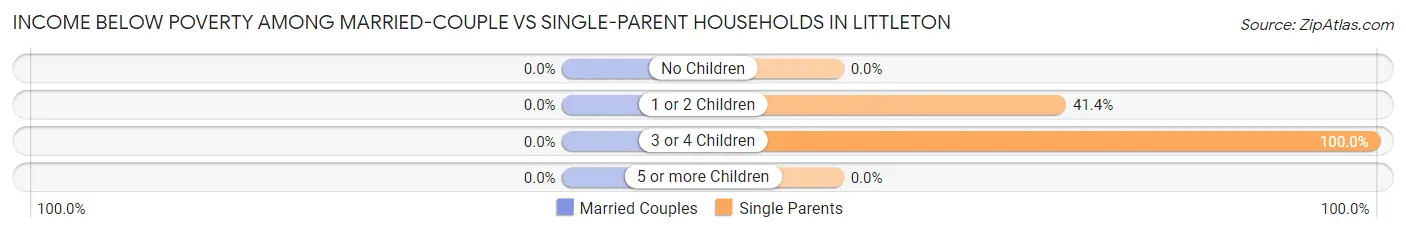
| Children | Married-Couple Families | Single-Parent Households |
| No Children | 0 (0.0%) | 0 (0.0%) |
| 1 or 2 Children | 0 (0.0%) | 140 (41.4%) |
| 3 or 4 Children | 0 (0.0%) | 25 (100.0%) |
| 5 or more Children | 0 (0.0%) | 0 (0.0%) |
| Total | 0 (0.0%) | 165 (32.9%) |
Race in Littleton
The most populous races in Littleton are White / Caucasian (4,189 | 91.3%), Two or more Races (296 | 6.5%), and Hispanic or Latino (102 | 2.2%).
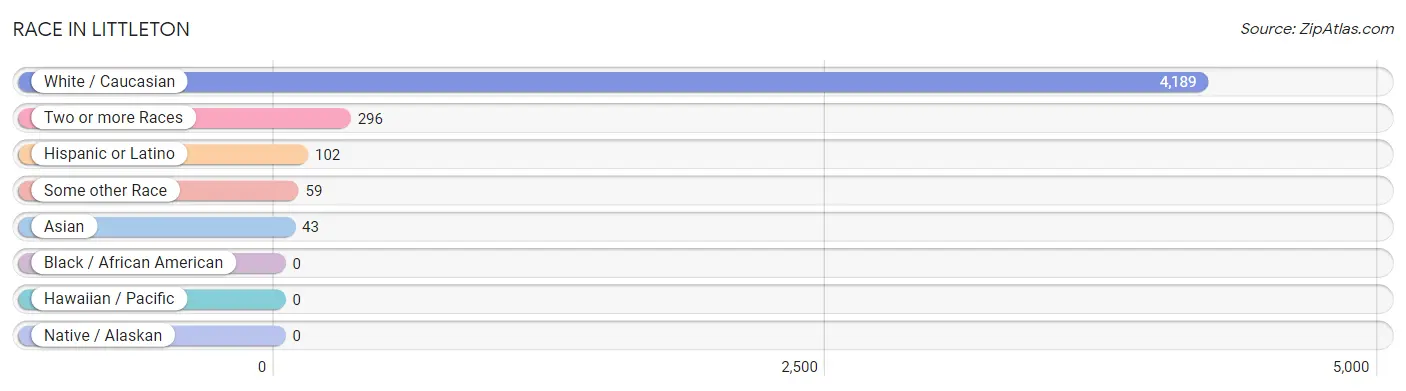
| Race | # Population | % Population |
| Asian | 43 | 0.9% |
| Black / African American | 0 | 0.0% |
| Hawaiian / Pacific | 0 | 0.0% |
| Hispanic or Latino | 102 | 2.2% |
| Native / Alaskan | 0 | 0.0% |
| White / Caucasian | 4,189 | 91.3% |
| Two or more Races | 296 | 6.5% |
| Some other Race | 59 | 1.3% |
| Total | 4,587 | 100.0% |
Ancestry in Littleton
The most populous ancestries reported in Littleton are English (898 | 19.6%), Irish (703 | 15.3%), French (579 | 12.6%), American (410 | 8.9%), and Italian (244 | 5.3%), together accounting for 61.8% of all Littleton residents.
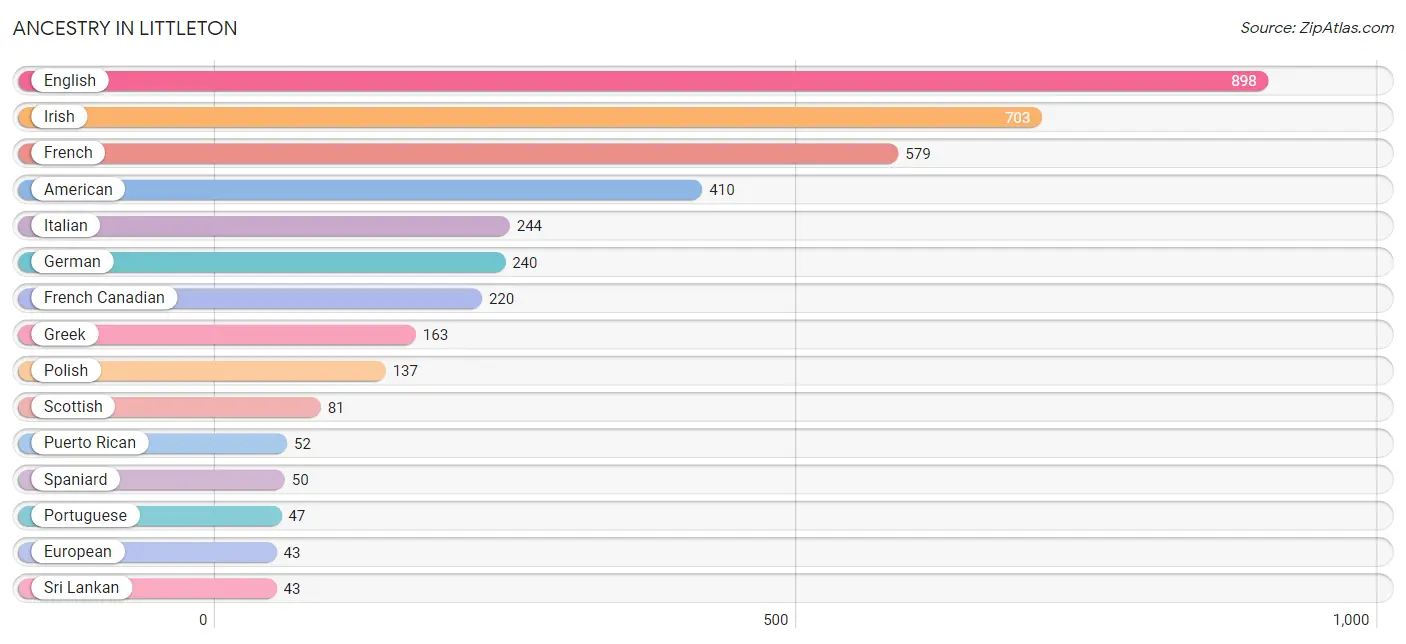
| Ancestry | # Population | % Population |
| American | 410 | 8.9% |
| Arab | 9 | 0.2% |
| Austrian | 15 | 0.3% |
| Blackfeet | 17 | 0.4% |
| Canadian | 6 | 0.1% |
| Cree | 17 | 0.4% |
| English | 898 | 19.6% |
| European | 43 | 0.9% |
| French | 579 | 12.6% |
| French Canadian | 220 | 4.8% |
| German | 240 | 5.2% |
| Greek | 163 | 3.5% |
| Irish | 703 | 15.3% |
| Italian | 244 | 5.3% |
| Lebanese | 9 | 0.2% |
| Polish | 137 | 3.0% |
| Portuguese | 47 | 1.0% |
| Puerto Rican | 52 | 1.1% |
| Russian | 16 | 0.4% |
| Scotch-Irish | 27 | 0.6% |
| Scottish | 81 | 1.8% |
| Slavic | 9 | 0.2% |
| Spaniard | 50 | 1.1% |
| Sri Lankan | 43 | 0.9% |
| Swedish | 14 | 0.3% | View All 25 Rows |
Immigrants in Littleton
The most numerous immigrant groups reported in Littleton came from Europe (27 | 0.6%), France (27 | 0.6%), Western Europe (27 | 0.6%), and Canada (7 | 0.2%), together accounting for 1.9% of all Littleton residents.
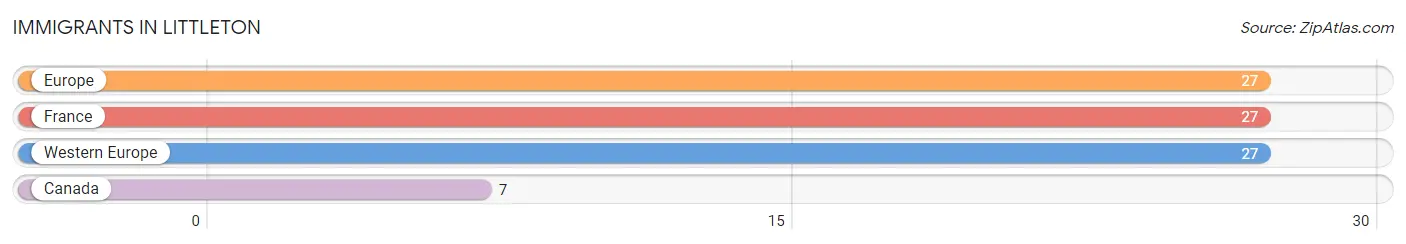
| Immigration Origin | # Population | % Population |
| Canada | 7 | 0.2% |
| Europe | 27 | 0.6% |
| France | 27 | 0.6% |
| Western Europe | 27 | 0.6% | View All 4 Rows |
Sex and Age in Littleton
Sex and Age in Littleton
The most populous age groups in Littleton are 30 to 34 Years (456 | 21.8%) for men and 30 to 34 Years (339 | 13.6%) for women.
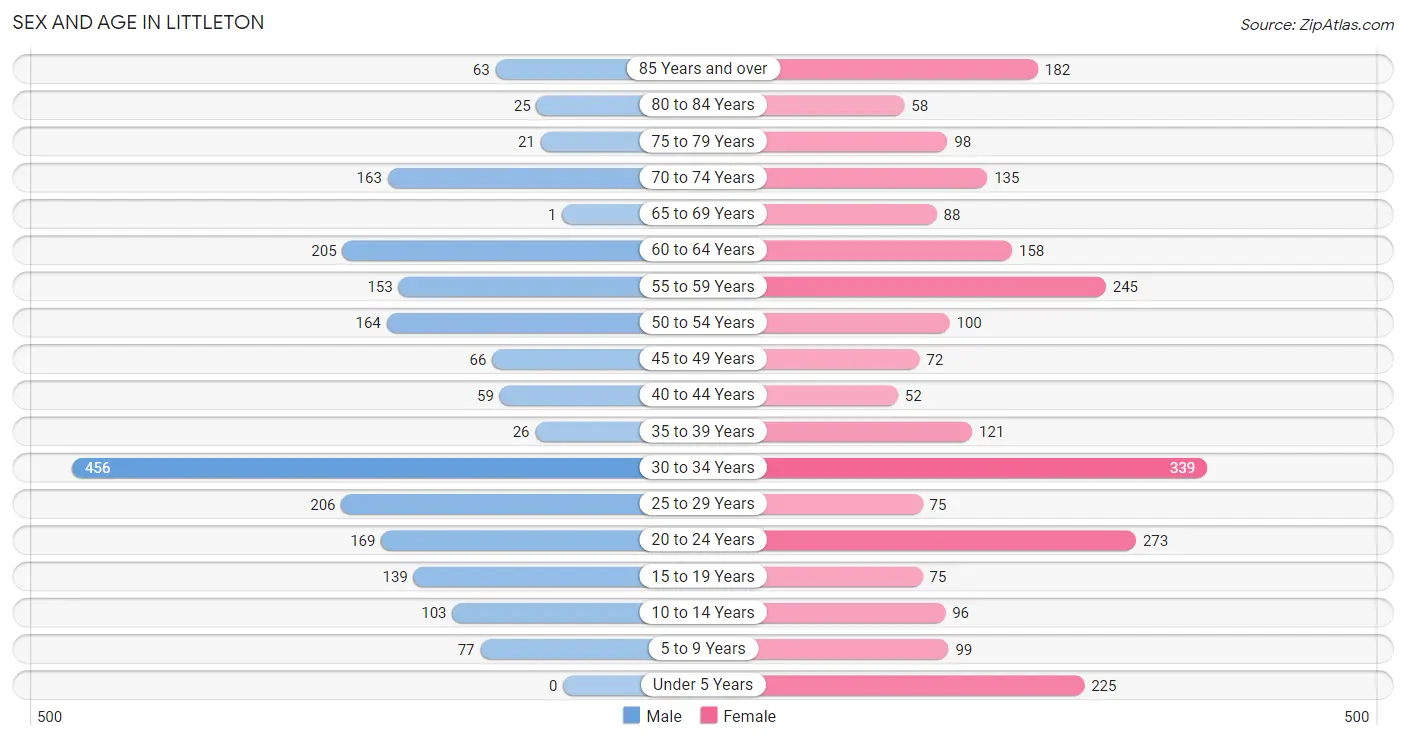
| Age Bracket | Male | Female |
| Under 5 Years | 0 (0.0%) | 225 (9.0%) |
| 5 to 9 Years | 77 (3.7%) | 99 (4.0%) |
| 10 to 14 Years | 103 (4.9%) | 96 (3.8%) |
| 15 to 19 Years | 139 (6.6%) | 75 (3.0%) |
| 20 to 24 Years | 169 (8.1%) | 273 (11.0%) |
| 25 to 29 Years | 206 (9.8%) | 75 (3.0%) |
| 30 to 34 Years | 456 (21.8%) | 339 (13.6%) |
| 35 to 39 Years | 26 (1.2%) | 121 (4.9%) |
| 40 to 44 Years | 59 (2.8%) | 52 (2.1%) |
| 45 to 49 Years | 66 (3.2%) | 72 (2.9%) |
| 50 to 54 Years | 164 (7.8%) | 100 (4.0%) |
| 55 to 59 Years | 153 (7.3%) | 245 (9.8%) |
| 60 to 64 Years | 205 (9.8%) | 158 (6.3%) |
| 65 to 69 Years | 1 (0.1%) | 88 (3.5%) |
| 70 to 74 Years | 163 (7.8%) | 135 (5.4%) |
| 75 to 79 Years | 21 (1.0%) | 98 (3.9%) |
| 80 to 84 Years | 25 (1.2%) | 58 (2.3%) |
| 85 Years and over | 63 (3.0%) | 182 (7.3%) |
| Total | 2,096 (100.0%) | 2,491 (100.0%) |
Families and Households in Littleton
Median Family Size in Littleton
The median family size in Littleton is 2.81 persons per family, with single female/mother families (395 | 38.8%) accounting for the largest median family size of 2.93 persons per family. On the other hand, single male/father families (107 | 10.5%) represent the smallest median family size with 2.58 persons per family.
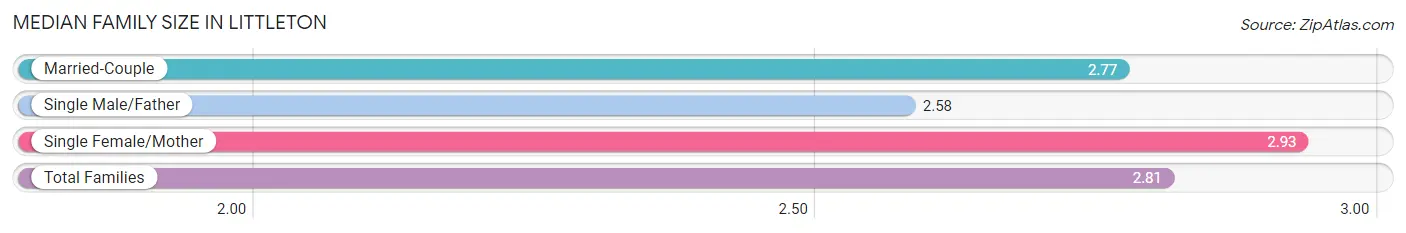
| Family Type | # Families | Family Size |
| Married-Couple | 517 (50.7%) | 2.77 |
| Single Male/Father | 107 (10.5%) | 2.58 |
| Single Female/Mother | 395 (38.8%) | 2.93 |
| Total Families | 1,019 (100.0%) | 2.81 |
Median Household Size in Littleton
The median household size in Littleton is 2.15 persons per household, with single male/father households (107 | 5.1%) accounting for the largest median household size of 3.46 persons per household. non-family households (1,090 | 51.7%) represent the smallest median household size with 1.29 persons per household.
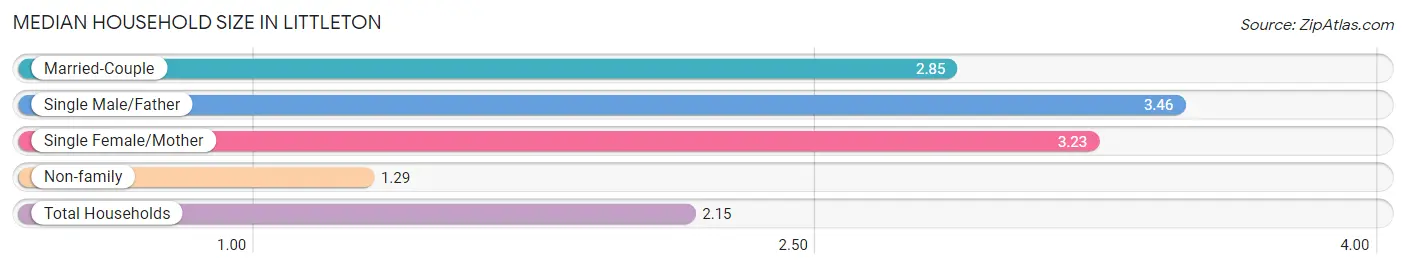
| Household Type | # Households | Household Size |
| Married-Couple | 517 (24.5%) | 2.85 |
| Single Male/Father | 107 (5.1%) | 3.46 |
| Single Female/Mother | 395 (18.7%) | 3.23 |
| Non-family | 1,090 (51.7%) | 1.29 |
| Total Households | 2,109 (100.0%) | 2.15 |
Household Size by Marriage Status in Littleton
Out of a total of 2,109 households in Littleton, 1,019 (48.3%) are family households, while 1,090 (51.7%) are nonfamily households. The most numerous type of family households are 2-person households, comprising 584, and the most common type of nonfamily households are 1-person households, comprising 873.
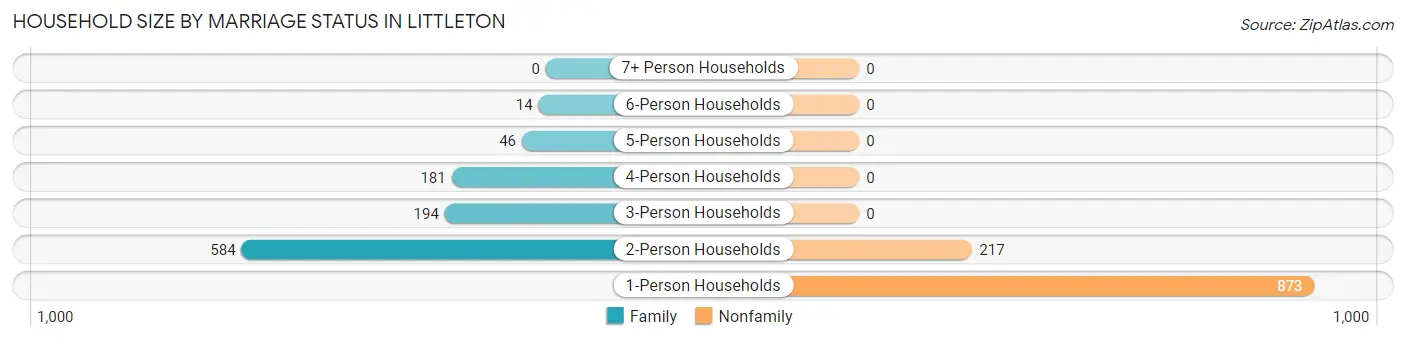
| Household Size | Family Households | Nonfamily Households |
| 1-Person Households | - | 873 (41.4%) |
| 2-Person Households | 584 (27.7%) | 217 (10.3%) |
| 3-Person Households | 194 (9.2%) | 0 (0.0%) |
| 4-Person Households | 181 (8.6%) | 0 (0.0%) |
| 5-Person Households | 46 (2.2%) | 0 (0.0%) |
| 6-Person Households | 14 (0.7%) | 0 (0.0%) |
| 7+ Person Households | 0 (0.0%) | 0 (0.0%) |
| Total | 1,019 (48.3%) | 1,090 (51.7%) |
Female Fertility in Littleton
Fertility by Age in Littleton
| Age Bracket | Women with Births | Births / 1,000 Women |
| 15 to 19 years | 0 (0.0%) | 0.0 |
| 20 to 34 years | 0 (0.0%) | 0.0 |
| 35 to 50 years | 0 (0.0%) | 0.0 |
| Total | 0 (0.0%) | 0.0 |
Fertility by Age by Marriage Status in Littleton
| Age Bracket | Married | Unmarried |
| 15 to 19 years | 0 (0.0%) | 0 (0.0%) |
| 20 to 34 years | 0 (0.0%) | 0 (0.0%) |
| 35 to 50 years | 0 (0.0%) | 0 (0.0%) |
| Total | 0 (0.0%) | 0 (0.0%) |
Fertility by Education in Littleton
| Educational Attainment | Women with Births | Births / 1,000 Women |
| Less than High School | 0 (0.0%) | 0.0 |
| High School Diploma | 0 (0.0%) | 0.0 |
| College or Associate's Degree | 0 (0.0%) | 0.0 |
| Bachelor's Degree | 0 (0.0%) | 0.0 |
| Graduate Degree | 0 (0.0%) | 0.0 |
| Total | 0 (0.0%) | 0.0 |
Fertility by Education by Marriage Status in Littleton
| Educational Attainment | Married | Unmarried |
| Less than High School | 0 (0.0%) | 0 (0.0%) |
| High School Diploma | 0 (0.0%) | 0 (0.0%) |
| College or Associate's Degree | 0 (0.0%) | 0 (0.0%) |
| Bachelor's Degree | 0 (0.0%) | 0 (0.0%) |
| Graduate Degree | 0 (0.0%) | 0 (0.0%) |
| Total | 0 (0.0%) | 0 (0.0%) |
Employment Characteristics in Littleton
Employment by Class of Employer in Littleton
Among the 2,234 employed individuals in Littleton, private company employees (1,635 | 73.2%), not-for-profit organizations (259 | 11.6%), and local government employees (109 | 4.9%) make up the most common classes of employment.
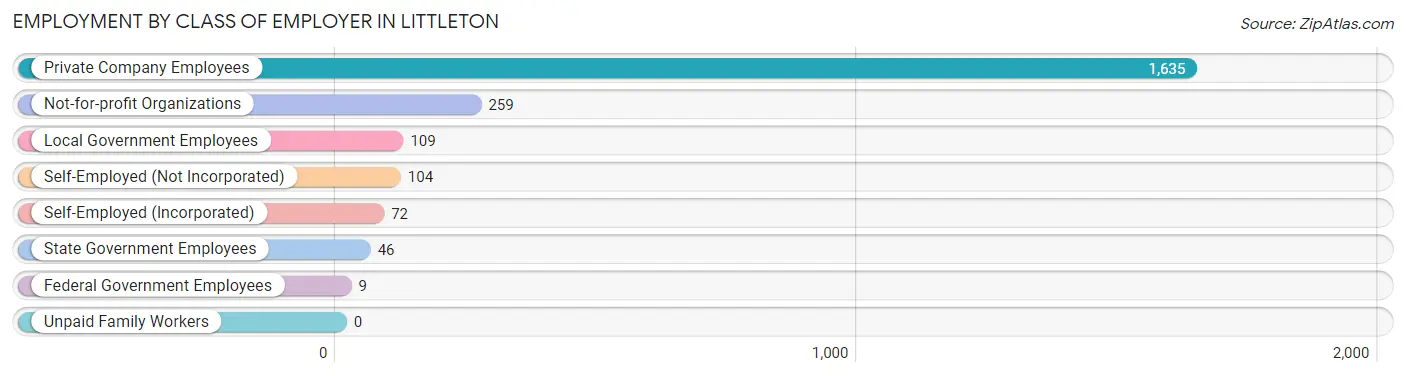
| Employer Class | # Employees | % Employees |
| Private Company Employees | 1,635 | 73.2% |
| Self-Employed (Incorporated) | 72 | 3.2% |
| Self-Employed (Not Incorporated) | 104 | 4.7% |
| Not-for-profit Organizations | 259 | 11.6% |
| Local Government Employees | 109 | 4.9% |
| State Government Employees | 46 | 2.1% |
| Federal Government Employees | 9 | 0.4% |
| Unpaid Family Workers | 0 | 0.0% |
| Total | 2,234 | 100.0% |
Employment Status by Age in Littleton
According to the labor force statistics for Littleton, out of the total population over 16 years of age (3,940), 59.7% or 2,352 individuals are in the labor force, with 5.1% or 120 of them unemployed. The age group with the highest labor force participation rate is 25 to 29 years, with 95.4% or 268 individuals in the labor force. Within the labor force, the 20 to 24 years age range has the highest percentage of unemployed individuals, with 30.7% or 103 of them being unemployed.
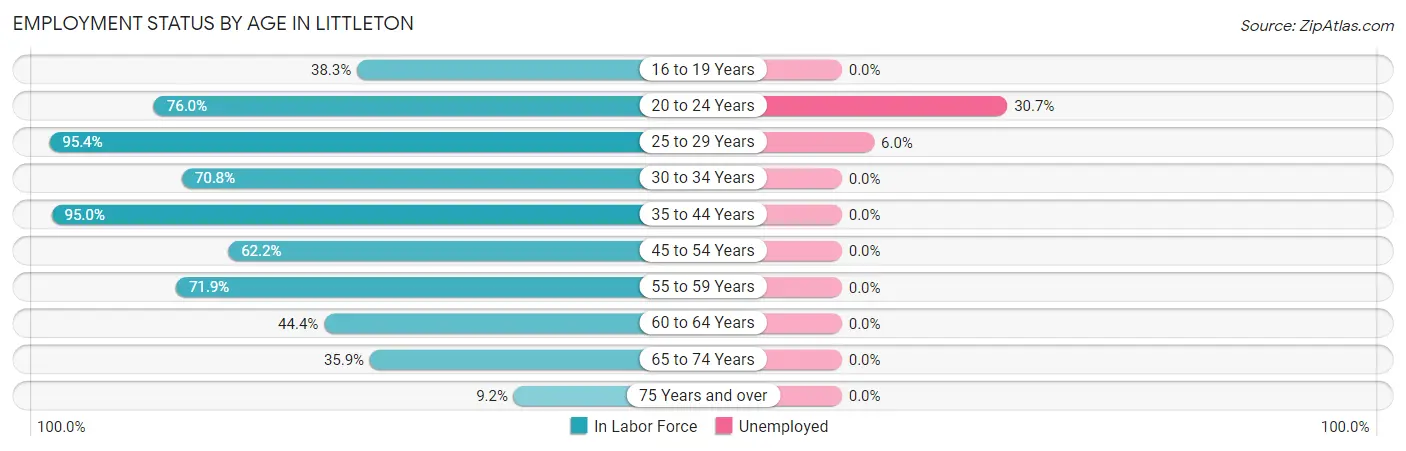
| Age Bracket | In Labor Force | Unemployed |
| 16 to 19 Years | 64 (38.3%) | 0 (0.0%) |
| 20 to 24 Years | 336 (76.0%) | 103 (30.7%) |
| 25 to 29 Years | 268 (95.4%) | 16 (6.0%) |
| 30 to 34 Years | 563 (70.8%) | 0 (0.0%) |
| 35 to 44 Years | 245 (95.0%) | 0 (0.0%) |
| 45 to 54 Years | 250 (62.2%) | 0 (0.0%) |
| 55 to 59 Years | 286 (71.9%) | 0 (0.0%) |
| 60 to 64 Years | 161 (44.4%) | 0 (0.0%) |
| 65 to 74 Years | 139 (35.9%) | 0 (0.0%) |
| 75 Years and over | 41 (9.2%) | 0 (0.0%) |
| Total | 2,352 (59.7%) | 120 (5.1%) |
Employment Status by Educational Attainment in Littleton
According to labor force statistics for Littleton, 71.0% of individuals (1,773) out of the total population between 25 and 64 years of age (2,497) are in the labor force, with 0.9% or 16 of them being unemployed. The group with the highest labor force participation rate are those with the educational attainment of bachelor's degree or higher, with 77.7% or 615 individuals in the labor force. Within the labor force, individuals with bachelor's degree or higher education have the highest percentage of unemployment, with 2.6% or 16 of them being unemployed.
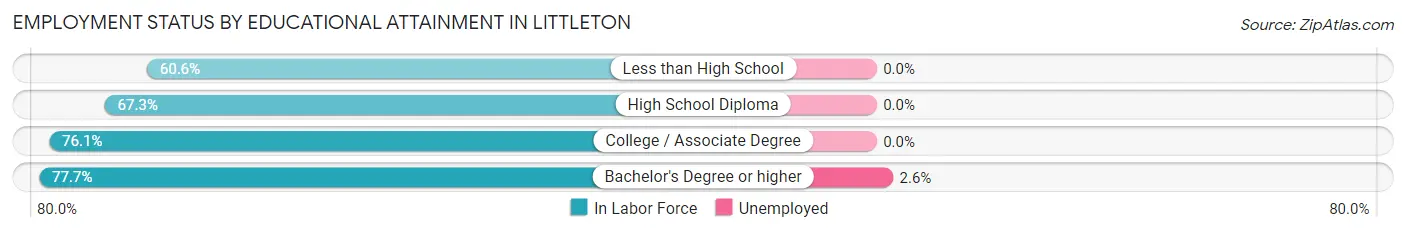
| Educational Attainment | In Labor Force | Unemployed |
| Less than High School | 269 (60.6%) | 0 (0.0%) |
| High School Diploma | 536 (67.3%) | 0 (0.0%) |
| College / Associate Degree | 353 (76.1%) | 0 (0.0%) |
| Bachelor's Degree or higher | 615 (77.7%) | 21 (2.6%) |
| Total | 1,773 (71.0%) | 22 (0.9%) |
Employment Occupations by Sex in Littleton
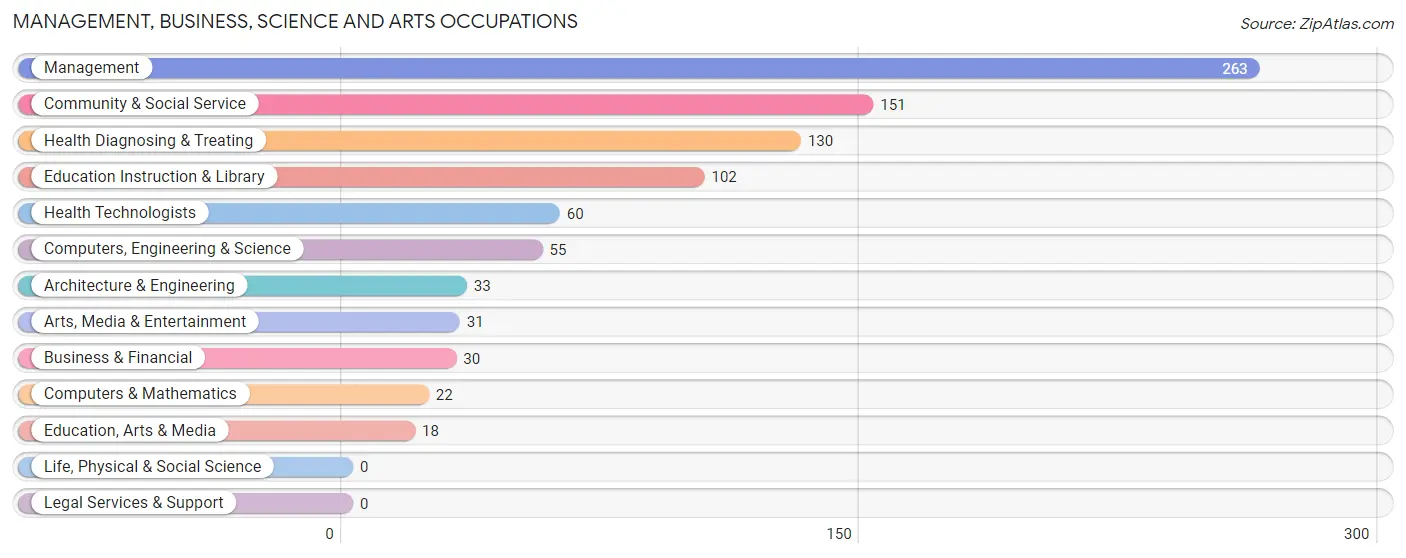
Management, Business, Science and Arts Occupations
The most common Management, Business, Science and Arts occupations in Littleton are Management (263 | 11.8%), Community & Social Service (151 | 6.8%), Health Diagnosing & Treating (130 | 5.8%), Education Instruction & Library (102 | 4.6%), and Health Technologists (60 | 2.7%).
Management, Business, Science and Arts Occupations by Sex
Within the Management, Business, Science and Arts occupations in Littleton, the most male-oriented occupations are Computers, Engineering & Science (100.0%), Computers & Mathematics (100.0%), and Architecture & Engineering (100.0%), while the most female-oriented occupations are Education, Arts & Media (100.0%), Education Instruction & Library (100.0%), and Community & Social Service (91.4%).
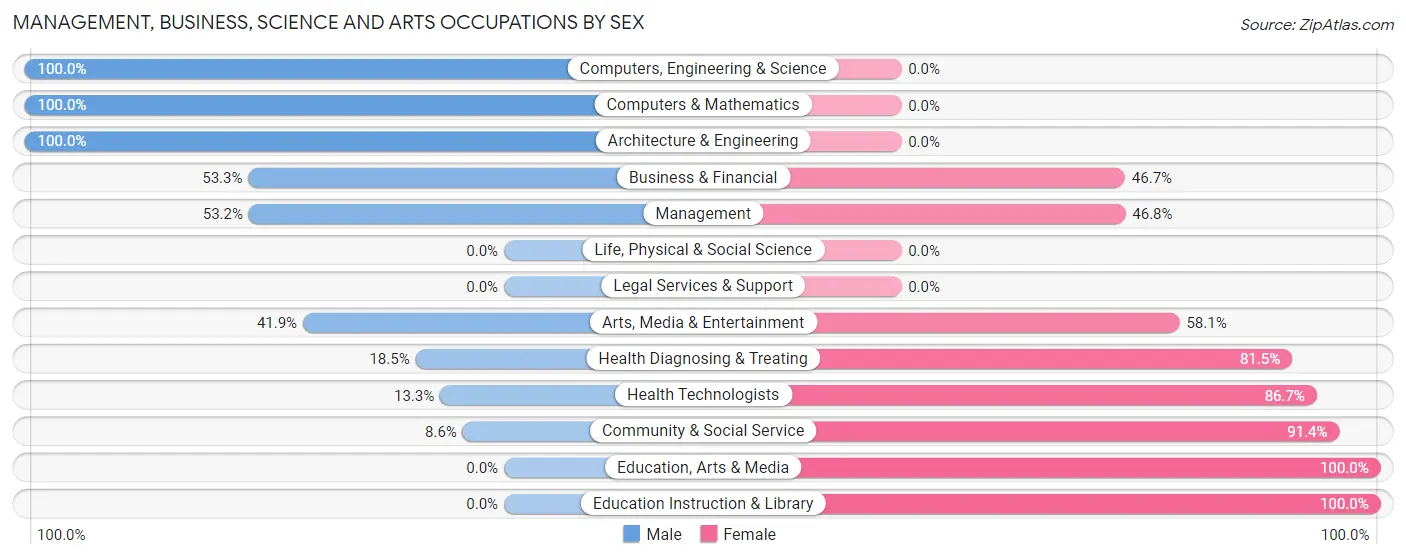
| Occupation | Male | Female |
| Management | 140 (53.2%) | 123 (46.8%) |
| Business & Financial | 16 (53.3%) | 14 (46.7%) |
| Computers, Engineering & Science | 55 (100.0%) | 0 (0.0%) |
| Computers & Mathematics | 22 (100.0%) | 0 (0.0%) |
| Architecture & Engineering | 33 (100.0%) | 0 (0.0%) |
| Life, Physical & Social Science | 0 (0.0%) | 0 (0.0%) |
| Community & Social Service | 13 (8.6%) | 138 (91.4%) |
| Education, Arts & Media | 0 (0.0%) | 18 (100.0%) |
| Legal Services & Support | 0 (0.0%) | 0 (0.0%) |
| Education Instruction & Library | 0 (0.0%) | 102 (100.0%) |
| Arts, Media & Entertainment | 13 (41.9%) | 18 (58.1%) |
| Health Diagnosing & Treating | 24 (18.5%) | 106 (81.5%) |
| Health Technologists | 8 (13.3%) | 52 (86.7%) |
| Total (Category) | 248 (39.4%) | 381 (60.6%) |
| Total (Overall) | 1,135 (50.8%) | 1,099 (49.2%) |
Services Occupations
The most common Services occupations in Littleton are Food Preparation & Serving (251 | 11.2%), Healthcare Support (110 | 4.9%), Cleaning & Maintenance (71 | 3.2%), and Personal Care & Service (57 | 2.5%).
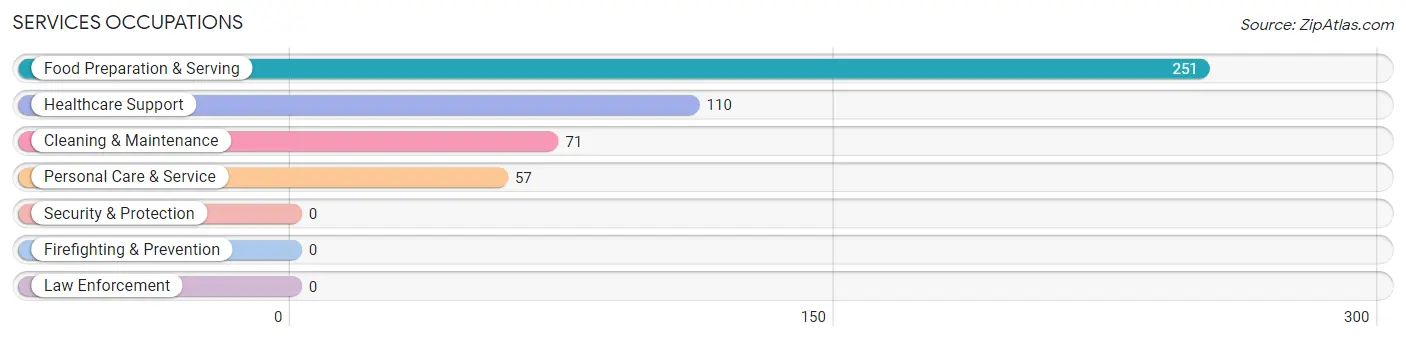
Services Occupations by Sex
Within the Services occupations in Littleton, the most male-oriented occupations are Cleaning & Maintenance (57.8%), Food Preparation & Serving (50.6%), and Healthcare Support (17.3%), while the most female-oriented occupations are Personal Care & Service (100.0%), Healthcare Support (82.7%), and Food Preparation & Serving (49.4%).
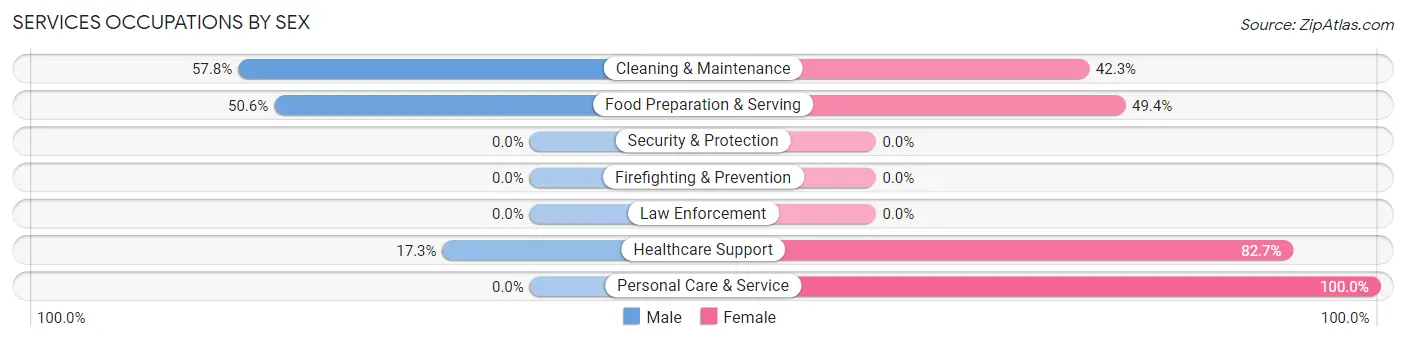
| Occupation | Male | Female |
| Healthcare Support | 19 (17.3%) | 91 (82.7%) |
| Security & Protection | 0 (0.0%) | 0 (0.0%) |
| Firefighting & Prevention | 0 (0.0%) | 0 (0.0%) |
| Law Enforcement | 0 (0.0%) | 0 (0.0%) |
| Food Preparation & Serving | 127 (50.6%) | 124 (49.4%) |
| Cleaning & Maintenance | 41 (57.8%) | 30 (42.2%) |
| Personal Care & Service | 0 (0.0%) | 57 (100.0%) |
| Total (Category) | 187 (38.2%) | 302 (61.8%) |
| Total (Overall) | 1,135 (50.8%) | 1,099 (49.2%) |
Sales and Office Occupations
The most common Sales and Office occupations in Littleton are Office & Administration (452 | 20.2%), and Sales & Related (368 | 16.5%).
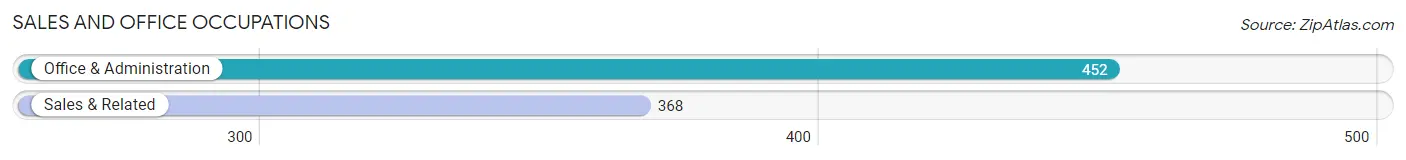
Sales and Office Occupations by Sex
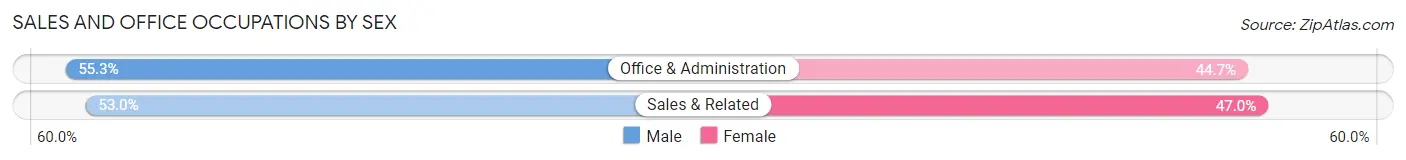
| Occupation | Male | Female |
| Sales & Related | 195 (53.0%) | 173 (47.0%) |
| Office & Administration | 250 (55.3%) | 202 (44.7%) |
| Total (Category) | 445 (54.3%) | 375 (45.7%) |
| Total (Overall) | 1,135 (50.8%) | 1,099 (49.2%) |
Natural Resources, Construction and Maintenance Occupations
The most common Natural Resources, Construction and Maintenance occupations in Littleton are , and Installation, Maintenance & Repair (42 | 1.9%).
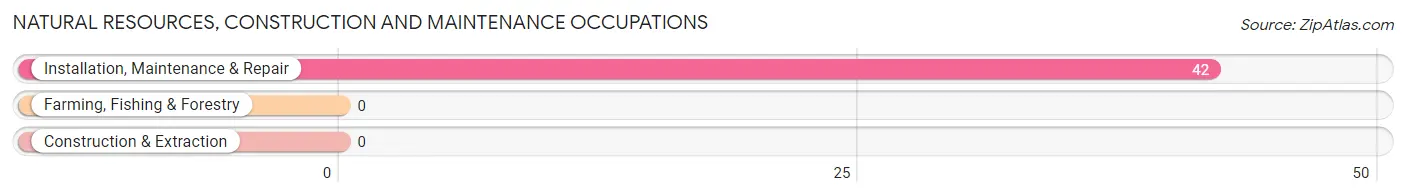
Natural Resources, Construction and Maintenance Occupations by Sex
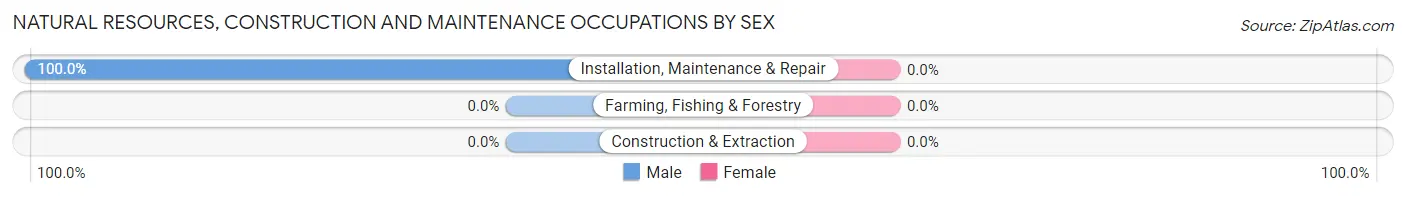
| Occupation | Male | Female |
| Farming, Fishing & Forestry | 0 (0.0%) | 0 (0.0%) |
| Construction & Extraction | 0 (0.0%) | 0 (0.0%) |
| Installation, Maintenance & Repair | 42 (100.0%) | 0 (0.0%) |
| Total (Category) | 42 (100.0%) | 0 (0.0%) |
| Total (Overall) | 1,135 (50.8%) | 1,099 (49.2%) |
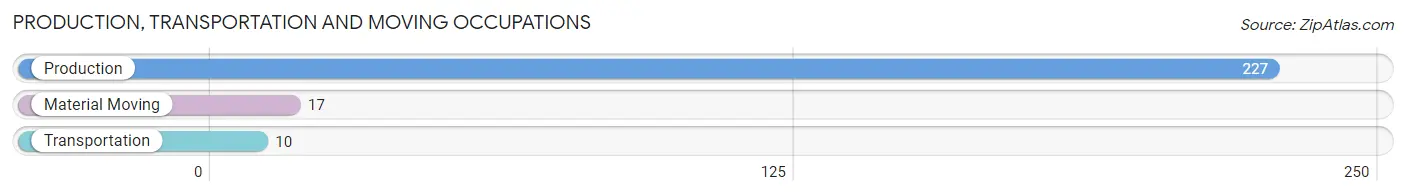
Production, Transportation and Moving Occupations
The most common Production, Transportation and Moving occupations in Littleton are Production (227 | 10.2%), Material Moving (17 | 0.8%), and Transportation (10 | 0.4%).
Production, Transportation and Moving Occupations by Sex
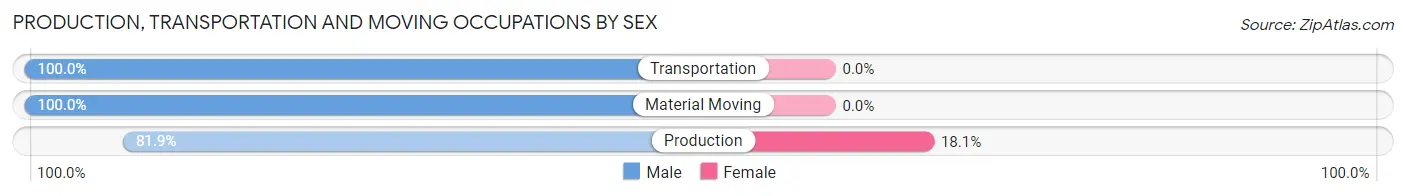
| Occupation | Male | Female |
| Production | 186 (81.9%) | 41 (18.1%) |
| Transportation | 10 (100.0%) | 0 (0.0%) |
| Material Moving | 17 (100.0%) | 0 (0.0%) |
| Total (Category) | 213 (83.9%) | 41 (16.1%) |
| Total (Overall) | 1,135 (50.8%) | 1,099 (49.2%) |
Employment Industries by Sex in Littleton
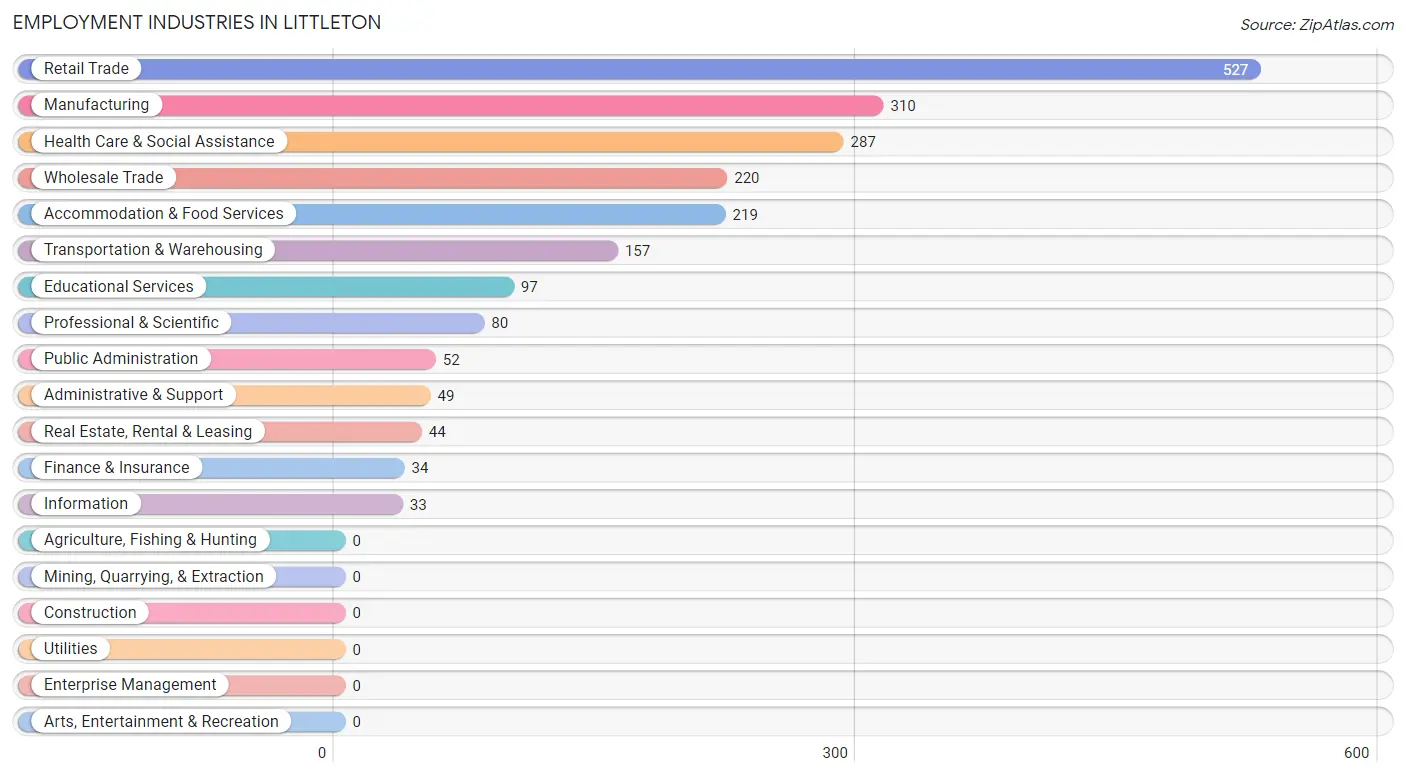
Employment Industries in Littleton
The major employment industries in Littleton include Retail Trade (527 | 23.6%), Manufacturing (310 | 13.9%), Health Care & Social Assistance (287 | 12.9%), Wholesale Trade (220 | 9.9%), and Accommodation & Food Services (219 | 9.8%).
Employment Industries by Sex in Littleton
The Littleton industries that see more men than women are Wholesale Trade (100.0%), Retail Trade (59.2%), and Accommodation & Food Services (58.5%), whereas the industries that tend to have a higher number of women are Finance & Insurance (100.0%), Educational Services (100.0%), and Public Administration (84.6%).
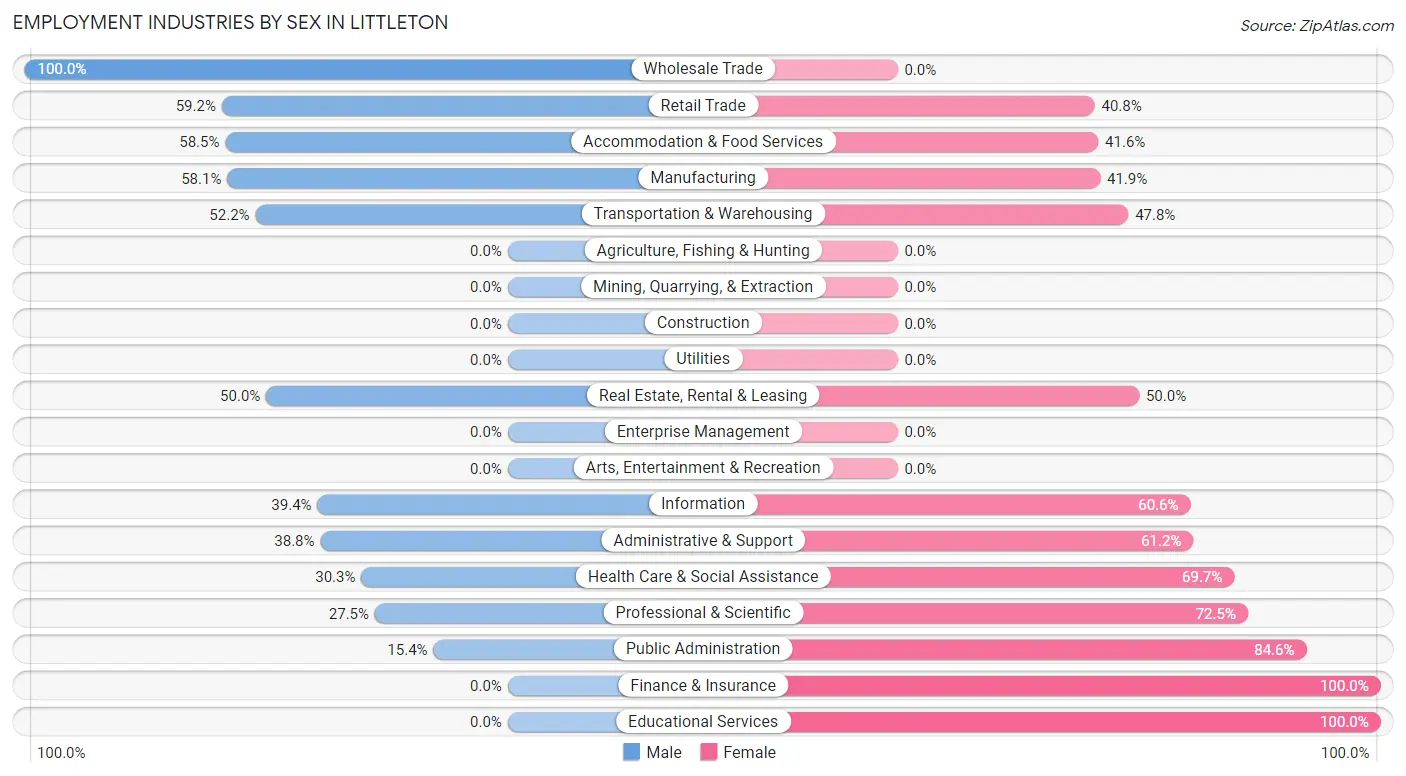
| Industry | Male | Female |
| Agriculture, Fishing & Hunting | 0 (0.0%) | 0 (0.0%) |
| Mining, Quarrying, & Extraction | 0 (0.0%) | 0 (0.0%) |
| Construction | 0 (0.0%) | 0 (0.0%) |
| Manufacturing | 180 (58.1%) | 130 (41.9%) |
| Wholesale Trade | 220 (100.0%) | 0 (0.0%) |
| Retail Trade | 312 (59.2%) | 215 (40.8%) |
| Transportation & Warehousing | 82 (52.2%) | 75 (47.8%) |
| Utilities | 0 (0.0%) | 0 (0.0%) |
| Information | 13 (39.4%) | 20 (60.6%) |
| Finance & Insurance | 0 (0.0%) | 34 (100.0%) |
| Real Estate, Rental & Leasing | 22 (50.0%) | 22 (50.0%) |
| Professional & Scientific | 22 (27.5%) | 58 (72.5%) |
| Enterprise Management | 0 (0.0%) | 0 (0.0%) |
| Administrative & Support | 19 (38.8%) | 30 (61.2%) |
| Educational Services | 0 (0.0%) | 97 (100.0%) |
| Health Care & Social Assistance | 87 (30.3%) | 200 (69.7%) |
| Arts, Entertainment & Recreation | 0 (0.0%) | 0 (0.0%) |
| Accommodation & Food Services | 128 (58.5%) | 91 (41.5%) |
| Public Administration | 8 (15.4%) | 44 (84.6%) |
| Total | 1,135 (50.8%) | 1,099 (49.2%) |
Education in Littleton
School Enrollment in Littleton
The most common levels of schooling among the 593 students in Littleton are middle school (184 | 31.0%), high school (164 | 27.7%), and kindergarten (99 | 16.7%).
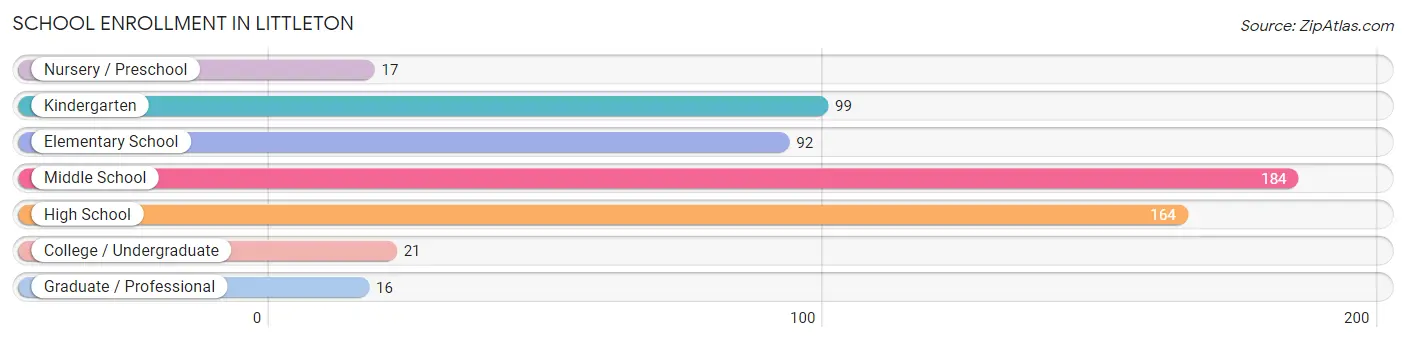
| School Level | # Students | % Students |
| Nursery / Preschool | 17 | 2.9% |
| Kindergarten | 99 | 16.7% |
| Elementary School | 92 | 15.5% |
| Middle School | 184 | 31.0% |
| High School | 164 | 27.7% |
| College / Undergraduate | 21 | 3.5% |
| Graduate / Professional | 16 | 2.7% |
| Total | 593 | 100.0% |
School Enrollment by Age by Funding Source in Littleton
Out of a total of 593 students who are enrolled in schools in Littleton, 17 (2.9%) attend a private institution, while the remaining 576 (97.1%) are enrolled in public schools. The age group of 3 to 4 year olds has the highest likelihood of being enrolled in private schools, with 17 (100.0% in the age bracket) enrolled. Conversely, the age group of 5 to 9 year old has the lowest likelihood of being enrolled in a private school, with 176 (100.0% in the age bracket) attending a public institution.
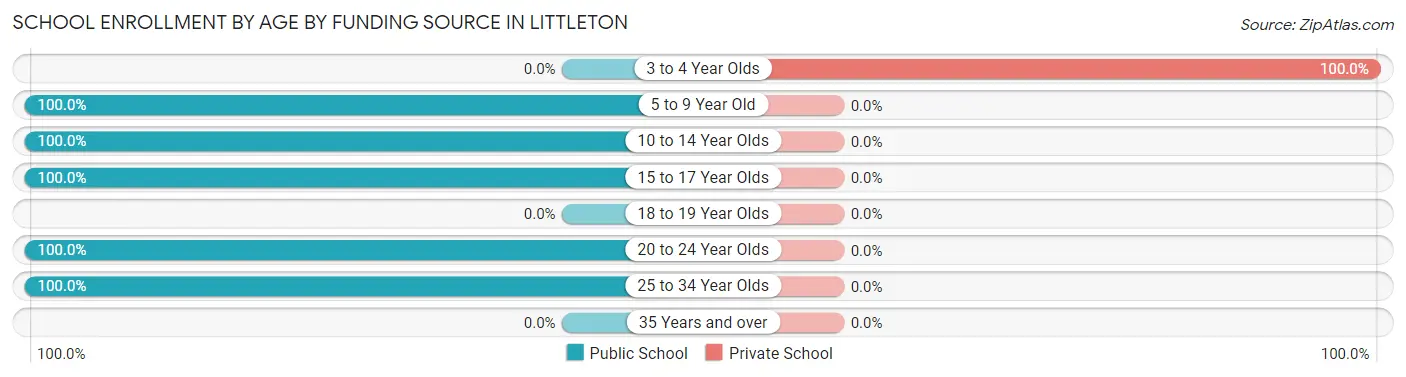
| Age Bracket | Public School | Private School |
| 3 to 4 Year Olds | 0 (0.0%) | 17 (100.0%) |
| 5 to 9 Year Old | 176 (100.0%) | 0 (0.0%) |
| 10 to 14 Year Olds | 199 (100.0%) | 0 (0.0%) |
| 15 to 17 Year Olds | 164 (100.0%) | 0 (0.0%) |
| 18 to 19 Year Olds | 0 (0.0%) | 0 (0.0%) |
| 20 to 24 Year Olds | 16 (100.0%) | 0 (0.0%) |
| 25 to 34 Year Olds | 21 (100.0%) | 0 (0.0%) |
| 35 Years and over | 0 (0.0%) | 0 (0.0%) |
| Total | 576 (97.1%) | 17 (2.9%) |
Educational Attainment by Field of Study in Littleton
Business (212 | 21.6%), social sciences (144 | 14.7%), education (134 | 13.7%), literature & languages (130 | 13.3%), and psychology (91 | 9.3%) are the most common fields of study among 980 individuals in Littleton who have obtained a bachelor's degree or higher.
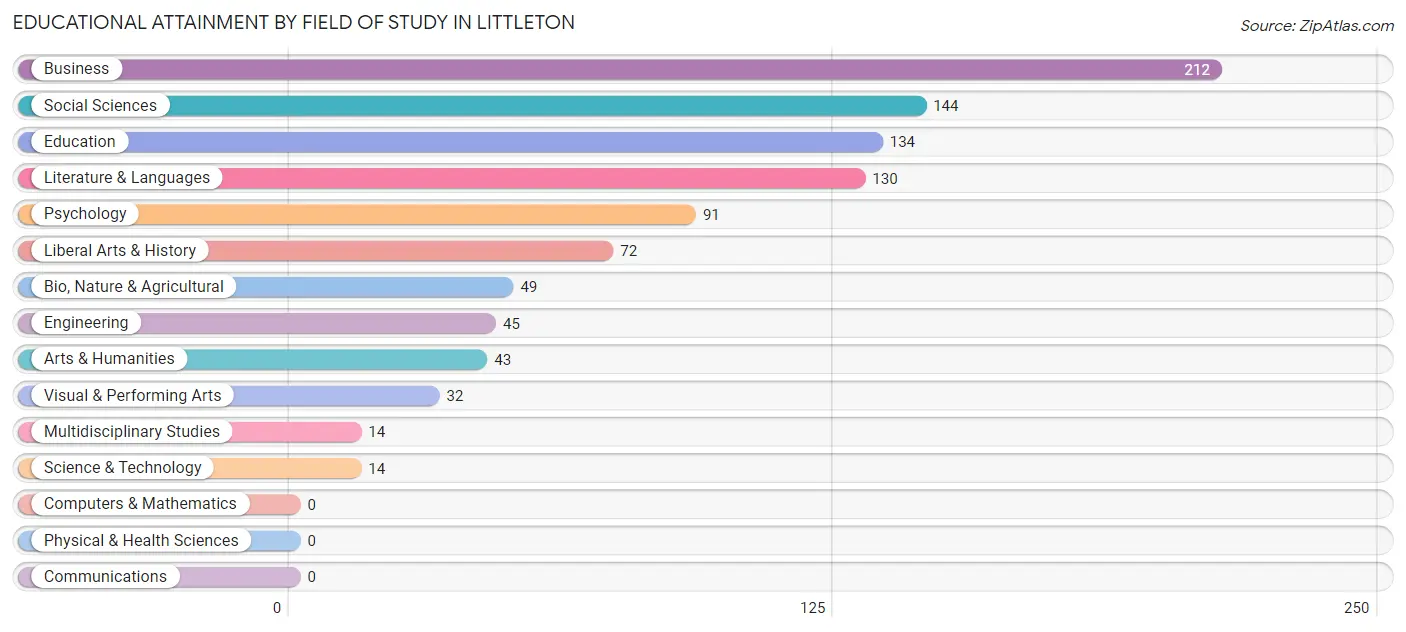
| Field of Study | # Graduates | % Graduates |
| Computers & Mathematics | 0 | 0.0% |
| Bio, Nature & Agricultural | 49 | 5.0% |
| Physical & Health Sciences | 0 | 0.0% |
| Psychology | 91 | 9.3% |
| Social Sciences | 144 | 14.7% |
| Engineering | 45 | 4.6% |
| Multidisciplinary Studies | 14 | 1.4% |
| Science & Technology | 14 | 1.4% |
| Business | 212 | 21.6% |
| Education | 134 | 13.7% |
| Literature & Languages | 130 | 13.3% |
| Liberal Arts & History | 72 | 7.3% |
| Visual & Performing Arts | 32 | 3.3% |
| Communications | 0 | 0.0% |
| Arts & Humanities | 43 | 4.4% |
| Total | 980 | 100.0% |
Transportation & Commute in Littleton
Vehicle Availability by Sex in Littleton
The most prevalent vehicle ownership categories in Littleton are males with 1 vehicle (438, accounting for 38.6%) and females with 1 vehicle (440, making up 39.9%).
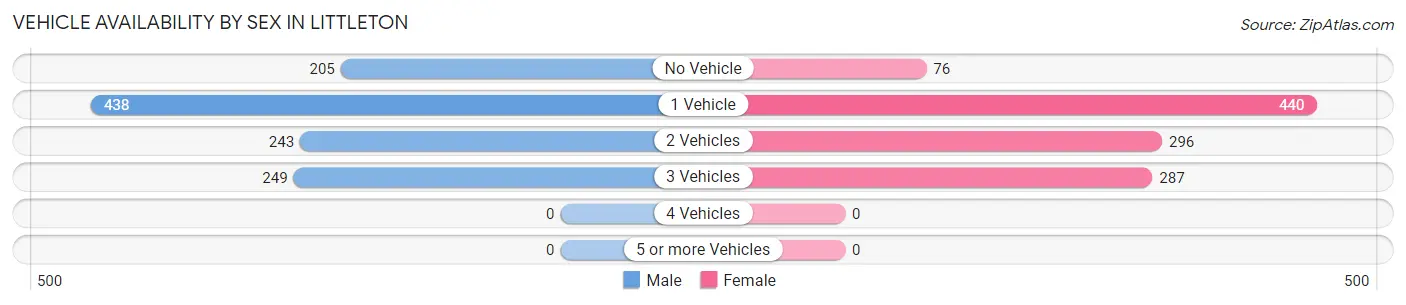
| Vehicles Available | Male | Female |
| No Vehicle | 205 (18.1%) | 76 (6.9%) |
| 1 Vehicle | 438 (38.6%) | 440 (40.0%) |
| 2 Vehicles | 243 (21.4%) | 296 (26.9%) |
| 3 Vehicles | 249 (21.9%) | 287 (26.1%) |
| 4 Vehicles | 0 (0.0%) | 0 (0.0%) |
| 5 or more Vehicles | 0 (0.0%) | 0 (0.0%) |
| Total | 1,135 (100.0%) | 1,099 (100.0%) |
Commute Time in Littleton
The most frequently occuring commute durations in Littleton are 10 to 14 minutes (483 commuters, 23.3%), 5 to 9 minutes (477 commuters, 23.1%), and 15 to 19 minutes (308 commuters, 14.9%).
| Commute Time | # Commuters | % Commuters |
| Less than 5 Minutes | 177 | 8.6% |
| 5 to 9 Minutes | 477 | 23.1% |
| 10 to 14 Minutes | 483 | 23.3% |
| 15 to 19 Minutes | 308 | 14.9% |
| 20 to 24 Minutes | 168 | 8.1% |
| 25 to 29 Minutes | 27 | 1.3% |
| 30 to 34 Minutes | 219 | 10.6% |
| 35 to 39 Minutes | 48 | 2.3% |
| 40 to 44 Minutes | 105 | 5.1% |
| 45 to 59 Minutes | 22 | 1.1% |
| 60 to 89 Minutes | 26 | 1.3% |
| 90 or more Minutes | 9 | 0.4% |
Commute Time by Sex in Littleton
The most common commute times in Littleton are 10 to 14 minutes (318 commuters, 29.3%) for males and 5 to 9 minutes (253 commuters, 25.7%) for females.
| Commute Time | Male | Female |
| Less than 5 Minutes | 154 (14.2%) | 23 (2.3%) |
| 5 to 9 Minutes | 224 (20.7%) | 253 (25.7%) |
| 10 to 14 Minutes | 318 (29.3%) | 165 (16.8%) |
| 15 to 19 Minutes | 100 (9.2%) | 208 (21.1%) |
| 20 to 24 Minutes | 70 (6.5%) | 98 (10.0%) |
| 25 to 29 Minutes | 0 (0.0%) | 27 (2.7%) |
| 30 to 34 Minutes | 84 (7.7%) | 135 (13.7%) |
| 35 to 39 Minutes | 31 (2.9%) | 17 (1.7%) |
| 40 to 44 Minutes | 72 (6.6%) | 33 (3.4%) |
| 45 to 59 Minutes | 22 (2.0%) | 0 (0.0%) |
| 60 to 89 Minutes | 0 (0.0%) | 26 (2.6%) |
| 90 or more Minutes | 9 (0.8%) | 0 (0.0%) |
Time of Departure to Work by Sex in Littleton
The most frequent times of departure to work in Littleton are 6:30 AM to 6:59 AM (353, 32.6%) for males and 8:00 AM to 8:29 AM (283, 28.7%) for females.
| Time of Departure | Male | Female |
| 12:00 AM to 4:59 AM | 121 (11.2%) | 0 (0.0%) |
| 5:00 AM to 5:29 AM | 0 (0.0%) | 0 (0.0%) |
| 5:30 AM to 5:59 AM | 34 (3.1%) | 50 (5.1%) |
| 6:00 AM to 6:29 AM | 25 (2.3%) | 63 (6.4%) |
| 6:30 AM to 6:59 AM | 353 (32.6%) | 44 (4.5%) |
| 7:00 AM to 7:29 AM | 78 (7.2%) | 160 (16.2%) |
| 7:30 AM to 7:59 AM | 168 (15.5%) | 140 (14.2%) |
| 8:00 AM to 8:29 AM | 117 (10.8%) | 283 (28.7%) |
| 8:30 AM to 8:59 AM | 11 (1.0%) | 21 (2.1%) |
| 9:00 AM to 9:59 AM | 45 (4.2%) | 23 (2.3%) |
| 10:00 AM to 10:59 AM | 0 (0.0%) | 29 (2.9%) |
| 11:00 AM to 11:59 AM | 0 (0.0%) | 0 (0.0%) |
| 12:00 PM to 3:59 PM | 69 (6.4%) | 85 (8.6%) |
| 4:00 PM to 11:59 PM | 63 (5.8%) | 87 (8.8%) |
| Total | 1,084 (100.0%) | 985 (100.0%) |
Housing Occupancy in Littleton
Occupancy by Ownership in Littleton
Of the total 2,109 dwellings in Littleton, owner-occupied units account for 854 (40.5%), while renter-occupied units make up 1,255 (59.5%).
| Occupancy | # Housing Units | % Housing Units |
| Owner Occupied Housing Units | 854 | 40.5% |
| Renter-Occupied Housing Units | 1,255 | 59.5% |
| Total Occupied Housing Units | 2,109 | 100.0% |
Occupancy by Household Size in Littleton
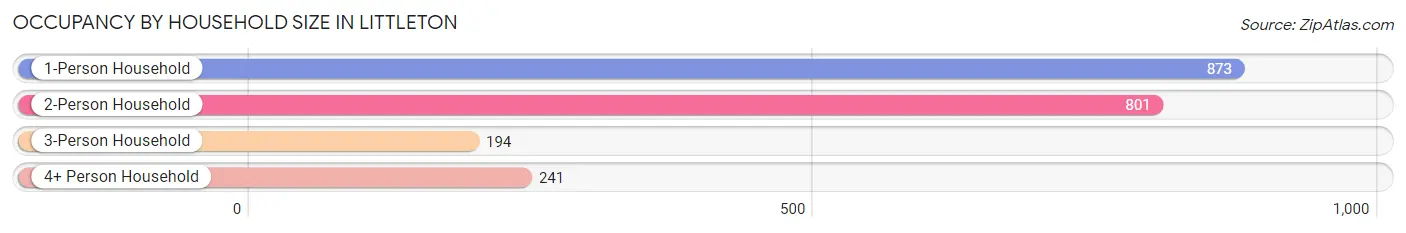
| Household Size | # Housing Units | % Housing Units |
| 1-Person Household | 873 | 41.4% |
| 2-Person Household | 801 | 38.0% |
| 3-Person Household | 194 | 9.2% |
| 4+ Person Household | 241 | 11.4% |
| Total Housing Units | 2,109 | 100.0% |
Occupancy by Ownership by Household Size in Littleton
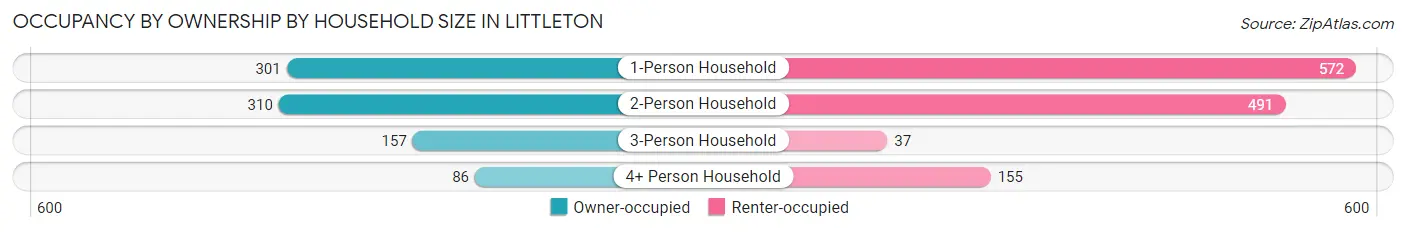
| Household Size | Owner-occupied | Renter-occupied |
| 1-Person Household | 301 (34.5%) | 572 (65.5%) |
| 2-Person Household | 310 (38.7%) | 491 (61.3%) |
| 3-Person Household | 157 (80.9%) | 37 (19.1%) |
| 4+ Person Household | 86 (35.7%) | 155 (64.3%) |
| Total Housing Units | 854 (40.5%) | 1,255 (59.5%) |
Occupancy by Educational Attainment in Littleton
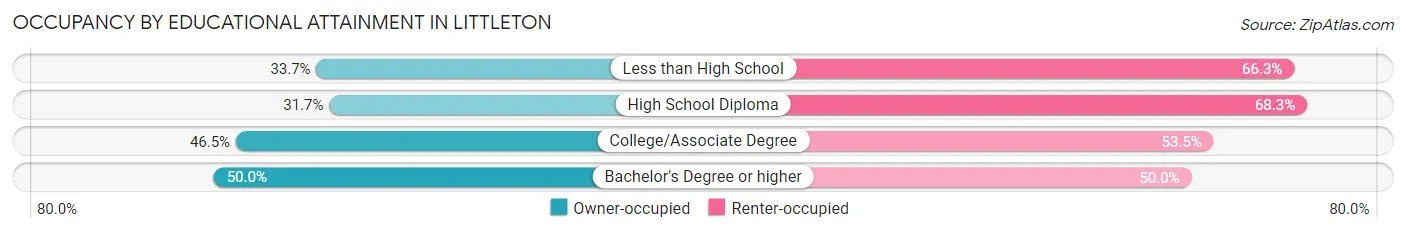
| Household Size | Owner-occupied | Renter-occupied |
| Less than High School | 59 (33.7%) | 116 (66.3%) |
| High School Diploma | 267 (31.7%) | 576 (68.3%) |
| College/Associate Degree | 231 (46.5%) | 266 (53.5%) |
| Bachelor's Degree or higher | 297 (50.0%) | 297 (50.0%) |
Occupancy by Age of Householder in Littleton
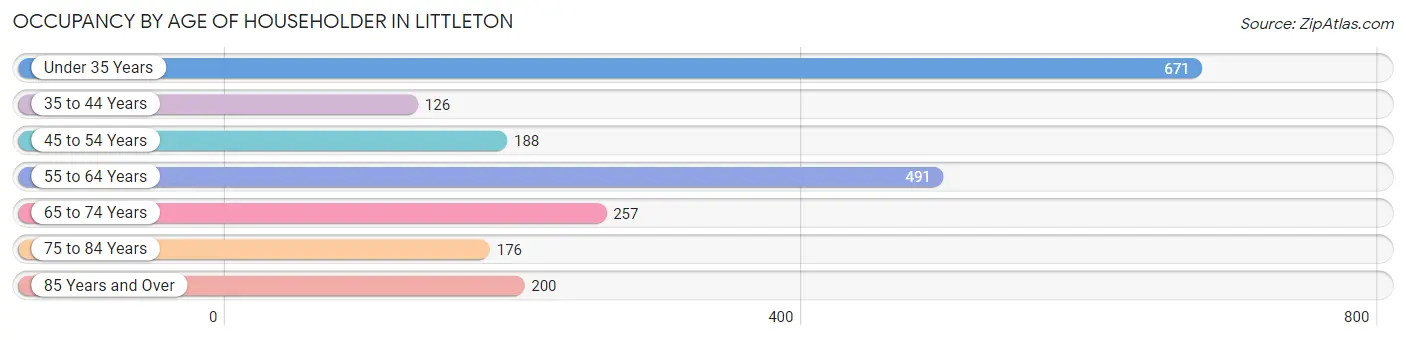
| Age Bracket | # Households | % Households |
| Under 35 Years | 671 | 31.8% |
| 35 to 44 Years | 126 | 6.0% |
| 45 to 54 Years | 188 | 8.9% |
| 55 to 64 Years | 491 | 23.3% |
| 65 to 74 Years | 257 | 12.2% |
| 75 to 84 Years | 176 | 8.4% |
| 85 Years and Over | 200 | 9.5% |
| Total | 2,109 | 100.0% |
Housing Finances in Littleton
Median Income by Occupancy in Littleton
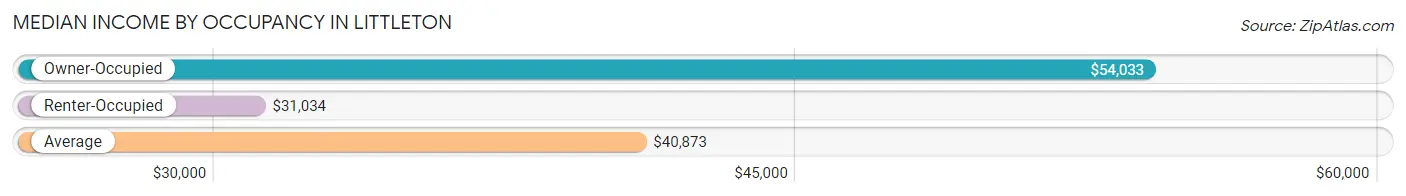
| Occupancy Type | # Households | Median Income |
| Owner-Occupied | 854 (40.5%) | $54,033 |
| Renter-Occupied | 1,255 (59.5%) | $31,034 |
| Average | 2,109 (100.0%) | $40,873 |
Occupancy by Householder Income Bracket in Littleton
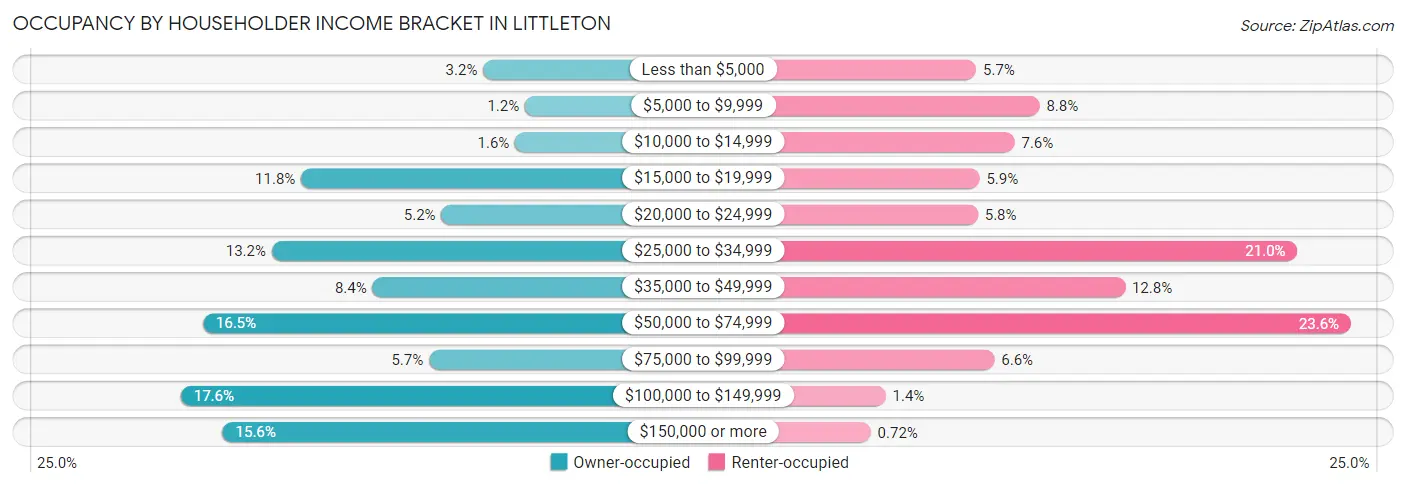
| Income Bracket | Owner-occupied | Renter-occupied |
| Less than $5,000 | 27 (3.2%) | 72 (5.7%) |
| $5,000 to $9,999 | 10 (1.2%) | 110 (8.8%) |
| $10,000 to $14,999 | 14 (1.6%) | 95 (7.6%) |
| $15,000 to $19,999 | 101 (11.8%) | 74 (5.9%) |
| $20,000 to $24,999 | 44 (5.1%) | 73 (5.8%) |
| $25,000 to $34,999 | 113 (13.2%) | 264 (21.0%) |
| $35,000 to $49,999 | 72 (8.4%) | 161 (12.8%) |
| $50,000 to $74,999 | 141 (16.5%) | 296 (23.6%) |
| $75,000 to $99,999 | 49 (5.7%) | 83 (6.6%) |
| $100,000 to $149,999 | 150 (17.6%) | 18 (1.4%) |
| $150,000 or more | 133 (15.6%) | 9 (0.7%) |
| Total | 854 (100.0%) | 1,255 (100.0%) |
Monthly Housing Cost Tiers in Littleton
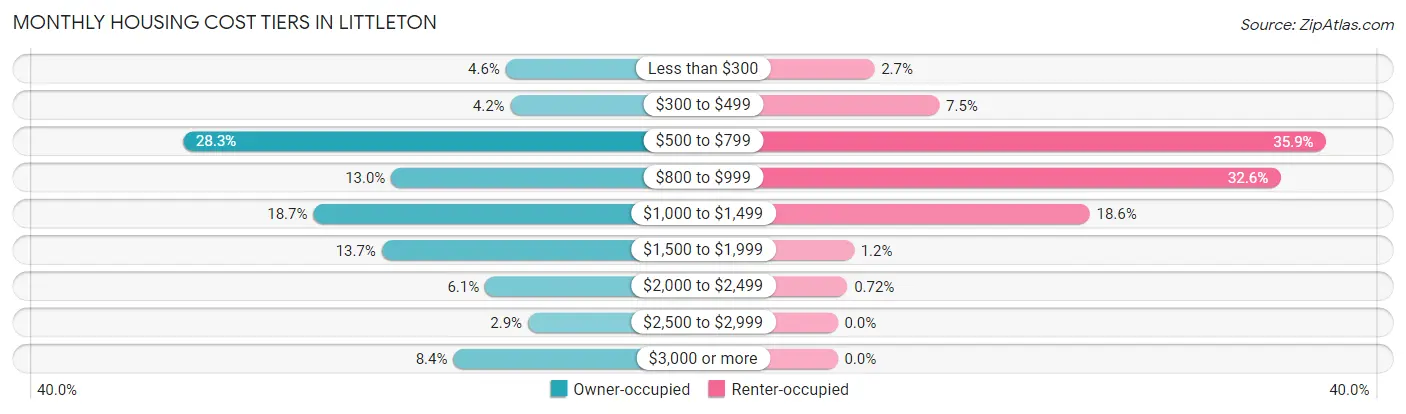
| Monthly Cost | Owner-occupied | Renter-occupied |
| Less than $300 | 39 (4.6%) | 34 (2.7%) |
| $300 to $499 | 36 (4.2%) | 94 (7.5%) |
| $500 to $799 | 242 (28.3%) | 451 (35.9%) |
| $800 to $999 | 111 (13.0%) | 409 (32.6%) |
| $1,000 to $1,499 | 160 (18.7%) | 233 (18.6%) |
| $1,500 to $1,999 | 117 (13.7%) | 15 (1.2%) |
| $2,000 to $2,499 | 52 (6.1%) | 9 (0.7%) |
| $2,500 to $2,999 | 25 (2.9%) | 0 (0.0%) |
| $3,000 or more | 72 (8.4%) | 0 (0.0%) |
| Total | 854 (100.0%) | 1,255 (100.0%) |
Physical Housing Characteristics in Littleton
Housing Structures in Littleton
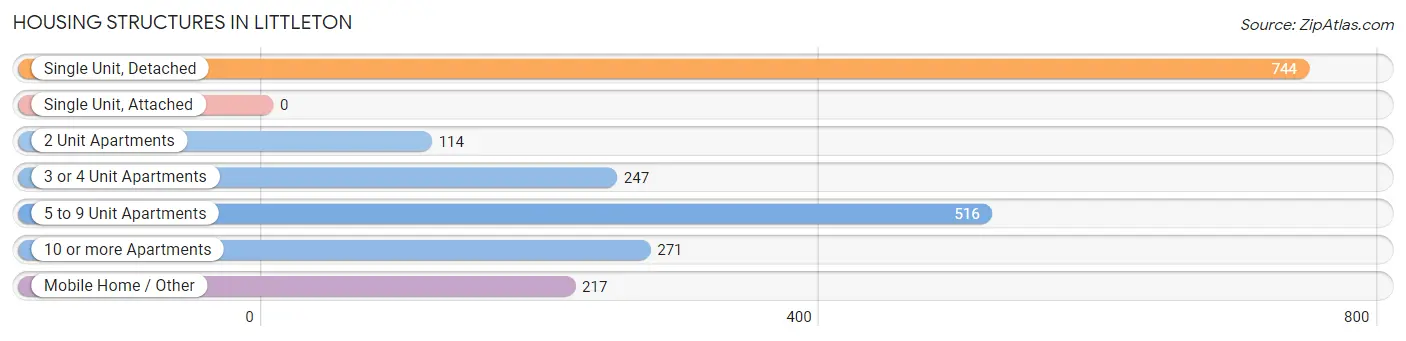
| Structure Type | # Housing Units | % Housing Units |
| Single Unit, Detached | 744 | 35.3% |
| Single Unit, Attached | 0 | 0.0% |
| 2 Unit Apartments | 114 | 5.4% |
| 3 or 4 Unit Apartments | 247 | 11.7% |
| 5 to 9 Unit Apartments | 516 | 24.5% |
| 10 or more Apartments | 271 | 12.9% |
| Mobile Home / Other | 217 | 10.3% |
| Total | 2,109 | 100.0% |
Housing Structures by Occupancy in Littleton
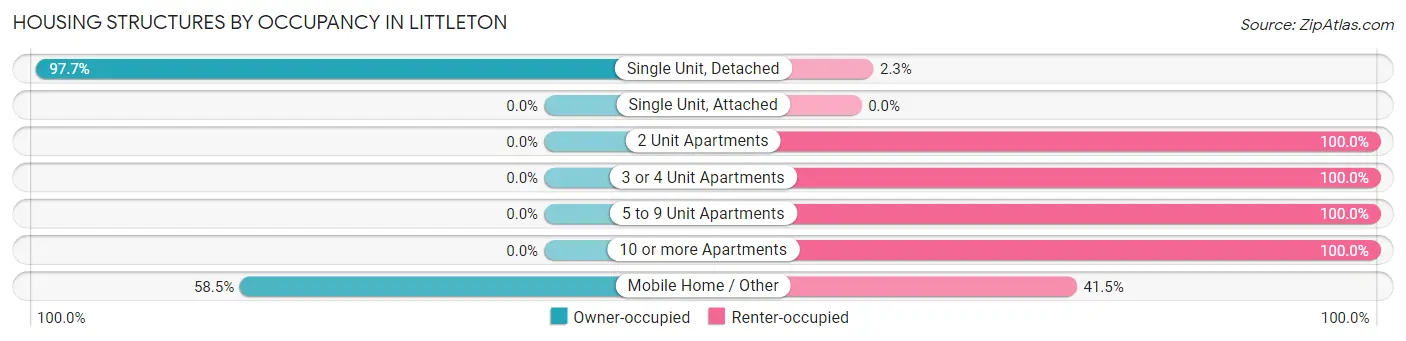
| Structure Type | Owner-occupied | Renter-occupied |
| Single Unit, Detached | 727 (97.7%) | 17 (2.3%) |
| Single Unit, Attached | 0 (0.0%) | 0 (0.0%) |
| 2 Unit Apartments | 0 (0.0%) | 114 (100.0%) |
| 3 or 4 Unit Apartments | 0 (0.0%) | 247 (100.0%) |
| 5 to 9 Unit Apartments | 0 (0.0%) | 516 (100.0%) |
| 10 or more Apartments | 0 (0.0%) | 271 (100.0%) |
| Mobile Home / Other | 127 (58.5%) | 90 (41.5%) |
| Total | 854 (40.5%) | 1,255 (59.5%) |
Housing Structures by Number of Rooms in Littleton
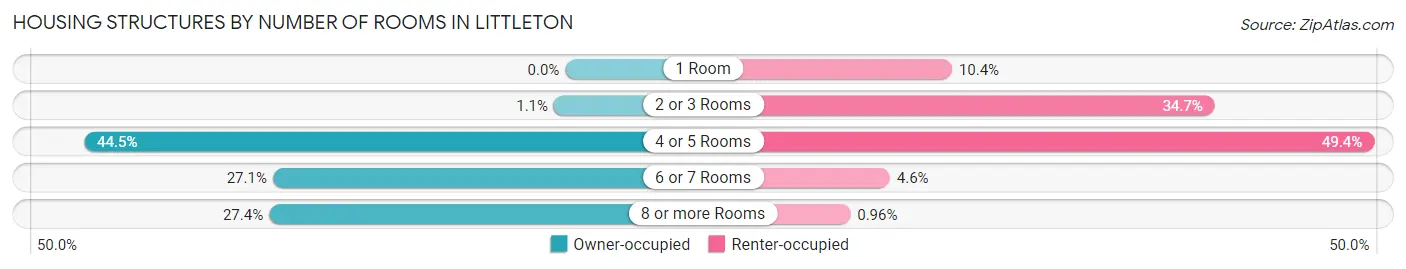
| Number of Rooms | Owner-occupied | Renter-occupied |
| 1 Room | 0 (0.0%) | 130 (10.4%) |
| 2 or 3 Rooms | 9 (1.1%) | 435 (34.7%) |
| 4 or 5 Rooms | 380 (44.5%) | 620 (49.4%) |
| 6 or 7 Rooms | 231 (27.1%) | 58 (4.6%) |
| 8 or more Rooms | 234 (27.4%) | 12 (1.0%) |
| Total | 854 (100.0%) | 1,255 (100.0%) |
Housing Structure by Heating Type in Littleton
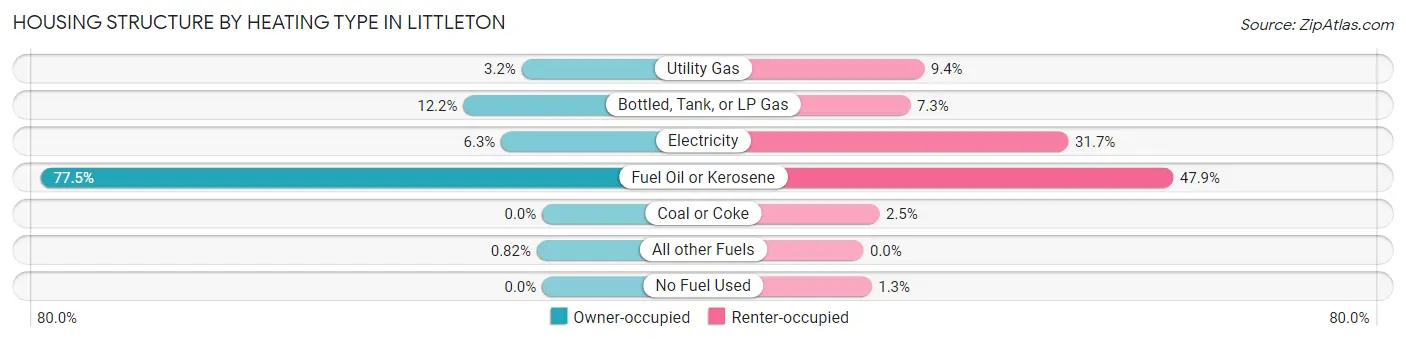
| Heating Type | Owner-occupied | Renter-occupied |
| Utility Gas | 27 (3.2%) | 118 (9.4%) |
| Bottled, Tank, or LP Gas | 104 (12.2%) | 91 (7.2%) |
| Electricity | 54 (6.3%) | 398 (31.7%) |
| Fuel Oil or Kerosene | 662 (77.5%) | 601 (47.9%) |
| Coal or Coke | 0 (0.0%) | 31 (2.5%) |
| All other Fuels | 7 (0.8%) | 0 (0.0%) |
| No Fuel Used | 0 (0.0%) | 16 (1.3%) |
| Total | 854 (100.0%) | 1,255 (100.0%) |
Household Vehicle Usage in Littleton
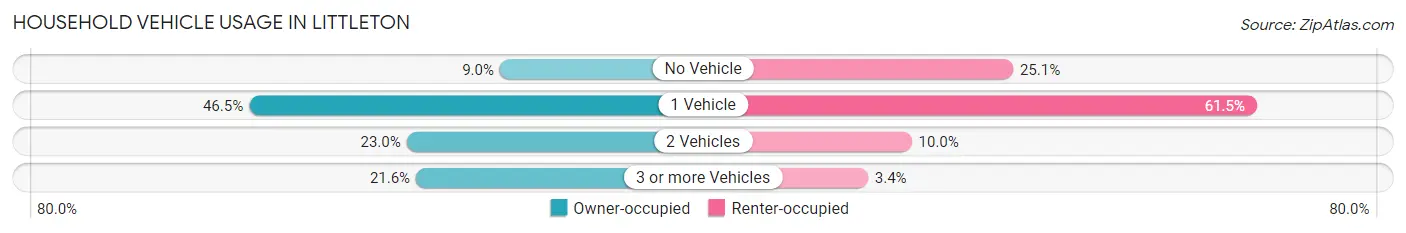
| Vehicles per Household | Owner-occupied | Renter-occupied |
| No Vehicle | 77 (9.0%) | 315 (25.1%) |
| 1 Vehicle | 397 (46.5%) | 772 (61.5%) |
| 2 Vehicles | 196 (23.0%) | 125 (10.0%) |
| 3 or more Vehicles | 184 (21.5%) | 43 (3.4%) |
| Total | 854 (100.0%) | 1,255 (100.0%) |
Real Estate & Mortgages in Littleton
Real Estate and Mortgage Overview in Littleton
| Characteristic | Without Mortgage | With Mortgage |
| Housing Units | 457 | 397 |
| Median Property Value | $198,800 | $165,800 |
| Median Household Income | $31,890 | $52 |
| Monthly Housing Costs | $707 | $0 |
| Real Estate Taxes | $3,932 | $15 |
Property Value by Mortgage Status in Littleton
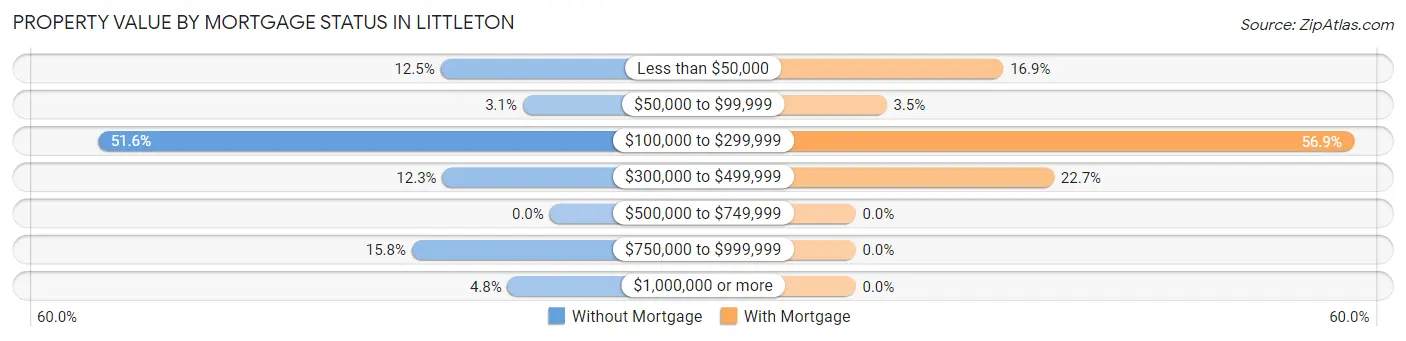
| Property Value | Without Mortgage | With Mortgage |
| Less than $50,000 | 57 (12.5%) | 67 (16.9%) |
| $50,000 to $99,999 | 14 (3.1%) | 14 (3.5%) |
| $100,000 to $299,999 | 236 (51.6%) | 226 (56.9%) |
| $300,000 to $499,999 | 56 (12.2%) | 90 (22.7%) |
| $500,000 to $749,999 | 0 (0.0%) | 0 (0.0%) |
| $750,000 to $999,999 | 72 (15.8%) | 0 (0.0%) |
| $1,000,000 or more | 22 (4.8%) | 0 (0.0%) |
| Total | 457 (100.0%) | 397 (100.0%) |
Household Income by Mortgage Status in Littleton
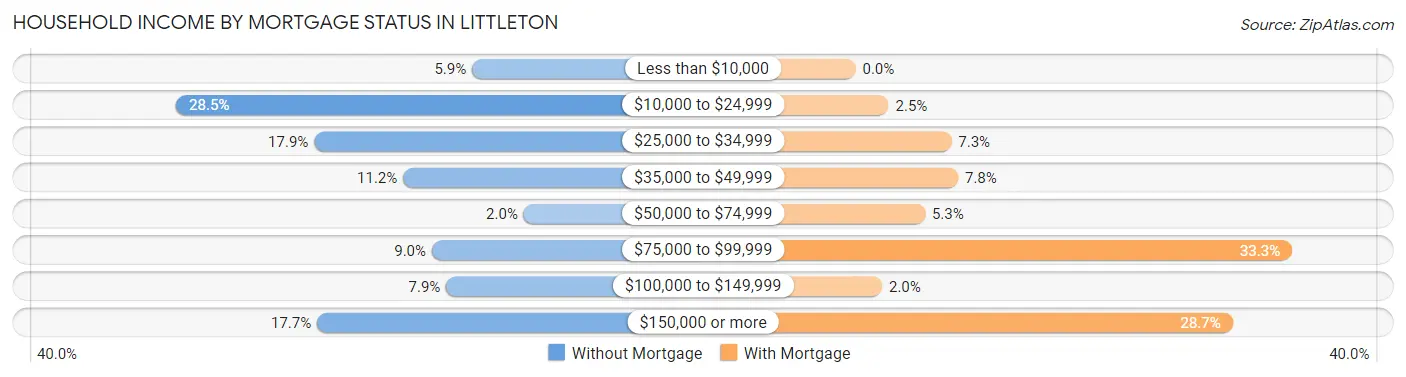
| Household Income | Without Mortgage | With Mortgage |
| Less than $10,000 | 27 (5.9%) | 0 (0.0%) |
| $10,000 to $24,999 | 130 (28.4%) | 10 (2.5%) |
| $25,000 to $34,999 | 82 (17.9%) | 29 (7.3%) |
| $35,000 to $49,999 | 51 (11.2%) | 31 (7.8%) |
| $50,000 to $74,999 | 9 (2.0%) | 21 (5.3%) |
| $75,000 to $99,999 | 41 (9.0%) | 132 (33.3%) |
| $100,000 to $149,999 | 36 (7.9%) | 8 (2.0%) |
| $150,000 or more | 81 (17.7%) | 114 (28.7%) |
| Total | 457 (100.0%) | 397 (100.0%) |
Property Value to Household Income Ratio in Littleton
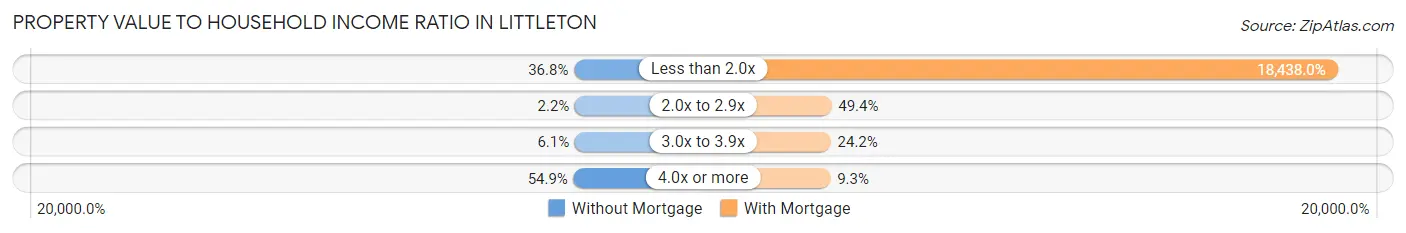
| Value-to-Income Ratio | Without Mortgage | With Mortgage |
| Less than 2.0x | 168 (36.8%) | 73,199 (18,438.0%) |
| 2.0x to 2.9x | 10 (2.2%) | 196 (49.4%) |
| 3.0x to 3.9x | 28 (6.1%) | 96 (24.2%) |
| 4.0x or more | 251 (54.9%) | 37 (9.3%) |
| Total | 457 (100.0%) | 397 (100.0%) |
Real Estate Taxes by Mortgage Status in Littleton
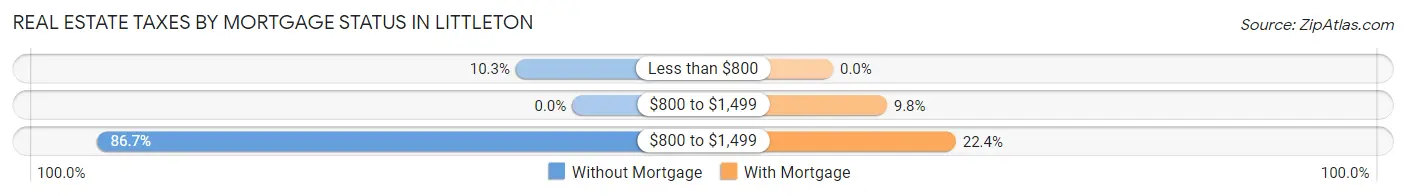
| Property Taxes | Without Mortgage | With Mortgage |
| Less than $800 | 47 (10.3%) | 0 (0.0%) |
| $800 to $1,499 | 0 (0.0%) | 39 (9.8%) |
| $800 to $1,499 | 396 (86.7%) | 89 (22.4%) |
| Total | 457 (100.0%) | 397 (100.0%) |
Health & Disability in Littleton
Health Insurance Coverage by Age in Littleton
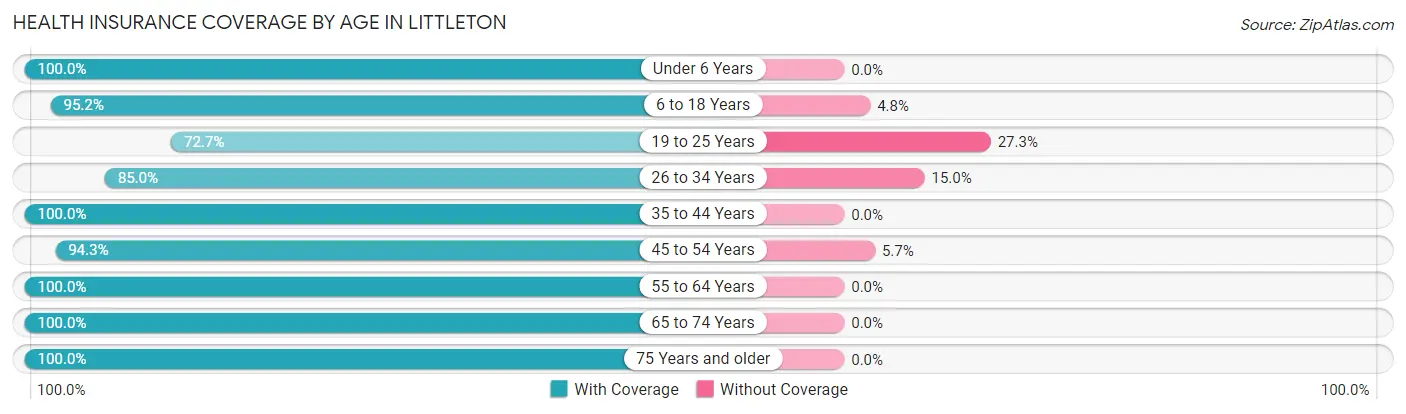
| Age Bracket | With Coverage | Without Coverage |
| Under 6 Years | 225 (100.0%) | 0 (0.0%) |
| 6 to 18 Years | 550 (95.2%) | 28 (4.8%) |
| 19 to 25 Years | 402 (72.7%) | 151 (27.3%) |
| 26 to 34 Years | 830 (85.0%) | 146 (15.0%) |
| 35 to 44 Years | 258 (100.0%) | 0 (0.0%) |
| 45 to 54 Years | 379 (94.3%) | 23 (5.7%) |
| 55 to 64 Years | 761 (100.0%) | 0 (0.0%) |
| 65 to 74 Years | 387 (100.0%) | 0 (0.0%) |
| 75 Years and older | 447 (100.0%) | 0 (0.0%) |
| Total | 4,239 (92.4%) | 348 (7.6%) |
Health Insurance Coverage by Citizenship Status in Littleton
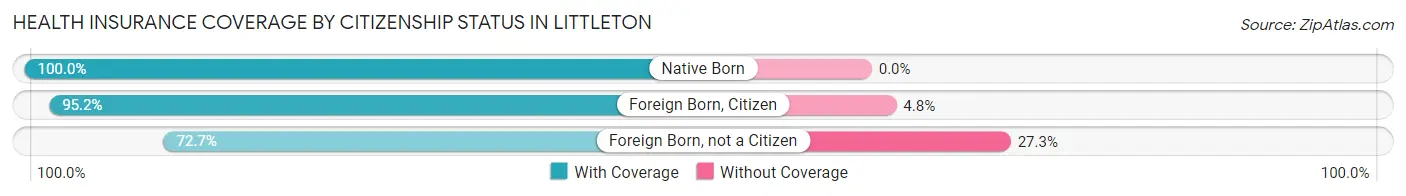
| Citizenship Status | With Coverage | Without Coverage |
| Native Born | 225 (100.0%) | 0 (0.0%) |
| Foreign Born, Citizen | 550 (95.2%) | 28 (4.8%) |
| Foreign Born, not a Citizen | 402 (72.7%) | 151 (27.3%) |
Health Insurance Coverage by Household Income in Littleton
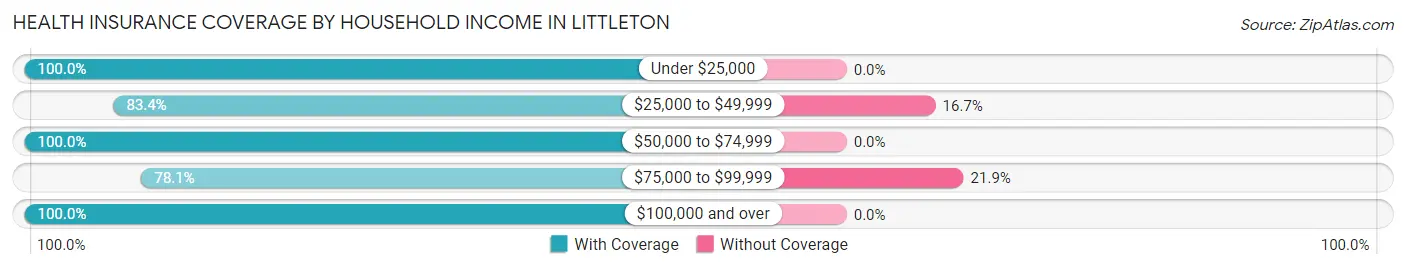
| Household Income | With Coverage | Without Coverage |
| Under $25,000 | 794 (100.0%) | 0 (0.0%) |
| $25,000 to $49,999 | 1,186 (83.4%) | 237 (16.7%) |
| $50,000 to $74,999 | 963 (100.0%) | 0 (0.0%) |
| $75,000 to $99,999 | 396 (78.1%) | 111 (21.9%) |
| $100,000 and over | 844 (100.0%) | 0 (0.0%) |
Public vs Private Health Insurance Coverage by Age in Littleton
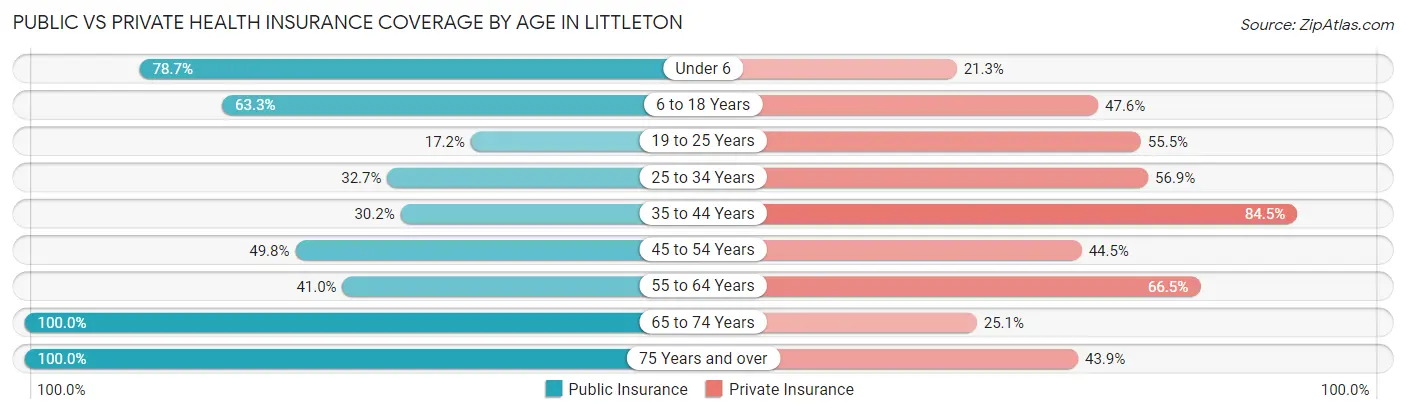
| Age Bracket | Public Insurance | Private Insurance |
| Under 6 | 177 (78.7%) | 48 (21.3%) |
| 6 to 18 Years | 366 (63.3%) | 275 (47.6%) |
| 19 to 25 Years | 95 (17.2%) | 307 (55.5%) |
| 25 to 34 Years | 319 (32.7%) | 555 (56.9%) |
| 35 to 44 Years | 78 (30.2%) | 218 (84.5%) |
| 45 to 54 Years | 200 (49.7%) | 179 (44.5%) |
| 55 to 64 Years | 312 (41.0%) | 506 (66.5%) |
| 65 to 74 Years | 387 (100.0%) | 97 (25.1%) |
| 75 Years and over | 447 (100.0%) | 196 (43.9%) |
| Total | 2,381 (51.9%) | 2,381 (51.9%) |
Disability Status by Sex by Age in Littleton
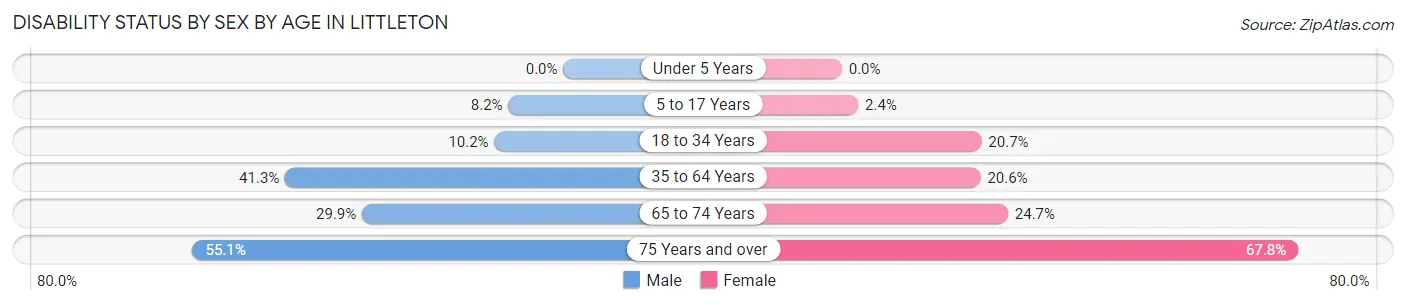
| Age Bracket | Male | Female |
| Under 5 Years | 0 (0.0%) | 0 (0.0%) |
| 5 to 17 Years | 26 (8.2%) | 6 (2.4%) |
| 18 to 34 Years | 85 (10.2%) | 147 (20.7%) |
| 35 to 64 Years | 278 (41.3%) | 154 (20.6%) |
| 65 to 74 Years | 49 (29.9%) | 55 (24.7%) |
| 75 Years and over | 60 (55.0%) | 229 (67.7%) |
Disability Class by Sex by Age in Littleton
Disability Class: Hearing Difficulty
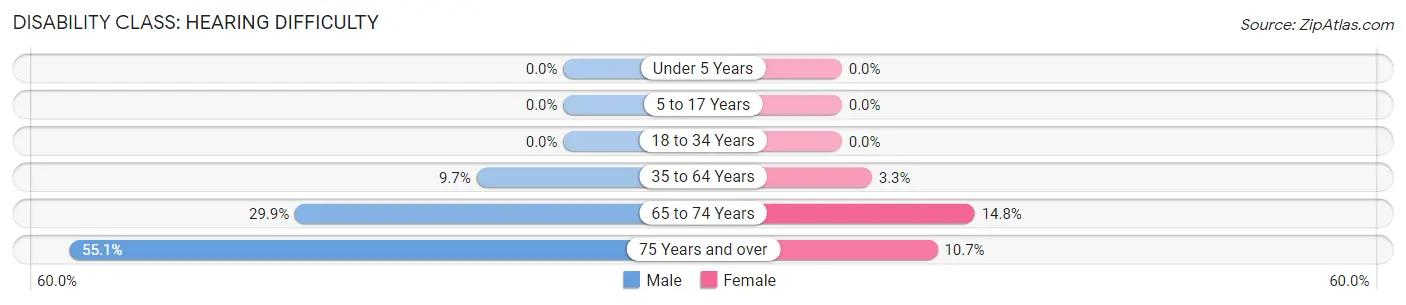
| Age Bracket | Male | Female |
| Under 5 Years | 0 (0.0%) | 0 (0.0%) |
| 5 to 17 Years | 0 (0.0%) | 0 (0.0%) |
| 18 to 34 Years | 0 (0.0%) | 0 (0.0%) |
| 35 to 64 Years | 65 (9.7%) | 25 (3.3%) |
| 65 to 74 Years | 49 (29.9%) | 33 (14.8%) |
| 75 Years and over | 60 (55.0%) | 36 (10.6%) |
Disability Class: Vision Difficulty
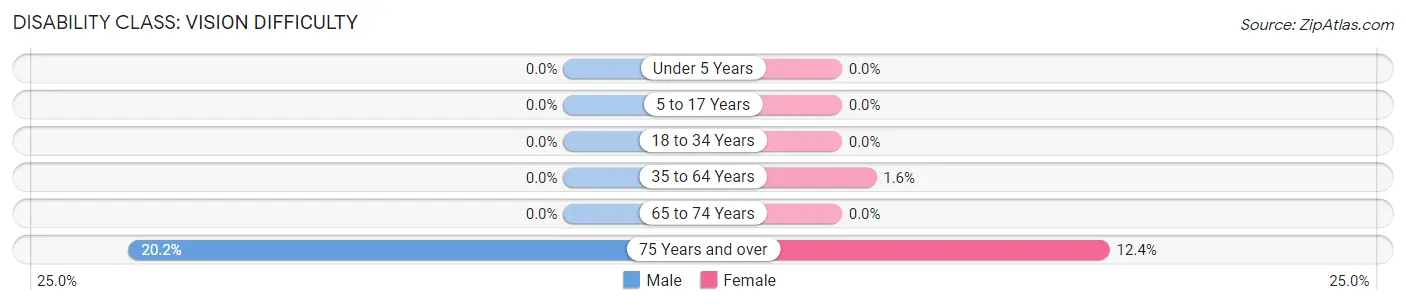
| Age Bracket | Male | Female |
| Under 5 Years | 0 (0.0%) | 0 (0.0%) |
| 5 to 17 Years | 0 (0.0%) | 0 (0.0%) |
| 18 to 34 Years | 0 (0.0%) | 0 (0.0%) |
| 35 to 64 Years | 0 (0.0%) | 12 (1.6%) |
| 65 to 74 Years | 0 (0.0%) | 0 (0.0%) |
| 75 Years and over | 22 (20.2%) | 42 (12.4%) |
Disability Class: Cognitive Difficulty
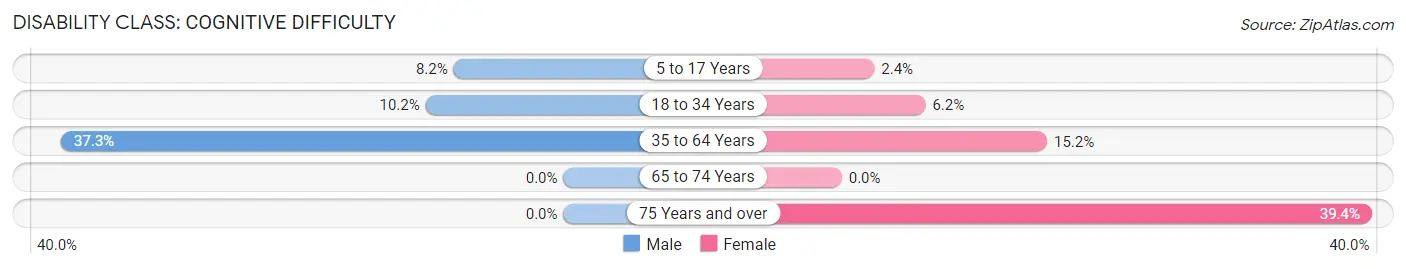
| Age Bracket | Male | Female |
| 5 to 17 Years | 26 (8.2%) | 6 (2.4%) |
| 18 to 34 Years | 85 (10.2%) | 44 (6.2%) |
| 35 to 64 Years | 251 (37.3%) | 114 (15.2%) |
| 65 to 74 Years | 0 (0.0%) | 0 (0.0%) |
| 75 Years and over | 0 (0.0%) | 133 (39.4%) |
Disability Class: Ambulatory Difficulty
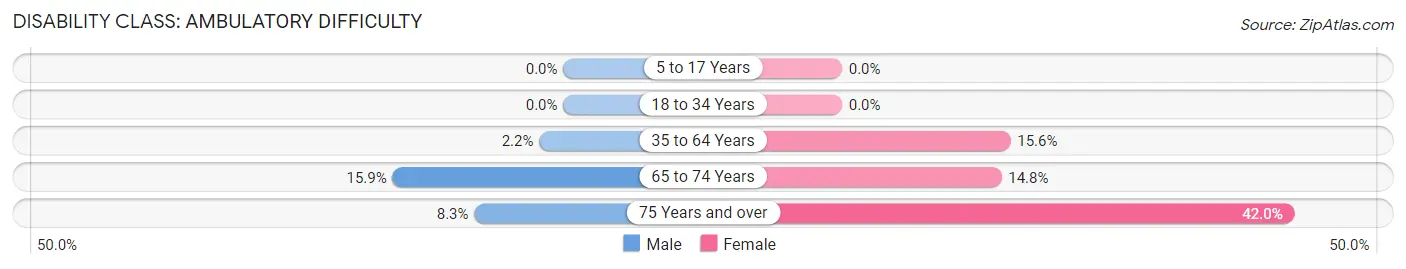
| Age Bracket | Male | Female |
| 5 to 17 Years | 0 (0.0%) | 0 (0.0%) |
| 18 to 34 Years | 0 (0.0%) | 0 (0.0%) |
| 35 to 64 Years | 15 (2.2%) | 117 (15.6%) |
| 65 to 74 Years | 26 (15.9%) | 33 (14.8%) |
| 75 Years and over | 9 (8.3%) | 142 (42.0%) |
Disability Class: Self-Care Difficulty
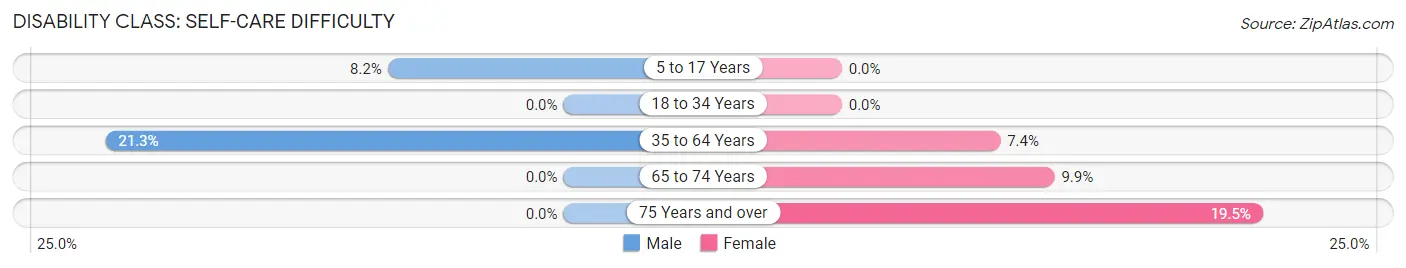
| Age Bracket | Male | Female |
| 5 to 17 Years | 26 (8.2%) | 0 (0.0%) |
| 18 to 34 Years | 0 (0.0%) | 0 (0.0%) |
| 35 to 64 Years | 143 (21.2%) | 55 (7.3%) |
| 65 to 74 Years | 0 (0.0%) | 22 (9.9%) |
| 75 Years and over | 0 (0.0%) | 66 (19.5%) |
Technology Access in Littleton
Computing Device Access in Littleton
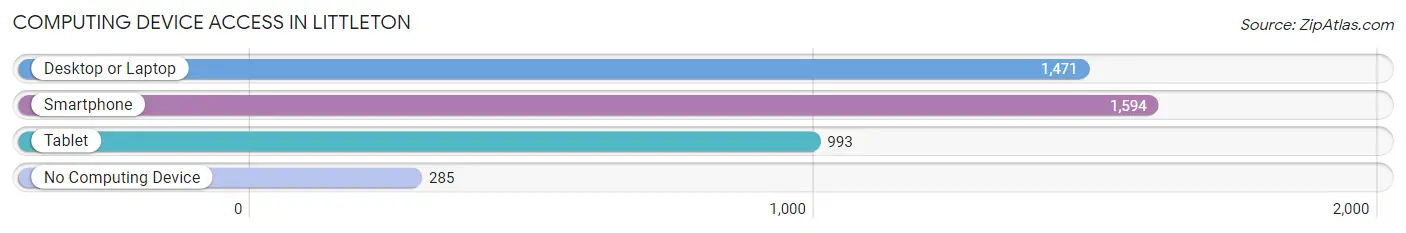
| Device Type | # Households | % Households |
| Desktop or Laptop | 1,471 | 69.8% |
| Smartphone | 1,594 | 75.6% |
| Tablet | 993 | 47.1% |
| No Computing Device | 285 | 13.5% |
| Total | 2,109 | 100.0% |
Internet Access in Littleton
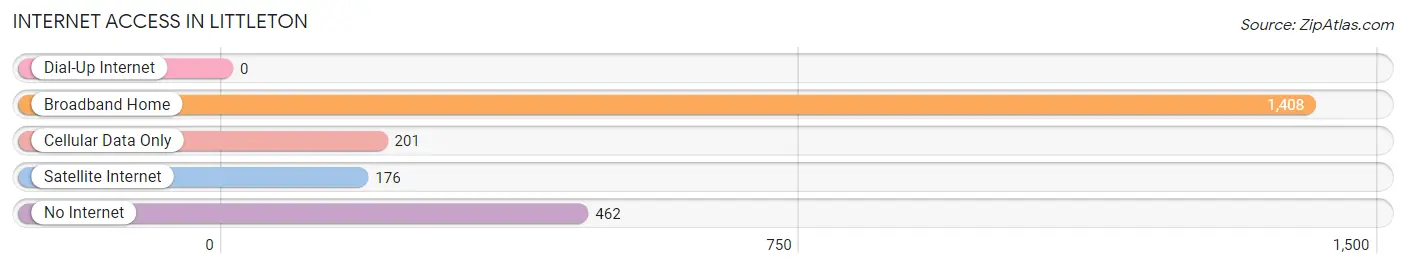
| Internet Type | # Households | % Households |
| Dial-Up Internet | 0 | 0.0% |
| Broadband Home | 1,408 | 66.8% |
| Cellular Data Only | 201 | 9.5% |
| Satellite Internet | 176 | 8.4% |
| No Internet | 462 | 21.9% |
| Total | 2,109 | 100.0% |
Littleton Summary
Littleton, New Hampshire is a small town located in the White Mountains region of the state. It is situated in the northern part of Grafton County, and is bordered by the towns of Franconia, Bethlehem, and Lisbon. The town has a population of approximately 4,500 people, and is known for its picturesque scenery and outdoor activities.
History
Littleton was first settled in 1764 by a group of settlers from Massachusetts. The town was originally known as "Little Town" due to its small size, but was later changed to Littleton in 1820. The town was incorporated in 1836, and was named after the town of Littleton, Massachusetts.
The town was primarily an agricultural community until the late 19th century, when the railroad arrived in the area. This allowed for the development of the town's lumber and paper industries, which were the main sources of employment for many years.
Geography
Littleton is located in the White Mountains region of New Hampshire, and is situated in the northern part of Grafton County. The town is bordered by the towns of Franconia, Bethlehem, and Lisbon. The town is located at the confluence of the Ammonoosuc and Connecticut Rivers, and is surrounded by the White Mountain National Forest.
The town has a total area of 24.2 square miles, of which 24.1 square miles is land and 0.1 square miles is water. The highest point in the town is the summit of Mount Moosilauke, which has an elevation of 4,802 feet.
Economy
Littleton's economy is largely based on tourism and outdoor recreation. The town is home to several ski resorts, including Cannon Mountain and Loon Mountain, which attract visitors from all over the world. The town is also home to several outdoor recreation areas, including Franconia Notch State Park and the White Mountain National Forest.
The town is also home to several manufacturing companies, including a paper mill and a lumber mill. These companies provide employment for many of the town's residents.
Demographics
As of the 2010 census, there were 4,527 people, 1,945 households, and 1,097 families residing in the town. The population density was 187.7 people per square mile. The racial makeup of the town was 97.2% White, 0.5% African American, 0.3% Native American, 0.5% Asian, 0.1% Pacific Islander, 0.3% from other races, and 1.1% from two or more races. Hispanic or Latino of any race were 1.2% of the population.
The median income for a household in the town was $41,944, and the median income for a family was $50,917. The per capita income for the town was $21,945. About 8.2% of families and 11.2% of the population were below the poverty line, including 15.2% of those under age 18 and 8.2% of those age 65 or over.
Common Questions
What is Per Capita Income in Littleton?
Per Capita income in Littleton is $44,749.
What is the Median Family Income in Littleton?
Median Family Income in Littleton is $49,395.
What is the Median Household income in Littleton?
Median Household Income in Littleton is $40,873.
What is Income or Wage Gap in Littleton?
Income or Wage Gap in Littleton is 21.1%.
Women in Littleton earn 78.9 cents for every dollar earned by a man.
What is Family Income Deficit in Littleton?
Family Income Deficit in Littleton is $8,736.
Families that are below poverty line in Littleton earn $8,736 less on average than the poverty threshold level.
What is Inequality or Gini Index in Littleton?
Inequality or Gini Index in Littleton is 0.66.
What is the Total Population of Littleton?
Total Population of Littleton is 4,587.
What is the Total Male Population of Littleton?
Total Male Population of Littleton is 2,096.
What is the Total Female Population of Littleton?
Total Female Population of Littleton is 2,491.
What is the Ratio of Males per 100 Females in Littleton?
There are 84.14 Males per 100 Females in Littleton.
What is the Ratio of Females per 100 Males in Littleton?
There are 118.85 Females per 100 Males in Littleton.
What is the Median Population Age in Littleton?
Median Population Age in Littleton is 34.2 Years.
What is the Average Family Size in Littleton
Average Family Size in Littleton is 2.8 People.
What is the Average Household Size in Littleton
Average Household Size in Littleton is 2.1 People.
How Large is the Labor Force in Littleton?
There are 2,352 People in the Labor Forcein in Littleton.
What is the Percentage of People in the Labor Force in Littleton?
59.7% of People are in the Labor Force in Littleton.
What is the Unemployment Rate in Littleton?
Unemployment Rate in Littleton is 5.1%.